

- Share
Is the Middle Class Worse Off Than It Used to Be?
We analyze how median real incomes in the United States have changed since 1980 under a definition of the middle class that adjusts for changes in demographics. We find that failing to adjust for demographic shifts in the population relating to age, race, and education can indicate a more positive outlook than is truly the case. We also find that the real median incomes of today’s middle class are somewhat higher than they used to be, particularly for households headed by two adults. We find, as in prior research, that prices for housing, healthcare, and education have risen more than middle-class incomes, while prices for transportation, food, and recreation have risen less than middle-class incomes.


The views authors express in Economic Commentary are theirs and not necessarily those of the Federal Reserve Bank of Cleveland or the Board of Governors of the Federal Reserve System. The series editor is Tasia Hane. This paper and its data are subject to revision; please visit clevelandfed.org for updates.
Is the middle class in the United States worse off than it was a few decades ago? Many seem to think so. Getlen (2018), for example, states that the middle class is being “wiped out” by increases in the price of housing, education, child care, and healthcare, sources of what he deems to be increased hardship on the middle class. Others cite the rising costs of education (Spencer, 2018) as a primary contributor to the relative decline of the middle class, and still others cite the increasing reliance on having two incomes per household (Krause and Sawhill, 2018). However, not everyone agrees with this view. Pethokoukis (2018) uses patterns in middle-class consumption, rather than income, to assert that the middle class is “absolutely better off now” than it used to be, while, using a different measure, Cline (2019) finds that median incomes have risen modestly over the past 50 years.
Such disagreement arises in part because there are multiple benchmarks against which one might compare today’s middle class. In other words, the change in the well-being of the middle class depends on the group with which you compare it. Reeves (2019) outlines four main benchmarks to which today’s middle class is often compared: (1) economic brackets above the middle class in each time period, (2) the middle class in previous decades, (3) each individual’s previous economic history, and (4) people’s expectations for how the middle class should be doing.
We choose to compare today’s middle class with the middle class in previous decades, the second comparison group on Reeves’s list. Because inequality is often viewed as being related to the decline of the middle class, we choose to compare recent data with a base year from before inequality began to accelerate. Accordingly, we choose 1980 as our comparison year because it predates the rise in income inequality, wealth inequality (Saez and Zucman, 2016), and a reduced share of employment for occupations that require mid-level skills (Jaimovich and Siu, 2012). Furthermore, we use a definition of the middle class that takes demographic shifts into account.
Our results show that real incomes for today’s middle class are somewhat higher than in 1980, particularly for households with two adults. It is also clear that failing to adjust for demographic shifts in the population relating to age, race, and education can indicate a more positive outlook than is truly the case.
Defining the Middle Class
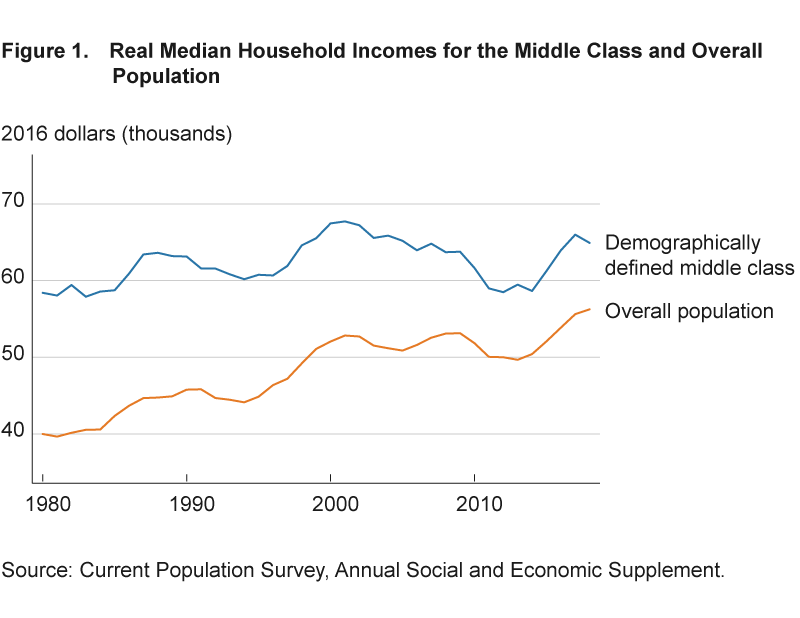
One straightforward way to evaluate how economic well-being has changed for the middle class is to look at the real median household income over time. Examining median incomes is appealing because it is simple, resistant to outliers, and aligns with the intuition that the middle class falls in the middle of the income distribution. We use data on incomes from the Annual Social and Economic Supplement (ASEC) from the Current Population Survey. The ASEC provides a self-reported, pretax measure of household incomes in the United States, which we deflate using the personal consumption expenditure (PCE) price index.1 Plotting these data shows that median household income has been increasing over time and is higher now than in 1980, despite a decade of stagnation in the 2000s (figure 1, orange line).
Despite the virtue of its simplicity, using real median household income as a measure of middle-class well-being has some shortcomings. The main drawback for the question we are investigating is that the population in the United States looks much different in 2018 than it did in 1980. Households today are smaller, older, more educated, and more racially and ethnically diverse on average than they were 40 years ago. Because older and more educated people tend to have higher incomes than younger and less-educated people, these demographic shifts could raise the median income, without necessarily indicating that any particular group is better off. Said differently, a typical person of any given age and education level in 2018 may not have a higher real income now than he or she would have had in 1980. Rather, there is a larger share of people who are middle-aged and highly educated, and this larger share pulls up the median income. On the other hand, there is also a larger share of black and Hispanic people in the United States today than in 1980, and these groups have tended toward lower incomes on average, a circumstance that would have the opposite effect.
To accommodate these demographic shifts, Emmons and Noeth (2015a) use a demographic-based definition of the middle class that takes into account age, race, ethnicity, and educational attainment, which gives a clearer picture of how economic prospects have changed over time aside from demographic changes. Under this definition, households are classified as middle class based on the demographic characteristics of the householder, typically the person under whose name the housing unit is owned or rented. Households considered to be middle class under this definition are those whose householders’ demographic characteristics are not typically associated with being chronically upper or lower class. Demographic characteristics associated with being chronically lower class include “being young, having less than a high school education, and being a member of a historically disadvantaged minority,” while characteristics associated with being upper class include “being middle-aged or older, having a college degree, and being white or Asian”2 (Emmons and Noeth, 2015a).
Emmons and Noeth (2015a) use the following definition of a demographic middle class:
- Age 40+, and
- White or Asian with exactly a high school diploma, or black or Hispanic with a two- or four-year college degree.
We modify Emmons and Noeth’s definition slightly to focus on households whose householder is aged 40 to 55, the ages where income is the most stable. We exclude those over 55 years of age to focus on the typical working middle-aged population, rather than retirees and those who are cutting back work hours due to age. To be clear, households with householders who are not ages 40 to 55 may well be part of the middle class, but we restrict the age range to reduce the effect of age as a confounding factor on income. Roughly one-fifth of households fit this demographic definition of the middle class.
Middle-Class Incomes
In figure 1 we plot the real median household income of the overall population and of the middle class as we defined it through demographics. The blue line in figure 1 shows that the real median household income for the demographically defined middle class is higher than that for the general population (the orange line) over the whole time period, which is likely because individuals ages 40 to 55 tend to have higher incomes on average than other age cohorts (Semega et al., 2019). However, the median income of the demographically defined middle class increased much more slowly than that of the overall population. The median income of the overall population has a clear upward trend since 1980, increasing by nearly 40 percent, while the median income of the demographically defined middle class has increased only marginally. The difference in income growth between these two groups supports the idea that the baby boomer generation pulled the overall median income down in the 1980s when it was relatively young but then pulled the overall median income up in later years as the generation aged.
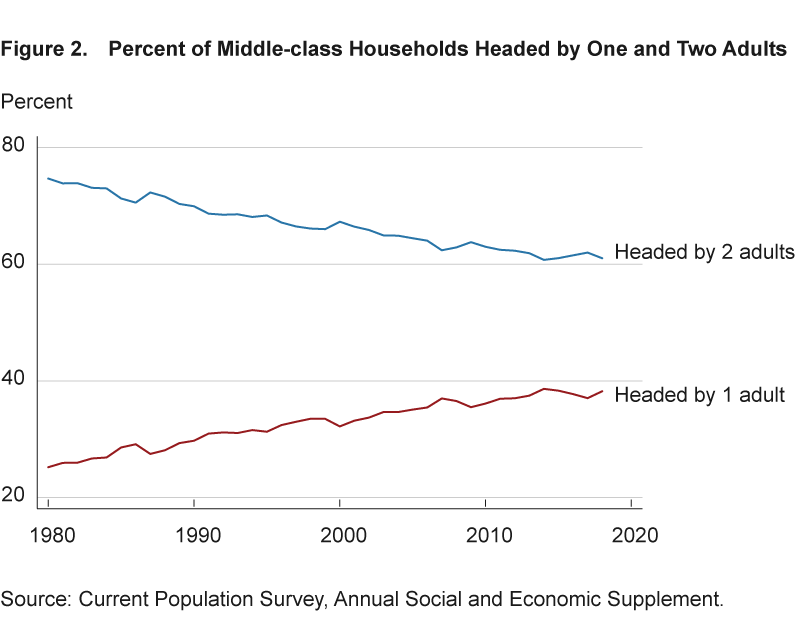
Our demographic definition of the middle class helps adjust for changes in race, education, and age that have occurred in the past few decades. However, this definition does not take into account the change in average household size that has also occurred over this time period. On average, individuals are less likely to live with a cohabitating partner in 2018 than they were in 1980, as shown in figure 2. Households headed by two adults tend to have a higher household income and often benefit from shared living expenses and division of household responsibilities. Therefore, the rising share of households having only one adult may have reduced median income growth even within the demographic middle class.
To account for this complication, we also evaluate income growth separately for households headed by one and two adults within our demographic definition of the middle class. We consider households to be headed by two adults if the householder is married or has an unmarried cohabitating partner. However, identifying unmarried cohabitating partners in the data is difficult because there is not a consistent measure of nonmarital cohabitation that stretches back to 1980. To determine which households are headed by unmarried cohabitating partners, we use the definition coined by Casper and Cohen (2000). Under this definition, households that meet the following criteria are considered to be headed by unmarried cohabitating partners: (1) they contain one adult (age 15+) in addition to the householder who is the opposite sex of the householder, not in a related subfamily, and not related to, or a foster child of, the householder; and (2) there are no other adults in the household, except for relatives and foster children of the householder and children of unrelated subfamilies.
We consider households that meet the above criteria, or whose householder is married, to be households headed by two adults. We do not include same-sex unmarried cohabitating partners as households headed either by one adult or by two adults because it is difficult to identify these couples in the data before 1995. However, we do include them in the overall demographic middle class.
Figure 3 shows real median middle-class household incomes overall and by number of household heads. The green line repeats the real median household income for all of the demographic middle class from figure 1. The blue line shows the median household income for middle-class households headed by two adults, and the red line shows the median household income for middle-class households headed by one adult. Because households headed by two adults often have higher incomes than households headed by one adult, movements in the real median income for the whole middle class reflect changes in the share of households headed by one adult versus two, in addition to changes in the median income within each type of household. Looking at the red and blue lines allows us to see income growth within households headed by one or two adults, separate from the change in shares.
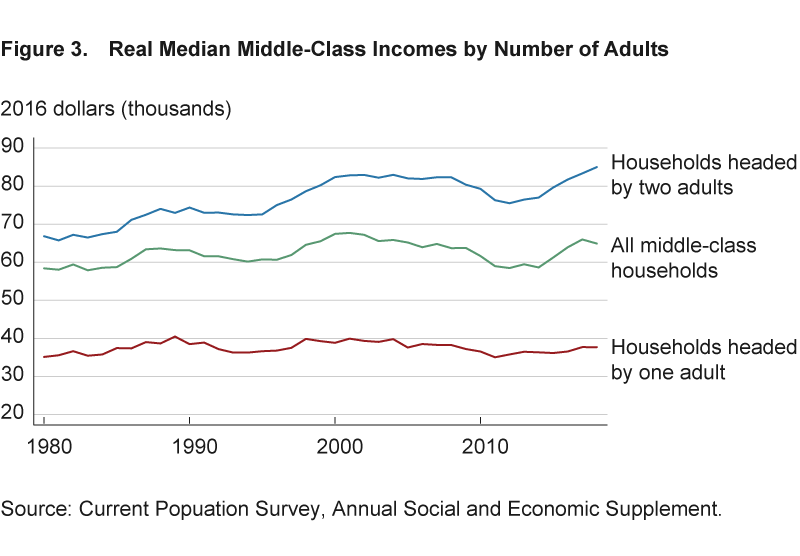
Households headed by two adults have experienced some real income growth since 1980. Some of this growth could be a result of an increase in assortative mating, wherein individuals tend to marry someone who has a similar level of education and income (Greenwood et al., 2016), combined with rising overall wage inequality and rising female labor force participation.
The main takeaways from examining real median household incomes are that the growth of median incomes is much smaller after adjusting for demographic shifts in the population and that middle-class incomes have increased for households headed by two adults since 1980 but have stayed fairly flat for households headed by one adult. Since households headed by one and two adults have different trends over time, we analyze the two groups separately for the rest of this Commentary.
How Have Prices Changed Relative to Incomes?
Figure 3 shows that real median incomes for the demographically defined middle class have increased by between 5 percent and 30 percent between 1980 and 2018, depending on whether a household is headed by one adult or two. This finding raises the following question: Why is there such a discrepancy between the dismal perception of the middle class and our finding that middle-class incomes are rising, if only slightly? One possibility is that other authors and readers are comparing the middle class to one of the other benchmarks outlined by Reeves (2019).
Other possibilities may be related to variability in price changes across different categories of spending. Our finding that middle-class income growth is positive indicates that nominal incomes are rising faster than prices overall. However, this does not necessarily imply that purchasing power has increased in all areas of consumer spending. In other words, variability in price changes across different categories could lead to a decrease in purchasing power in some areas of consumption, despite an increase in purchasing power overall.
These differences in price changes are important because consumers do not necessarily approach all categories of consumption the same way. For example, consumption is more sensitive to prices in some categories than others, making it difficult to consume less in some categories if the price increases.
Additionally, variability in price changes across categories may affect people’s perceptions of the economic well-being of the middle class. It is widely documented that individuals tend to focus on negative outcomes more than positive ones, as seen in research on “negativity bias” (Rozin and Royzman, 2001), and loss aversion, in which people tend to pay more attention to losses than to gains and prefer avoiding negative outcomes to acquiring positive outcomes of the same magnitude (Tversky and Kahneman, 1974). We can think of relative price increases as losses and relative price decreases as gains. Loss aversion and negativity bias may imply that if purchasing power has decreased in some aspects of spending, people might pay more attention to these losses than equivalent gains in other categories, which could lead to a more pessimistic view of how well the middle class is doing.
We compare how prices in different categories of consumption have changed relative to nominal incomes. For this exercise, we use data on prices and expenditures from the national income and product accounts (NIPA). In these data, goods and services are sorted into 12 main categories by their function, which are listed in figure 4. Data from NIPA are available only in aggregate, so the data represent the entire population, not just the demographically defined middle class. Because households in the demographically defined middle class may have different consumption patterns and geographic distribution than the overall population, the NIPA data on expenditures and prices of the overall population may not align with that for the middle class. However, we expect that these data offer a useful approximation of expenditures and prices experienced by the middle class.
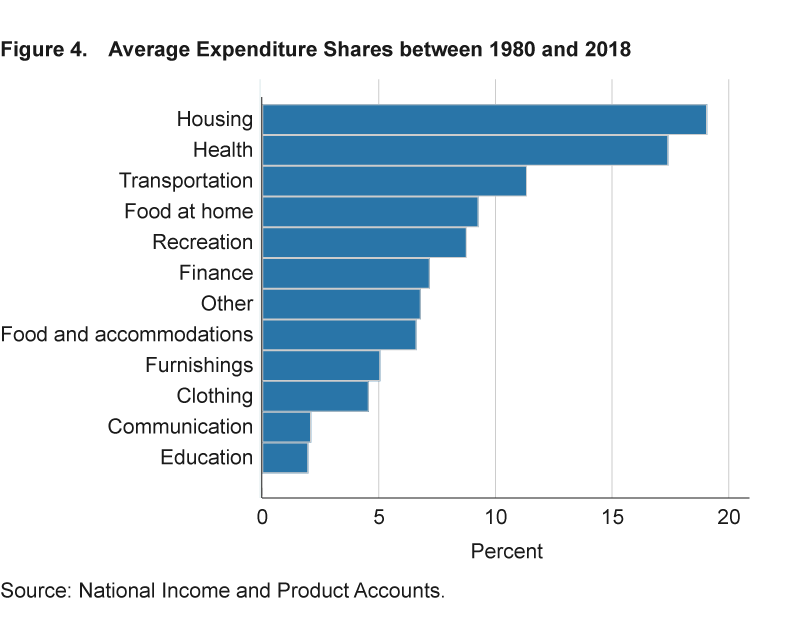
We start off by determining which categories make up the largest portion of expenditures. Figure 4 shows the percentage of total expenditures that households spent on each category on average between 1980 and 2018. Health and housing are by far the two largest categories, together making up close to 40 percent of total expenditures. Transportation and food at home are the next largest, while education is the smallest category, making up only 2 percent of total expenditures.
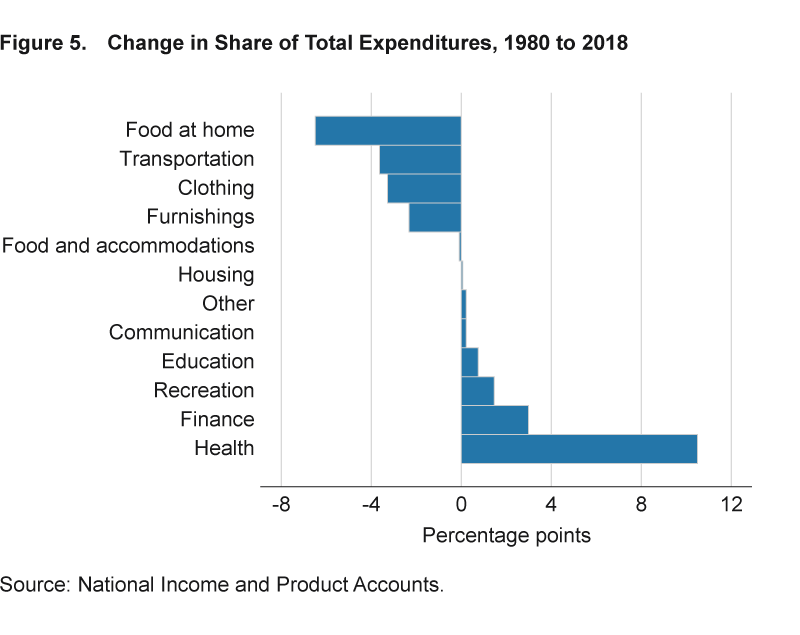
Next, we see how the composition of the average consumer’s expenditures has changed since 1980. In figure 5, a positive value means the average household spends a larger share of its expenditures on that particular category in 2018 than 1980, while a negative number means it spends a smaller share. The share spent on health was nearly twice as large in 2018 as it was in 1980, whereas the share spent on housing remained unchanged. People spent a smaller share on other necessities such as transportation, food, and clothing in 2018 compared to 40 years ago.
We next compare percent changes in prices for these categories with percent changes in nominal incomes for the middle class. This allows us to see whether prices in each category have increased more or less than middle-class incomes. Price changes are measured using the PCE price index for each category of good or service. PCE price indices measure how much the prices of items in each category change from year to year while also attempting to take into account changes in quality.3 Figure 6 shows the percent change in PCE prices for each category less the percent change in the nominal median income for middle-class households.
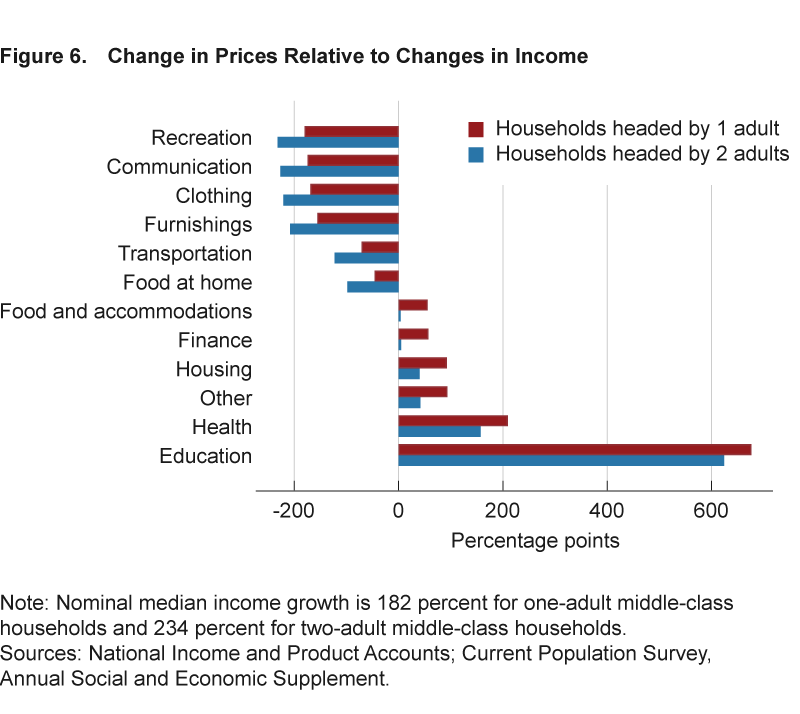
Categories in which prices have increased more than middle-class incomes have a positive value, while categories in which prices have increased less than middle-class incomes have a negative value. A positive value indicates that the median middle-class income provides less purchasing power in these categories in 2018 than in 1980, and a negative value indicates more purchasing power. Because we do not have separate price indices for one- and two-adult households, the bars for one-adult and two-adult households in figure 6 differ in all cases by 53 percentage points, the percentage difference in nominal incomes of one-adult and two-adult households.
For both types of households, prices in the two largest expenditure categories, health and housing, increased more than nominal incomes. Additionally, education is an obvious outlier, where prices have increased over 600 percentage points more than incomes. This finding echoes what many authors have found: that health, housing, and education are a much larger burden than they used to be for the middle class (for example, Getlen, 2018, and Spencer, 2018). However, we also find that prices in nearly every other category have decreased relative to middle-class incomes, making these items relatively cheaper and more accessible. This includes some major categories such as food and transportation, with the biggest decrease being in recreation.
Conclusion
In comparing household incomes of the middle class in the United States in 1980 to today, we conclude that real incomes for today’s middle class are somewhat higher than they used it to be, particularly for households headed by two adults. It is also clear that failing to adjust for demographic shifts in the population relating to age, race, and education can indicate a more positive outlook than is truly the case.
We find, as in prior research, that prices in housing, healthcare, and education have risen more than middle-class incomes and so are relatively more expensive. However, we also find that these price increases are offset by relative price decreases in transportation, food, and recreation, among others, making real middle-class incomes slightly higher than in the past.
Footnotes
- The choice of deflator can make a considerable difference when comparing median incomes over time. Although we choose to use the PCE, many other papers use the consumer price index. For more information on the difference between these two deflators, see Haubrich and Millington (2014). Return
- For more information, see Emmons and Noeth (2015b). Return
- For example, if the price of an item rises but there is no change in quality, then the price index will go up. Alternatively, if the price of the item rises in a way that solely reflects a change in quality, then the index remains unchanged. Return
References
- Casper, Lynne M., and Philip N. Cohen. 2000. “How Does POSSLQ Measure Up? Historical Estimates of Cohabitation.” Demography, 37(2): 237–245. https://doi.org/10.2307/2648125.
- Cline, William. 2019. “US Capitalism Is Fairer Than You Think.” Financial Times (July 7).
Emmons, William R., and Bryan J. Noeth. 2015a. “The Middle Class May Be under More Pressure Than You Think.” Federal Reserve Bank of St. Louis, In the Balance, Issue 11. - Emmons, William R., and Bryan J. Noeth. 2015b. “Race, Ethnicity, and Wealth.” (February). Federal Reserve Bank of St. Louis, Demographics of Wealth, Essay No. 1.
- Getlen, Larry. 2018. “America’s Middle Class Is Slowly Being Wiped Out.” The New York Post (July 23).
- Greenwood, Jeremy, Nezih Guner, Georgi Kocharkov, and Cezar Santos. 2016. “Technology and the Changing Family: A Unified Model of Marriage, Divorce, Educational Attainment, and Married Female Labor-Force Participation. American Economic Journal: Macroeconomics, 8(1): 1–41. https://doi.org/10.1257/mac.20130156.
- Haubrich, Joseph G., and Sara Millington. 2014. “PCE and CPI Inflation: What’s the Difference?” Federal Reserve Bank of Cleveland, Economic Trends (April 17).
- Jaimovich, Nir, and Henry E. Siu. 2012. “The Trend Is the Cycle: Job Polarization and Jobless Recoveries.” Federal Reserve Bank of St. Louis conference paper.
- Krause, Eleanor, and Isabel V Sawhill. 2018. “Seven Reasons to Worry about the American Middle Class.” Brookings Institution, Middle Class Memos (June 5).
- Pethokoukis, James. 2018. “The American Middle Class Is Absolutely Better off Now Than It Was Decades Ago.” American Enterprise Institute, AEI Ideas (January 10). Reeves, Richard V. 2019. “A Middle Class Theory of Relativity: 4 Benchmarks.” Brookings Institution, Middle Class Memos (April 10).
- Rozin, Paul, and Edward B. Royzman. 2001. “Negativity Bias, Negativity Dominance, and Contagion.” Personality and Social Psychology Review, 5(4): 296–321. https://doi.org/10.1207/s15327957pspr0504_2.
- Saez, Emmanuel, and Gabriel Zucman. 2016. “Wealth Inequality in the United States since 1913: Evidence from Capitalized Income Tax Data.” Quarterly Journal of Economics, 131(2): 519–578. https://doi.org/10.1093/qje/qjw004.
- Semega, Jessica, Melissa Kollar, John Creamer, and Abinash Mohanty. 2019. “Income and Poverty in the United States: 2018.” US Census Bureau, Current Population Reports.
- Spencer, Kyle. 2018. “Middle-Class Families Increasingly Look to Community Colleges.” The New York Times (April 5).
Tversky, Amos, and Daniel Kahneman. 1974. “Judgment under Uncertainty: Heuristics and Biases.” Science, 185(4157): 1124–1131. https://doi.org/10.1126/science.185.4157.1124.
Suggested Citation
Dohrman, Emily, and Bruce Fallick. 2020. “Is the Middle Class Worse Off Than It Used to Be?” Federal Reserve Bank of Cleveland, Economic Commentary 2020-03. https://doi.org/10.26509/frbc-ec-202003
This work by Federal Reserve Bank of Cleveland is licensed under Creative Commons Attribution-NonCommercial 4.0 International

