

- Share
The Opioid Epidemic and the Labor Market
Drug overdoses now account for more deaths in the United States than traffic deaths or suicides, and most of the increase in overdose deaths since 2010 can be attributed to opioids--a class of drugs that includes both prescription pain relievers and illegal narcotics. We look at trends in drug use and overdose deaths to document how the opioid epidemic has evolved over time and to determine whether it could be large enough to impact the labor force.
The views authors express in Economic Commentary are theirs and not necessarily those of the Federal Reserve Bank of Cleveland or the Board of Governors of the Federal Reserve System. The series editor is Tasia Hane. This paper and its data are subject to revision; please visit clevelandfed.org for updates.
The popular press has reported on factories reducing output because of a drug-induced labor shortage (Schwartz, 2017). According to one factory owner in Youngstown, Ohio, “There are good-paying jobs and the opportunity for people in our area. We just can’t find people to show up who can pass a drug test” (King, 2017). These anecdotes coincide with an increase in the rate of premature deaths since 2012, with drug overdose deaths now the leading single cause (Givens et al., 2017). Most of the rapid increase in overdose deaths since 2010 can be attributed to opioids.
In this Economic Commentary, we look at trends in overdose deaths and drug use to document how the opioid epidemic has evolved over time. We find that rising overdose death rates are a clear signal that the situation is getting worse, and that while our estimates of usage rates are very uncertain, they suggest that the opioid epidemic could be large enough to have an impact on the labor force. Two clear conclusions from our analysis are that we need better data to understand the opioid epidemic, and that the relationship between drug use and the labor market warrants further study.
Opioids and Rising Overdose Deaths
According to the National Institute on Drug Abuse (NIDA), “Opioids are a class of drugs that include the illegal drug heroin, synthetic opioids such as fentanyl, and pain relievers available legally by prescription, such as oxycodone (OxyContin), hydrocodone (Vicodin), codeine, morphine, and many others.”1
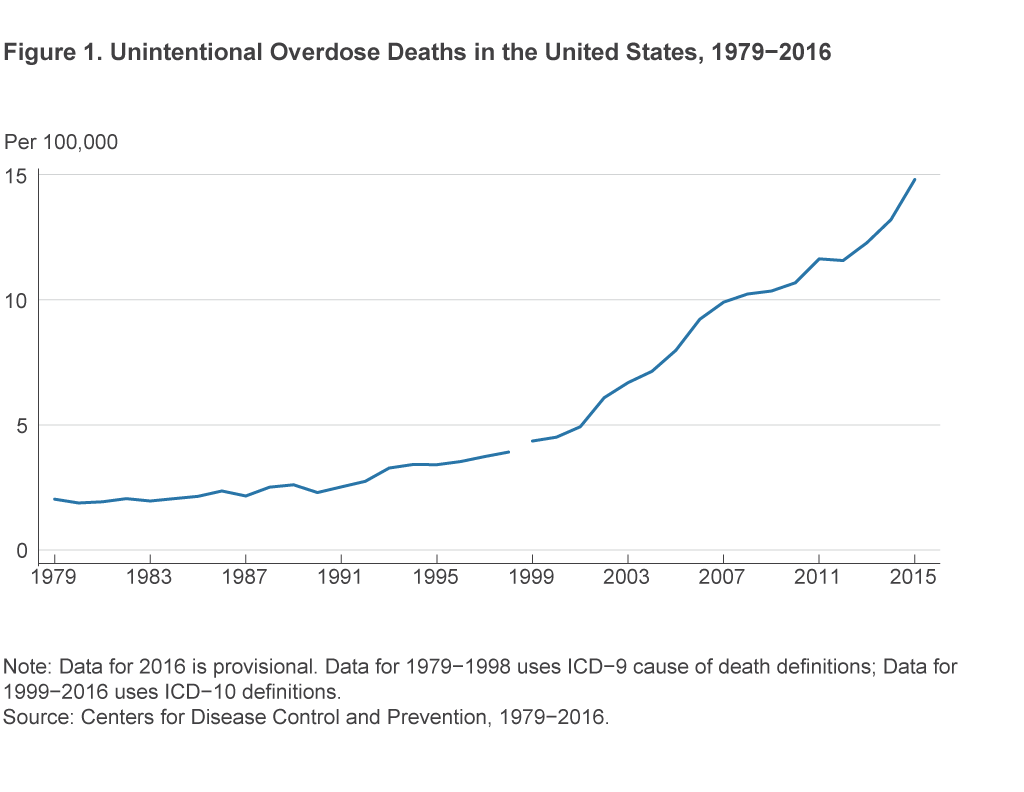
Drug overdoses currently account for more deaths in the United States than traffic deaths or suicides. The trend in unintentional drug overdose deaths seems to have changed around 1990 and again around 2000 (figure 1). In both 1990 and 2000 the rate increased and then continued at a linear pace for the next decade.2
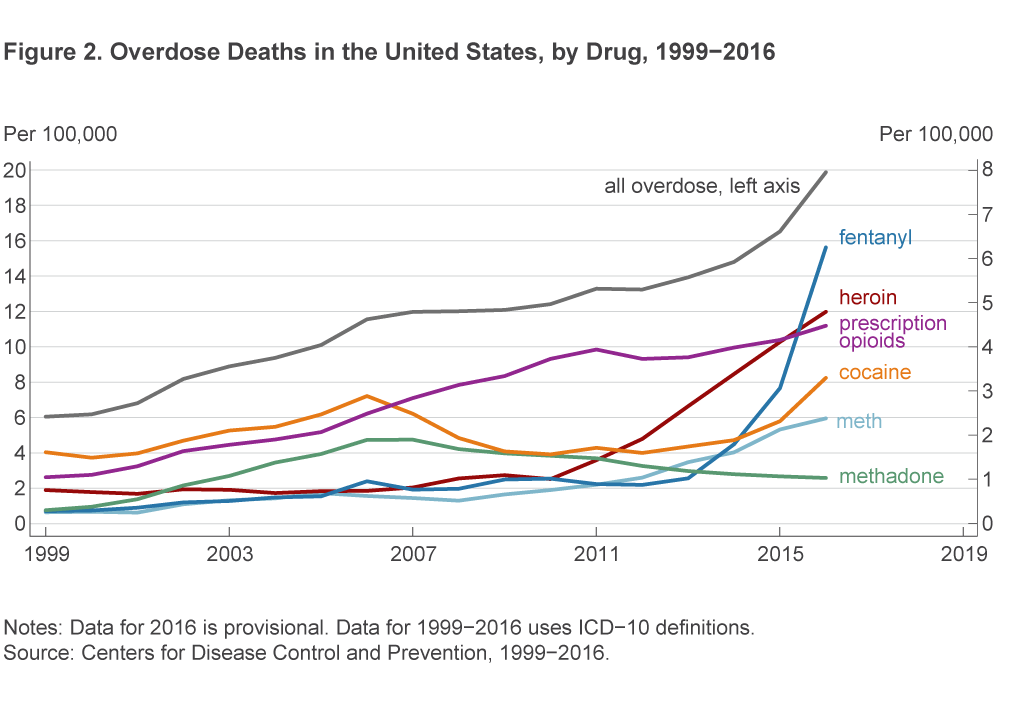
Most of the increase in overdose deaths since 2010 is due to the use of heroin and the synthetic opioid fentanyl. Overdose deaths involving heroin began increasing in 2005,3 with a dramatic change in pace that has been sustained since 2011 (figure 2). Deaths involving fentanyl nearly doubled from the previous year’s rate in 2014, 2015, and 2016.4 Note that the CDC’s system for attributing overdose deaths allows for multiple drugs to be listed on a single overdose death.5 This is important because added fentanyl is likely to be a key contributor to the recent increase in overdoses for several other classes of drugs.
It is worth noting that the Great Recession did not exacerbate the rate of increase in drug overdose deaths. The increase in deaths in the years before the Great Recession (2000–2007) was about the same size as the increase in the period after the Great Recession (2010–2016). In the period before the Great Recession, the average increase in drug overdose deaths was 9 percent per year, while in the period after, the average increase was 7.5 percent per year. In general, it has been difficult to assess how drug usage varies with the business cycle (Carpenter et al., 2017).
Measuring drug-related deaths is difficult, and the data above may severely undercount deaths from opioids and heroin. The death rate data come from the Centers for Disease Control (CDC), which collects information from death certificates listing a single underlying cause of death and up to 20 additional causes. Ruhm (2017) examines these CDC data from recent years and finds that for more than 20 percent of overdose deaths, no information about the specific drug responsible is available from the death certificate. This lack of information is due to the fact that reporting practices vary across states. When Ruhm uses econometric techniques to impute these missing data, he finds that in 2014, mortality rates were 24 percent greater for opioids and 22 percent greater for heroin.6
Drug Use
While the data on overdose deaths paint a grim picture, we are also interested in understanding whether the magnitude of the opioid crisis is large enough to have effects on the labor market. The possibility of such effects might not be immediately obvious. While 64,000 overdose deaths in 2016 represents a tremendous cost in terms of human suffering, this number represents only a tiny fraction of the nearly 160 million Americans in the civilian labor force (about 0.04 percent to be precise). However, the issue for labor markets pertains to usage, and recent research suggests that drug use could be high enough to impact the labor market.
While it is difficult to measure drug use, one indicator is the amount of opioids being prescribed, and this figure is alarming. Between 1999 and 2015, the amount of opioids prescribed per person in the United States tripled, with enough prescribed in 2015 for every American to be medicated continuously for three weeks.7 In 2016, Alan Krueger reported that nearly half of prime age men not in the labor force said they took pain medication on a daily basis. Krueger concluded that opioid availability could account for about 20 percent of the decline in the labor force participation of prime age males between 1999 and 2015 (Krueger, 2017).
Heroin
The abuse of prescription medication seems to be a gateway to heroin (Cicero et al., 2014), and there have been major changes in the supply of heroin since 2010. Most importantly, since 2013 heroin has increasingly been adulterated with the very dangerous synthetic opioid fentanyl (Ciccarone, 2017).8 Fentanyl is dangerous because it is 50 times more potent than heroin and 100 times more potent than morphine—just a small amount can cause breathing to stop. Another factor is that tolerance for opioids both ramps up and dissipates very rapidly, making it easy for someone who has relapsed to overdose (Hall, 2017). Since the market is completely unregulated, there is no way for consumers to know what is in their purchase, and fentanyl is not easily detected by the buyer (Katz, 2017).
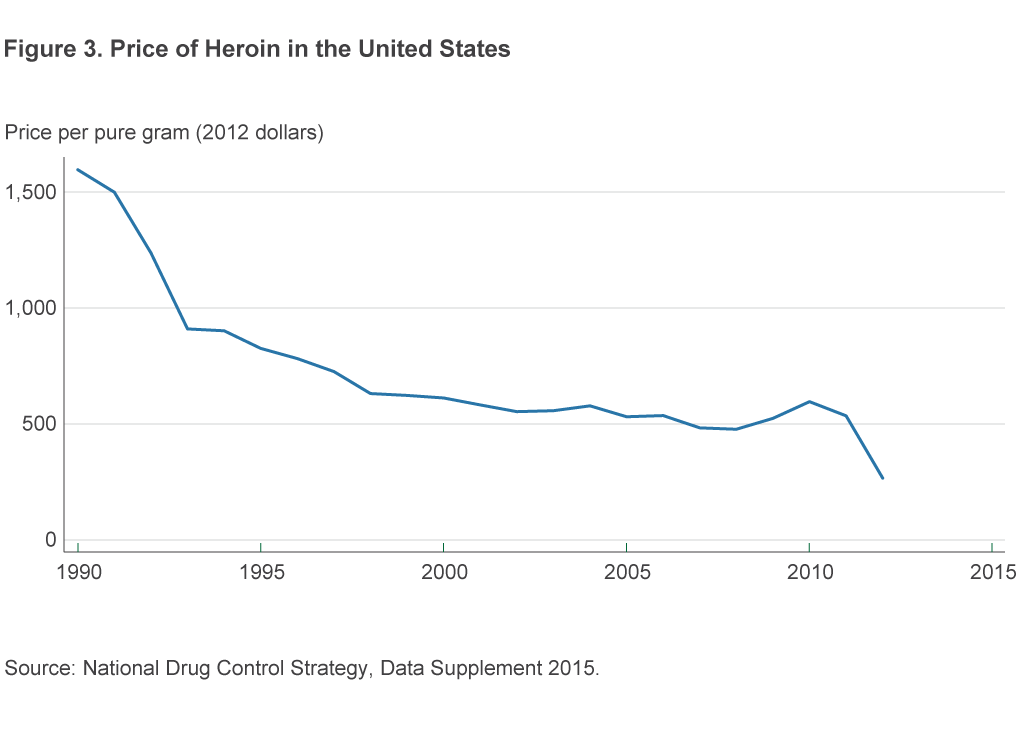
Although the price of heroin was relatively stable between the late 1990s and 2010, we do see a clear downturn since 2010 (figure 3). This decrease in the price of heroin corresponds to a 143 percent increase in heroin seizures between 2010 and 2015 (US DEA, 2016a).
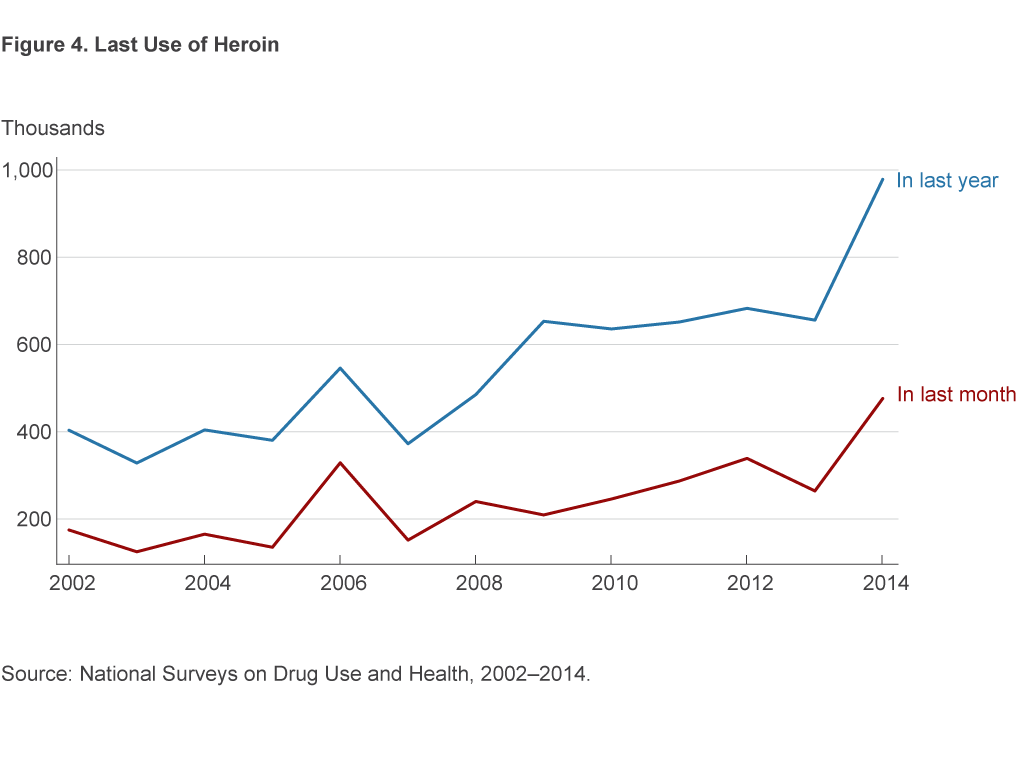
Some of the best data on heroin use come from the National Surveys on Drug Use and Health (NSDUH).9 Self-reported heroin use in the NSDUH has increased steadily since 2007, slightly preceding the period over which death rates have increased and prices decreased (figure 4).
Measuring heroin use is particularly difficult, though, and the data we have are likely to understate usage rates. The NSDUH excludes persons in institutional group quarters (hospitals, prisons, nursing homes, treatment centers) and the military, totaling 2 percent of the US population. Heavy users (those who consume on 21 or more days each month) are therefore often excluded from the NSDUH.10 Kilmer et al. (2014) estimate that there were nearly 1 million Americans in the group of heavy users, rather than the 60,000 counted in the NSDUH.11 One million heavy users would be enough to have serious implications for the labor market, as this number represents about one half of a percent of the US civilian labor force.
Kilmer et al. (2014) arrive at an estimate of heroin usage after carefully attempting to synthesize data from multiple sources. Two of the major data sources they use, the Arrestee Drug Abuse and Monitoring (ADAM) Program and the Drug Abuse Warning Network (tracking drug-related emergency room visits), have been discontinued. Our ability to efficiently respond to the opioid crisis is limited by our lack of understanding of basic facts about what is happening—this situation will not improve without access to data.
The Fourth District
The high rate of overdose deaths is spread across the country (figure 5). There are areas in the west and across the northeast that are hard-hit. The Fourth District is among the most affected areas. In Ohio, the hardest hit counties are in the southwest and northeast. Eastern Kentucky, western West Virginia, and western Pennsylvania all have high rates of overdose deaths.

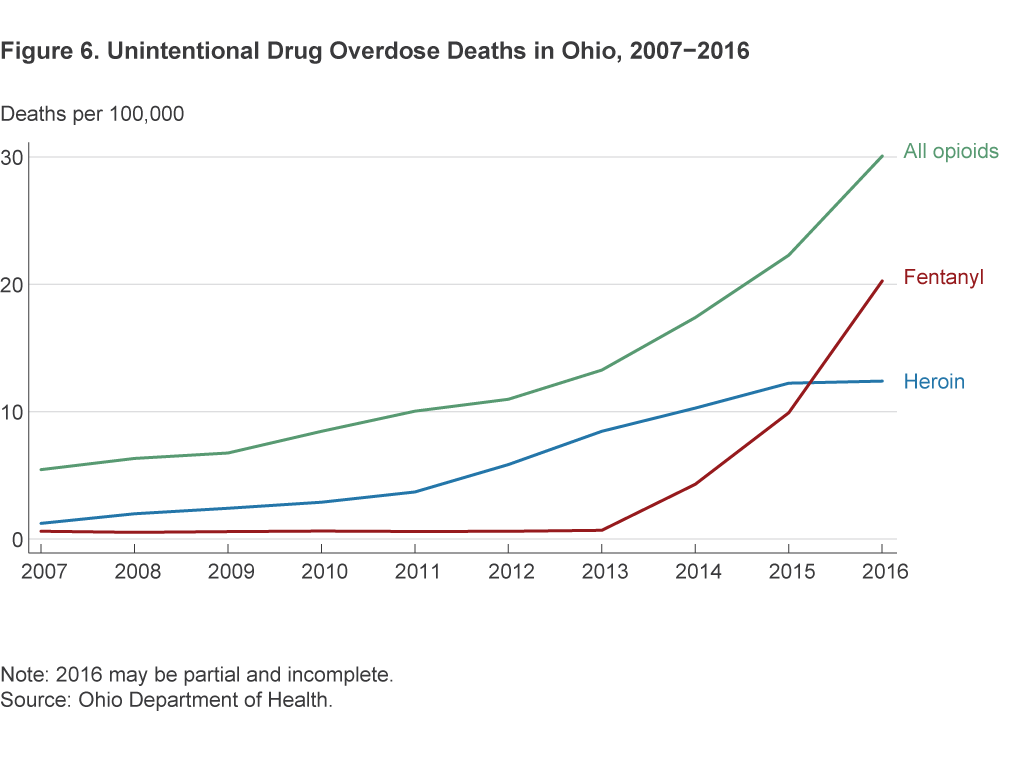
The time trends in overdose deaths in Ohio match those in the United States. Heroin deaths have increased continuously in Ohio since 2010, and fentanyl deaths have increased dramatically since 2013 (figure 6).
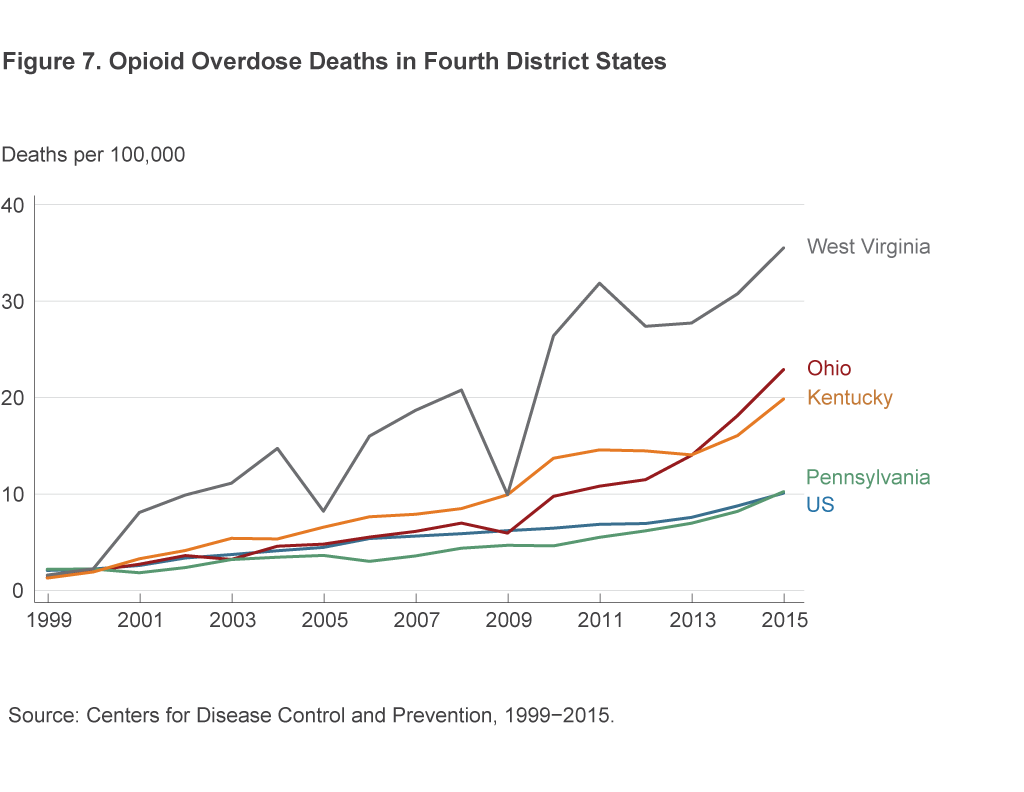
Total overdose deaths from any opioid are occurring at a much higher rate in Fourth District states than the US rate (figure 7).
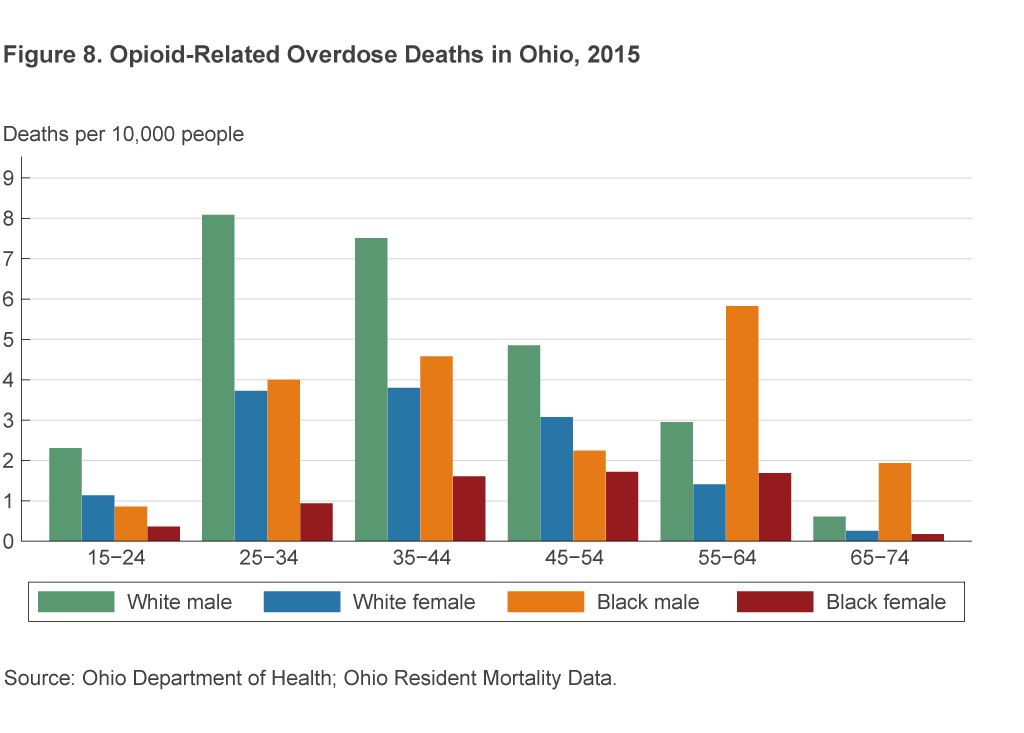
Looking at the demographics of opioid use in Ohio, we see that males ages 25–54 have the highest rates of opioid overdose (figure 8).
Conclusion
With opioid usage so large and increasing, one naturally wants to know what effect it is having on the labor market. Just how much has the opioid epidemic weakened labor market outcomes, and conversely, has weak labor demand during and after the Great Recession contributed to the increase in opioid usage and overdose deaths? Answering these questions requires accurate information, but unfortunately, there are reasons to doubt the accuracy of the only data we have. Knowing the appropriate policy response to the opioid epidemic requires a better understanding of the epidemic’s scope, its underlying mechanisms, and its connections to the labor market. Our future work will continue to study the role of opioid addiction and the labor market in the Fourth District.
Footnotes
- Basic information about commonly abused drugs can be found on the NIDA website, https://www.drugabuse.gov/drugs-abuse. Return to 1
- Although the CDC’s classification system changed between 1998 and 1999, and this would have changed the death rates due to individual drugs, it should not have affected the measurement of the overall unintentional overdose death rate. Return to 2
- See “Today’s Heroin Epidemic Infographics,” Centers for Disease Control and Prevention, https://www.cdc.gov/vitalsigns/heroin/infographic.html#graphic. Return to 3
- The most recent data available from the CDC are for the 12-month period ending in February 2017. https://www.cdc.gov/nchs/products/vsrr/drug-overdose-data.htm. Return to 4
- Prior to 1999, the CDC only attributed one drug to a drug overdose death. This change in classification system makes it difficult to measure overdose deaths from opioids in a comparable way before and after 1999, leading to our decision to focus in figure 1 on all unintentional overdose deaths dating back to 1979. Return to 5
- These percentages correspond with, respectively, 2.2 and 0.7 additional deaths per 100,000 people. Ruhm (2017) finds that the growth rate of opioid mortality was dramatically overestimated in Ohio from 2008 to 2014. Return to 6
- https://www.cdc.gov/vitalsigns/opioids/index.html. Return to 7
- There are several reasons why a dealer would add fentanyl into a batch of heroin (Drugs Forum, 2017). Synthetic opioids are cheap to produce. When added into a batch of heroin, even in small quantities, fentanyl can stretch a dealer’s supply. A user is also likely to get addicted more quickly when using heroin with fentanyl. Return to 8
- https://nsduhweb.rti.org/respweb/homepage.cfm. Return to 9
- Kilmer et al. (2014) finds that from 2000 to 2010, more than 75 percent of total consumption and expenditures on heroin were driven by the minority of heavy users. Return to 10
- Data from the National Epidemiologic Survey on Alcohol and Related Conditions indicate that an even larger, five-fold increase occurred in the share of respondents who had ever used heroin, increasing from 0.3 percent in 2001–2002 to 1.6 percent in 2011–2012 (Martins et al., 2017). Return to 11
References
- Carpenter, Christopher S., Chandler B. McClellan, and Daniel I .Rees, 2017. “Economic Conditions, Illicit Drug Use, and Substance Use Disorders in the United States,” Journal of Health Economics, 52, 63–73.
- Ciccarone, Daniel (2017). “Fentanyl in the US Heroin Supply: A Rapidly Changing Risk Environment,” International Journal of Drug Policy, 46, 107–111.
- Cicero, Theodore J., Matthew S. Ellis, Hilary L. Surratt, and Steven P. Kurtz (2014). “The Changing Face of Heroin Use in the United States,” JAMA Psychiatry, 71(7), 821–826.
- US Drug Enforcement Administration, 2016a. “National Heroin Threat Assessment Summary,” US Drug Enforcement Administration Intelligence Reports.
- US Drug Enforcement Administration, 2016b. “The Heroin Signature Program and Heroin Domestic Monitor Program: 2014 Reports.” US Drug Enforcement Administration Intelligence Reports.
- Drugs Forum, 2017. “Why Cut with Fentanyl?” Drugs Forum Information and Addiction Help Website.
- Givens, Marjory, Keith Gennuso, Amanda Jovaag, and Julie Willems Van Dijk, 2017. “2017 County Health Rankings: Key Findings Report.” Robert Wood Johnson Foundation and University of Wisconsin Population Health Institute.
- Hall, Orman, 2017. “Important Features of Opioid Addiction.” Presentation, Federal Reserve Bank of Cleveland Policy Summit on Housing, Human Capital, and Inequality.
- Katz, Josh, 2017. “Short Answers to Hard Questions about the Opioid Crisis,” The New York Times.
- Kilmer, B., S. Everingham, J. Caulkins, G. Midgette, R. Pacula, P. Reuter, R. Burns, B. Han, and R. Lundberg, 2014. “What America’s Users Spend on Illegal Drugs: 2000-2010,” RAND Corporation, Santa Monica.
- King, Alexandra, 2017. “This Ohio Factory Owner Says She Has Jobs but Few Sober Applicants,” CNN.
- Krueger, Alan B., 2017. “Where Have All the Workers Gone? An Inquiry into the Decline of the US Labor Force Participation Rate,” Brookings Papers on Economic Activity Conference Draft.
- Martins, S.S., A. Sarvet, J. Santaella-Tenorio, T. Saha, B.F. Grant, and D.S. Hasin, 2017. “Changes in US Lifetime Heroin Use and Heroin Use Disorder: Prevalence from the 2001–2002 to 2012–2013 National Epidemiologic Survey on Alcohol and Related Conditions,” JAMA Psychiatry, 74(5):445–455. doi:10.1001/jamapsychiatry.2017.0113.
- McLaughlin, Kathleen, 2017. “Underground Labs in China Are Devising Potent New Opiates Faster than Authorities Can Respond,” Science.
- Ruhm, Christopher J., 2017. “Geographic Variation in Opioid- and Heroin-Involved Drug Poisoning Mortality Rates,” American Journal of Preventive Medicine. https://doi.org/10.1016/j.amepre.2017.06.009.
- Schwartz, Nelson, 2017. “Economy Needs Workers, but Drug Tests Take a Toll.” The New York Times.
Suggested Citation
Aliprantis, Dionissi, and Anne Chen. 2017. “The Opioid Epidemic and the Labor Market .” Federal Reserve Bank of Cleveland, Economic Commentary 2017-15. https://doi.org/10.26509/frbc-ec-201715
This work by Federal Reserve Bank of Cleveland is licensed under Creative Commons Attribution-NonCommercial 4.0 International

