

- Share
Education and Employment Opportunities for Younger Workers in the Cincinnati MSA
In this data brief, we describe changes in the Cincinnati MSA labor market the recession and recovery period of 2006-2011. We see an increase in the share of younger workers with at least a Bachelor’s degree and a higher share of workers employed in Education and Business & Financial jobs. The education level of workers in Healthcare Support is on the rise, and employment in this field grew while real wages remained stable during our study period. Other occupations accessible to lower-skilled workers, including Food Preparation & Services, experienced gains in employment but losses in full-time workers.

The views expressed in this report are those of the author(s) and are not necessarily those of the Federal Reserve Bank of Cleveland or the Board of Governors of the Federal Reserve System.
In this data brief, we describe changes in the Cincinnati MSA labor market the recession and recovery period of 2006-2011. We see an increase in the share of younger workers with at least a Bachelor’s degree and a higher share of workers employed in Education and Business & Financial jobs. The education level of workers in Healthcare Support is on the rise, and employment in this field grew while real wages remained stable during our study period. Other occupations accessible to lower-skilled workers, including Food Preparation & Services, experienced gains in employment but losses in full-time workers.
In this data brief, we examine the educational attainment levels, employment status, and occupations of workers in the Cincinnati MSA. Our analysis focuses primarily on the job prospects for those aged 18 to 35–referred to herein as “young workers” or “young”–with no post-secondary degree. We describe changes in education, employment, and wages between 2006 and 2011 and provide projected job growth in the region by skill-level requirements.
The educational attainment of those aged 18-35 increased between 2006 and 2011 in the Cincinnati MSA and Ohio. Chart 1 shows the distribution of young labor market participants (employed and unemployed) by educational attainment for the MSA and state in 2011. Thirty-seven percent of young workers in the Cincinnati MSA held a post-secondary degree (Associate’s, Bachelor’s or Post-graduate)—higher than the state’s average of 32 percent. On the lower end of the educational spectrum, however, Cincinnati looks somewhat closer to the state. Forty-two percent of young workers had at most a high school degree in 2011, compared to 44 percent at the state level.
Chart 1: Educational Attainment of labor market participants 18-35 Years of age, 2011
Source: Public Use Micro Data Sample (PUMS), 1-year estimates, 2011
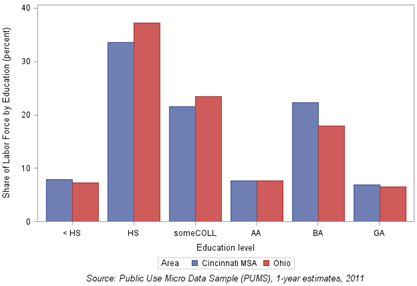
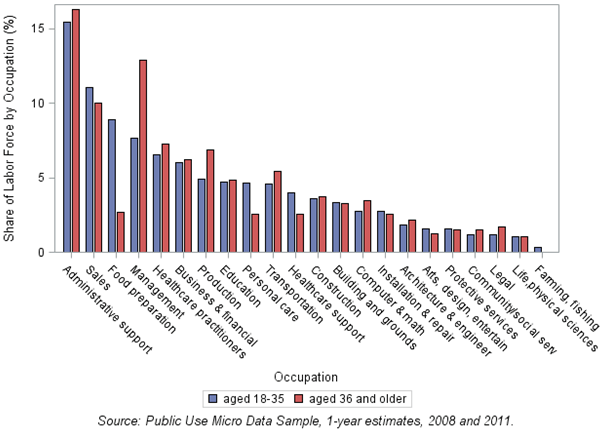
Chart 2 shows the distribution of younger and older (36+) full-year1 workers across occupations. Relative to the older group, the younger group has a smaller share of workers in Management and Production and higher shares of workers in Food Preparation, Personal Care, and Healthcare Support. The share of workers in STEM (Science, Technology, Engineering and Math) occupations—including Computer & Math, Architecture & Engineering, Life, Physical Sciences—and other occupations requiring a 4-year college degree or more (i.e., Business, Education) is even across the two age groups.
Chart 2: Distribution of full-year workers in occupations by age group in Cincinnati MSA, 2011
Source: Public Use Micro Data Sample (PUMS), 1-year estimates, 2008 and 2011
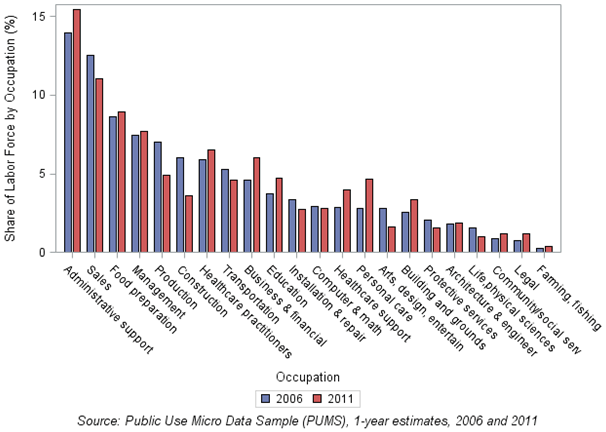
The decline in the share of young workers employed in Construction and Production occupations over this period of recession and slow recovery is aligned with national trends. The loss of jobs in these fields may have been in part offset by the gain in Personal Care & Services and Healthcare Support jobs, all of which are less likely to require post-secondary degrees. The Cincinnati MSA has also seen a recent increase in its share of young, more-educated workers holding Business & Financial and Education jobs.
Chart 3: Distribution of full-year workers, aged 18-35, in occupations by year in Cincinnati MSA, 2006 and 2011
Source: Public Use Micro Data Sample (PUMS), 1-year estimates, 2006 and 2011
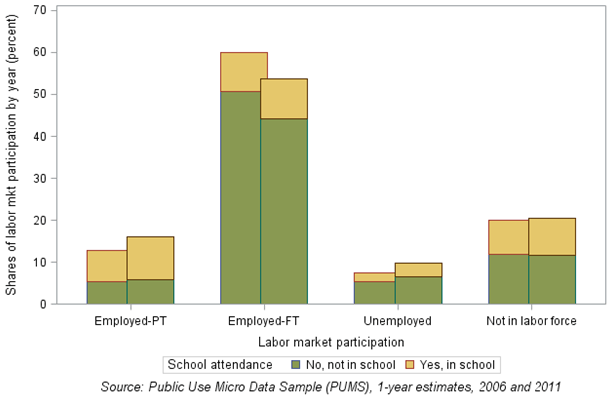
Next, we look at changes in the share of young adults in the labor market and changes in the share of young workers employed full-time from 2006 to 2011. Individuals reporting to work 30 or more hours a week are considered to hold a full time job. Between 2006 and 2001, full-time employment among young workers declined and part-time employment increased. This shift from full-time to part-time positions has occurred mainly in Food Preparation & Services and Sales. At the same time, school attendance has increased for young workers and non-workers alike. More than 60 percent of part-time and 17 percent of full-time young workers report attending school in the Cincinnati MSA.
Chart 4: Labor market participation and school attendance of population aged 18-35 in the Cincinnati MSA, 2006 and 2011
Note: 2006 left bars and 2011 bars right
Source: Public Use Micro Data Sample (PUMS), 1-year estimates, 2006 and 2011
From this point on, we focus on characterizing recent changes in occupations by changes in the educational attainment of their workers, their wages, and employment. In Chart 4, we look at workers aged 18 and above who reported working at least 40 weeks in the previous 12 months, regardless of the number of hours worked per week. These full-year workers make up 90 percent of all workers in the Cincinnati MSA who were at least 18 years old in 2011. In Chart 5 we further restrict this sample to individuals reporting at least 30 hours of work in a usual week, which allows us to consider their reported wages as full-time wages. The share of full-time, full-year workers is 78 percent in 2011.
In Chart 5, occupations are plotted by the share of workers with a post-secondary degree in 2006 and 2011. In this scatter plot, occupations above the line indicate an increase in share of workers with a post-secondary degree from 2006 to 2011. Those below the line indicate a decrease in the share of workers with a post-secondary degree in that same time period. For example, the educational attainment of workers employed in Healthcare Support increased slightly from 2006 to 2011.
While our analysis cannot pinpoint specific reasons for the shifts in the educational attainment of these workers, a number of factors might be influencing them, including: changes in young workers’ perceived value of a college degree; a relative increase in the demand for jobs requiring higher skills; or on-the job-opportunities for improving their skills. On the other hand, such shifts could also be the result of higher-skilled workers moving to lower-skilled jobs as the economy contracted. In the Cincinnati MSA, there does not seem to be noticeable increase in skills for most occupations during this period, with the exception of Healthcare Support. The change in the share of full-year workers with a post-secondary degree in Healthcare was driven by increases in shares of both Associates and Bachelor’s degrees.
Chart 5: Shifts in the share of workers with a post-secondary degree by occupation. Workers Aged 18 and older, 2006 and 2011
Source: Public Use Micro Data Sample (PUMS), 1-year estimates
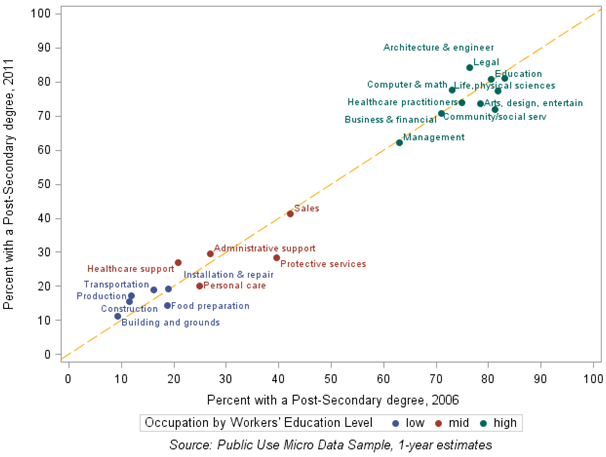
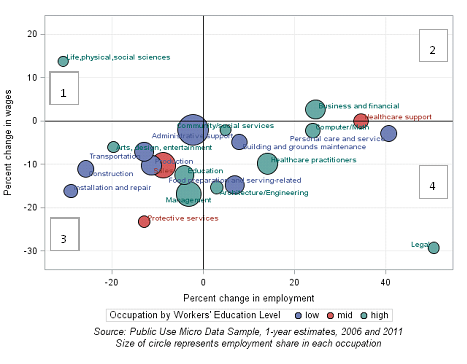
Chart 6 shows the change from 2006 to 2011 in employment and real average wages of full-time workers by occupations. Here, occupations are color coded by the educational level of their full-time, full-year workers, and the size of each bubble is proportional to employment shares across that occupation in 2011. In other words, the larger the circle, the greater the share of employees working in that occupation. Administrative support occupations employed the largest share of workers aged 18 and older in 2011. Most occupations have experienced a decline in real wages, employment, or both during these slow recovery years, as seen by the concentration of occupations in quadrants 3 and 4 of Chart 6. However, we see some exceptions to this trend. Administrative Support, for instance, remained relatively stable in terms of employment and wages from 2006 to 2011. In the Cincinnati MSA, this occupation comprises 16 percent of full-time, full-year workers aged 18 and up, with just a little over half of these workers holding a High school degree at most. Healthcare Support, another occupation accessible to low-educated workers, has shown increases in employment and stable wages between 2006 and 2011. However, by 2011, just three percent of the full-time, full-year workers in the Cincinnati MSA held jobs in this field.
Chart 6: Employment and real wage growth between 2006 and 2011 in Cincinnati MSA, full-time, full-year workers aged 18 and older
Source: Public Use Micro Data Sample (PUMS), 1-year estimates, 2006 and 2011
Size of circle represents employment share in each occupation
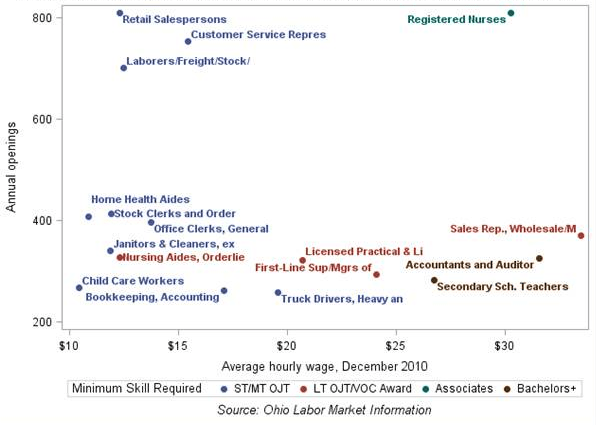
According to data from Ohio’s Labor Market Information system, the field of registered nurses, which requires at least an Associate’s degree, tops the list in terms of annual openings between 2008 and 2018 in the Cincinnati MSA (see Chart 7) and Ohio. While not as large, annual openings for licensed practical nurses and sales representatives–two mid-skilled occupations—are projected at nearly 300 and 375 annual openings, respectively. These occupations offer a relatively decent wage, and require some post-high school education but less than an Associate’s degree. Other occupations with a large number of projected openings that could be filled by non-college-bound individuals include retail sales, customer services representatives, and laborers; however, each of these occupations pays low wages.
Chart 7: Projected annual openings between 2008 and 2018 by average wage in the Cincinnati MSA
Source: Ohio Labor Market Information
Summary
In this data brief, we describe changes in the Cincinnati MSA labor market during the recovery period from the Great Recession. As in the Cleveland and Pittsburgh MSAs, we see encouraging increases in the share of younger workers with at least a Bachelor’s degree in the Cincinnati MSA. Between 2006 and 2011, the share of young workers in higher-paid, higher-skill Education and Business & Financial jobs increased. And occupations within these fields are projected to have relatively high employment growth in the future, particularly for accountants and school teachers. On the other hand, for workers without a college degree—a particular focus of this brief—we see stable or growing employment in the lowest-wage occupations. This is the case for Healthcare Support & Personal Care occupations, both of which tend to pay lower-wages compared to other low-skill occupations. However, the education level of workers in Healthcare Support is on the rise, and employment in this field grew while real wages remained stable from 2006 to 2011. Other occupations accessible to lower-skilled workers, including Food Preparation & Services, experienced gains in employment but losses in full-time workers.
Data Notes
The PUMS wage data used in this analysis is based on workers’ self-reported wages in the previous 12 months (52 weeks). Since the data provide a range of weeks worked (i.e. 1-13 weeks) rather than the exact number of weeks worked in the previous year, we are not able to estimate the yearly wage of individuals working less than a year in proportion to the time worked. Thus, we compute average wages only among individuals reporting at least 40 weeks of work and use the wage reported as their yearly wage.
Data Source
The 1% Public Use Micro Data Sample (PUMS) data includes individual-level data on the demographics, education, wages and employment of the population. Data were extracted from IPUMS at https://usa.ipums.org (IPUMS citation: Steven Ruggles, J. Trent Alexander, Katie Genadek, Ronald Goeken, Matthew B. Schroeder, and Matthew Sobek. INTEGRATED PUBLIC USE MICRODATA SERIES: VERSION 5.0 [Machine-readable database]. Minneapolis: University of Minnesota, 2010.) The data on annual openings, minimum skill level and averages wages by occupation was extracted from the Ohio Labor Market Information, found at http://ohiolmi.com/.
Footnotes
- Full-year workers are those that reported working at least 40 weeks in the past 12 months. According to the PUMS data set, 85% of young workers were full-year workers in the Cincinnati MSA, 2011.
- The color-coding of occupations into three groups provides more detail on the educational attainment of their full-year workers in 2011. Occupations with at least half of their workers holding a Bachelor’s or post-graduate degree are classified as high-skilled (green). Occupations for which at least half of their workers do not hold more than a HS degree are classified as low-skilled (blue). The remaining occupations are considered to be mid-skilled as they have less of a concentration of workers at either end of the educational attainment spectrum.