

- Share
Hidden Counties: Rural Appalachia in the Fourth District States
Although not directly affected by the boom and bust of the housing market, Appalachia, and more specifically rural Appalachia, might be fighting the current recession's aftershocks for quite some time. A 2007 report by Dr. James Ziliak, during his time as a Federal Reserve Bank of Cleveland visiting scholar, examined education, poverty, and household income trends from 1979 - 2003 in Appalachia. Although the Appalachian counties did see improvements in this time period in terms of poverty, income, and education, as of 2003 many areas still lagged behind the national averages. Ziliak posited that while increased rates of high school completion were alleviating high poverty rates, lower college completion was contributing toward the region's lower income compared to the U.S., suggesting that human capital development is vital in the fight against poverty.

The views expressed in this report are those of the author(s) and are not necessarily those of the Federal Reserve Bank of Cleveland or the Board of Governors of the Federal Reserve System.
Introduction
Although not directly affected by the boom and bust of the housing market, Appalachia, and more specifically rural Appalachia, might be fighting the current recession's aftershocks for quite some time. A 2007 report1 by Dr. James Ziliak,during his time as a Federal Reserve Bank of Cleveland visiting scholar, examined education, poverty, and household income trends from 1979 - 2003 in Appalachia. Although the Appalachian counties did see improvements in this time period in terms of poverty, income, and education, as of 2003 many areas still lagged behind the national averages. Ziliak posited that while increased rates of high school completion were alleviating high poverty rates, lower college completion was contributing toward the region's lower income compared to the U.S., suggesting that human capital development is vital in the fight against poverty.
Given the severity of the current recession, along with the region's relative insulation from the housing boom and bust, it is worth examining the data to learn how Appalachians in these counties are currently faring. Have they lost what little ground they gained from the late 1970s to the early part of this decade?
Sprawled across 205,000 square miles, the Appalachian region covers all of West Virginia and parts of 12 other states: Alabama, Georgia, Kentucky, Maryland, Mississippi, New York, North Carolina, Ohio, Pennsylvania, South Carolina, Tennessee, and Virginia (figure 1). More than 23 million residents make their home along the namesake mountain range. A network of dense undergrowth, thick forests, and a tangle of mountains and valleys gives the region its hardscrabble reputation. Employment has traditionally relied on mining and manufacturing, but tourism is steadily gaining in popularity due to the picturesque landscapes and pristine forests. Historically, Appalachia has battled poverty, unemployment, stagnant industry, and lower educational attainment and wages. Progress has been made to narrow those gaps, but significant divisions remain between Appalachia and the rest of the nation.
The Appalachian Region
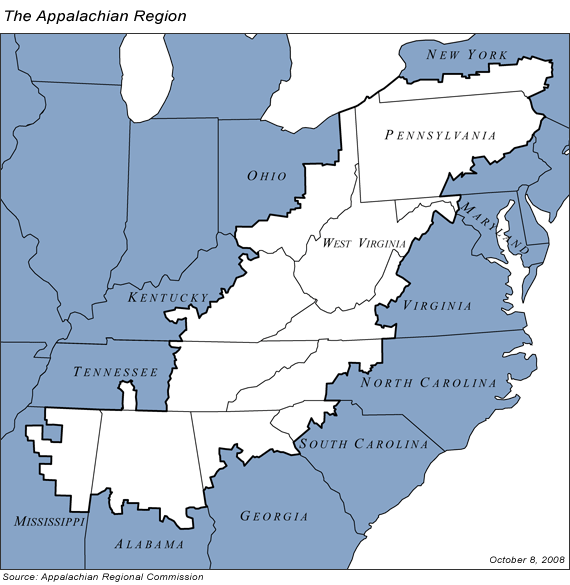
Source: Appalachian Regional Commission.
There are 330 counties in the Fourth District states and, of those, 193 are in Appalachia. Figure 2 gives a comparison of county type and population. Non-Appalachia is more populated, accounting for about 40 percent of the 330 counties, but more than 60 percent of the population. Rural Appalachia, on the other hand, accounts for 31 percent of the counties, but only 7 percent of the total Fourth District states' population.
Appalachian Counties by County Type and Population (2008) in Fourth District States
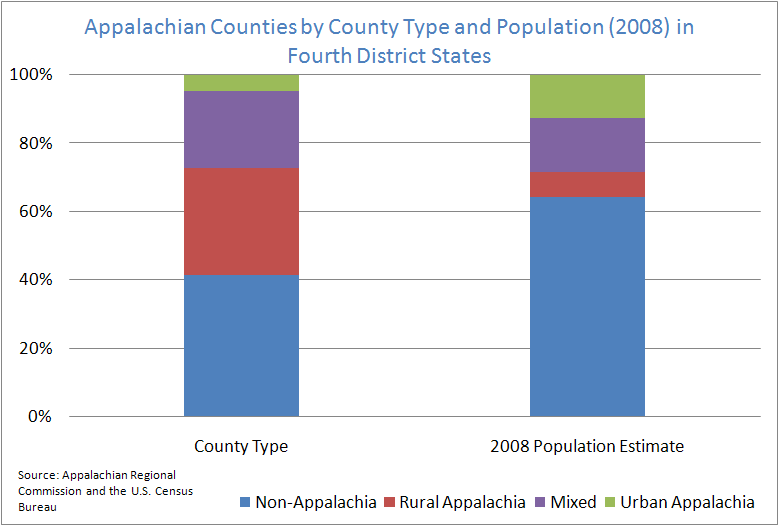
Source: Appalachian Regional Commission and the U.S. Census Bureau.
This report focuses on rural Appalachian counties in the Fourth Federal Reserve District states - Kentucky, Ohio, Pennsylvania, and West Virginia - during the current decade. It begins with a discussion of rural poverty in these Fourth District states and follow with a closer look at employment trends, which influence a region's poverty rate: unemployment, private employment mix, and employment-to-population ratio.
Poverty
A common image of poverty may involve scenes of inner-city combat zones and graffiti-encrusted alleyways. An alternative vision is one of isolation and ramshackle trailers sitting on trash-strewn plots of land in towns starved for jobs. Like its urban counterpart, rural poverty, particularly in Appalachia, is both prevalent and persistent, ingrained for decades in many areas. Compared to its urban counterpart, the rural poor are more often white with a higher proportion of married or two-parent households and higher labor force participation. Shared traits of poverty between urban and rural areas include low educational attainment, poor health, and particularly rates among minorities, female-headed households, children, and the elderly.3 Cities and towns in rural areas tend to have weak institutional and financial bases for public program delivery and also lack a strong (or any) middle class. All of these characteristics are exacerbated by chronic disinvestment and underdevelopment, which together create a recipe for persistent poverty.
Economic Status of Rual Appalachian Counties as Defined by the Appalachian Regional Commission
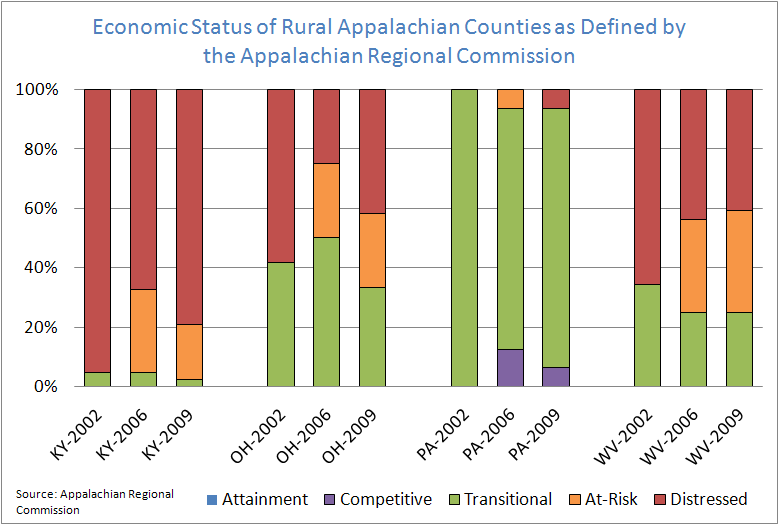
Source: Appalachian Regional Commission.
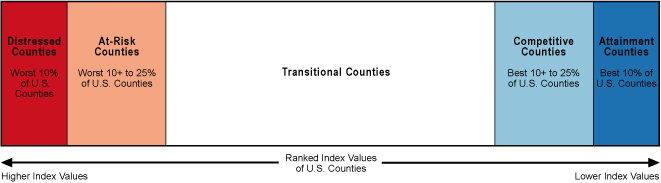
The Appalachian Regional Commission (ARC), a federal - state partnership dedicated to promoting economic development and addressing quality of life issues for Appalachian residents, releases annual listings of each Appalachian county's economic health from best to worst. Every county is designated as either an attainment, competitive, transitional, at-risk, or distressed county (figure 3).4 The performance of the rural Appalachian counties in the Fourth District states can be seen in figure 4. The ARC bases its classifications on several economic indicators, including poverty rates, per capita market income, and a three-year average of unemployment rates. The at-risk category was added after 2006, which explains its omission from the 2002 numbers.5 One caveat when looking at figure 4 is that by creating the at-risk category, some of the better performing distressed counties were shifted to the at-risk designation. Among Fourth District states, Pennsylvania is faring the best, with the majority of its counties in the transitional category, while Kentucky contains a majority of distressed counties. What this means is that rural Appalachian counties in Pennsylvania are performing relatively better when compared to the other three states, while the large proportion of distressed rural counties in Appalachian Kentucky illustrates a concerning trend of poverty and economic stagnation among its rural residents.
Ranked Index of Values of U.S. Counties
Source:
Poverty's spatial pattern can be seen in figure 5, which shows county rate estimates in 2007. Rural Appalachian counties in Kentucky contain the highest poverty rates, followed by West Virginia, Ohio, and Pennsylvania. Seeing these patterns on the map, it's evident that eastern Kentucky has the greatest concentration of high-poverty counties in the region. Why is that? Here are a few culprits: geography, no urban center, and lack of a diverse economy. The high-poverty counties of eastern Kentucky are bordered by national forests on both the east and west sides, creating a natural barrier to the area that makes travel to and from the region more difficult. This area also lacks an urban center, which can provide the core population density needed to attract and retain a skilled, professional workforce. A healthy core can lead to a healthy periphery and an example of this could be Pittsburgh (in Pennsylvania). Finally, the economy is overly reliant on one industry - mining. This lack of diversity constricts employment choices and will be discussed in greater depth later in the report.
2007 Poverty Rate by County in Fourth District States
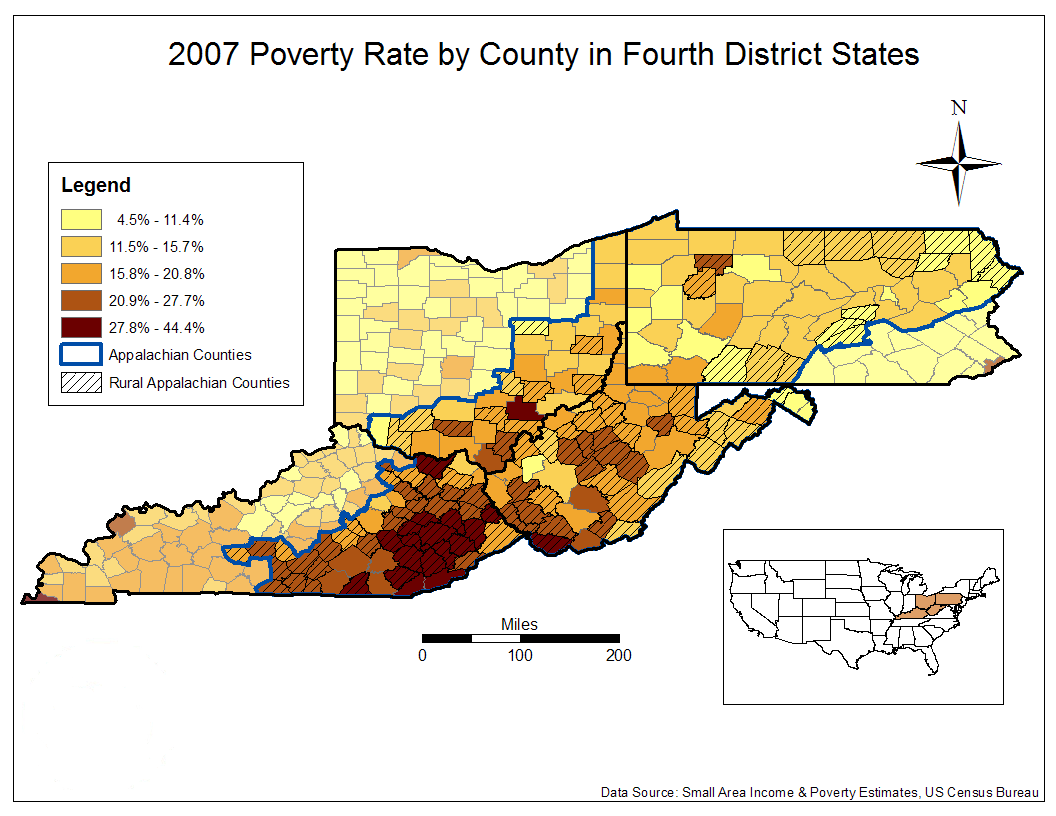
Source: Small Area Income & Poverty Esitmates, U.S. Census Bureau.
Unemployment
Unemployment rates in rural Appalachian counties follow trends similar to the U.S., but at elevated rates. Figure 6 takes a closer look at each state's rural Appalachian counties; after 2002, Ohio and Kentucky alternate between the highest unemployment rates in the Fourth District states, while Pennsylvania has consistently lower rates. Of interest is the performance of West Virginia's rural Appalachian counties; after 2003 their rate fell to only slightly higher than Pennsylvania's, and in 2008, their rate was the lowest of the four states. But as the economy soured, West Virginia experienced the sharpest increase in its unemployment rate from 2008 to April 2009 of any of the four states (+82 percent).
Rural Appalachia Unemployment Rates by States
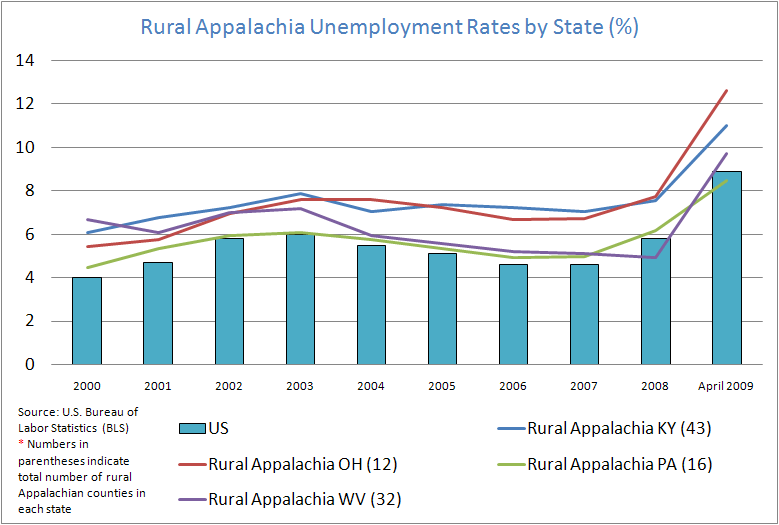
Source: U.S. Bureau of Labor Statistics (BLS).
Two questions arise from figure 6: Why does rural Appalachia suffer from consistently higher unemployment rates? And what's going on in West Virginia? Part of the answer to the first question, and to some extent the second, involves geography, but for differing reasons. Rural Appalachian counties in general are isolated from the population centers. This isolation hurts both prospective employees as well as employers. The hilly terrain acts as a mobility barrier, limiting the distance a person would be willing to travel in search of new employment. That, combined with a lack of disposable income, may leave the person with few options.8
Regarding employers, most thrive in heavy traffic or high-visibility areas, which is lacking in the rural Appalachian counties. Conversely, geography can also be a boon for a region, particularly when it contains large amounts of valuable natural resources. West Virginia is an example of that case with its abundance of mining employment. This creates much-needed jobs in the state's rural counties. Unfortunately, that employment is also highly dependent on the health of the nation's economy as a whole and can be very susceptible to economic shocks.
Figures 7 and 8 compare how well a county is performing relative to the entire four-state region. In 2000, the four-state mean unemployment rate was 4.21 percent. Many counties in Appalachia suffered from rates greater than that mean. By 2008, the four-state mean had increased to 5.98 percent, and counties with higher unemployment rates had spread into non-Appalachia. Note the dramatic change in West Virginia's unemployment rates relative to the four-state mean.
2000 Difference in Unemployment Rates from the Four-State Mean
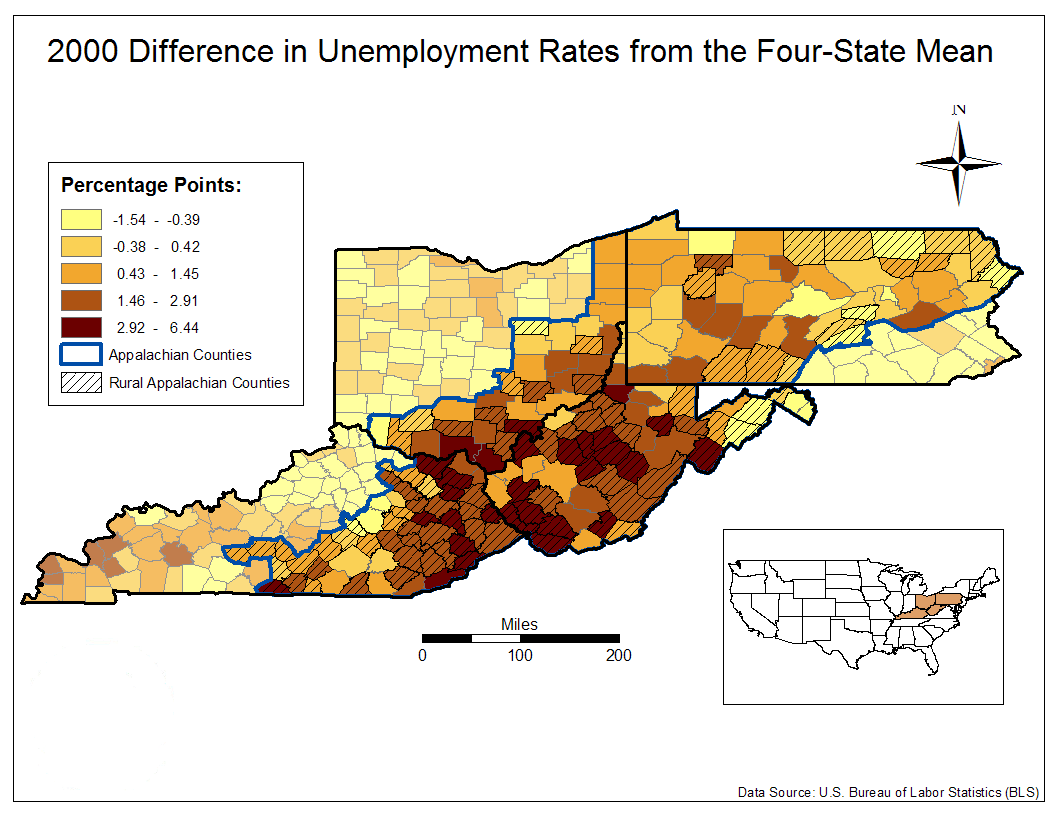
Source: U.S. Bureau of Labor Statistics (BLS).
2008 Difference in Unemployment Rates from the Four-State Mean
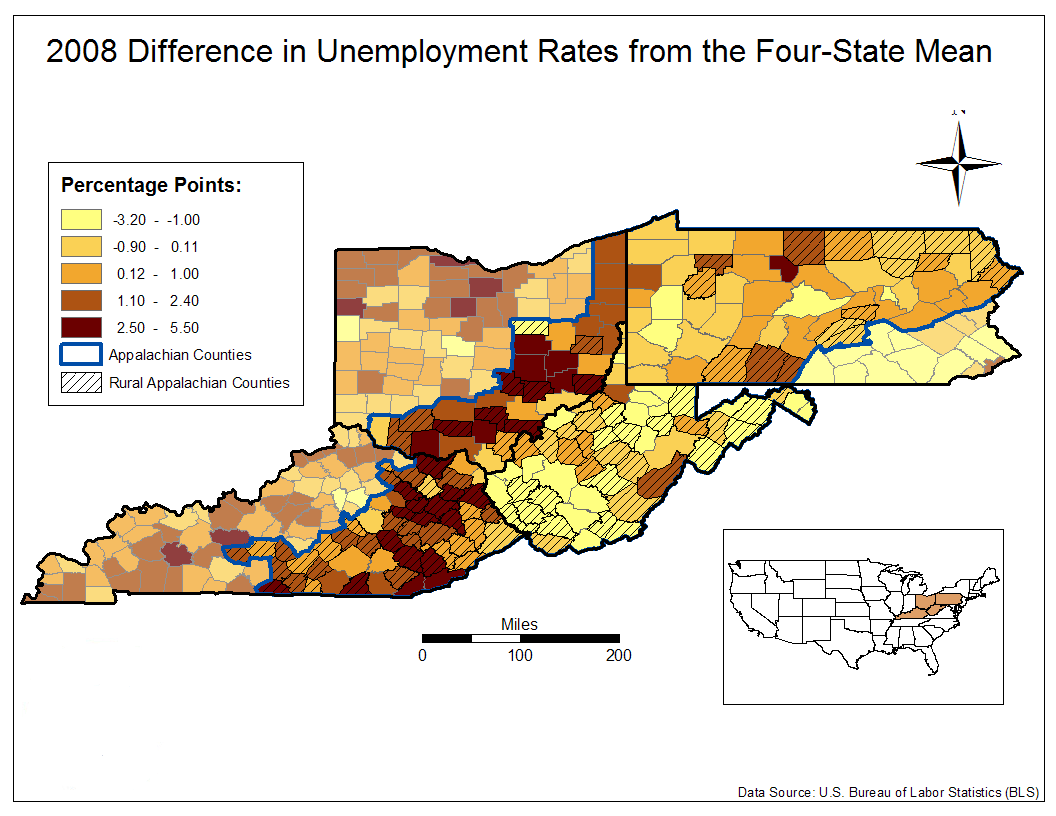
Source: U.S. Bureau of Labor Statistics (BLS).
Private Employment Mix
The rural Appalachian counties have a less diverse economy when compared to the U.S. as a whole. Rural Appalachia's top five private employment sectors make up 76 - 80 percent of total employment, but those same sectors account for only 65 percent of private employment in the U.S. (figure 9). Rural Appalachia also tends to have higher percentages of manufacturing (24 percent in Ohio) and mining employment (15 percent in West Virginia).
Top Private Employment Sectors in Rural Appalchian Counties (2008)
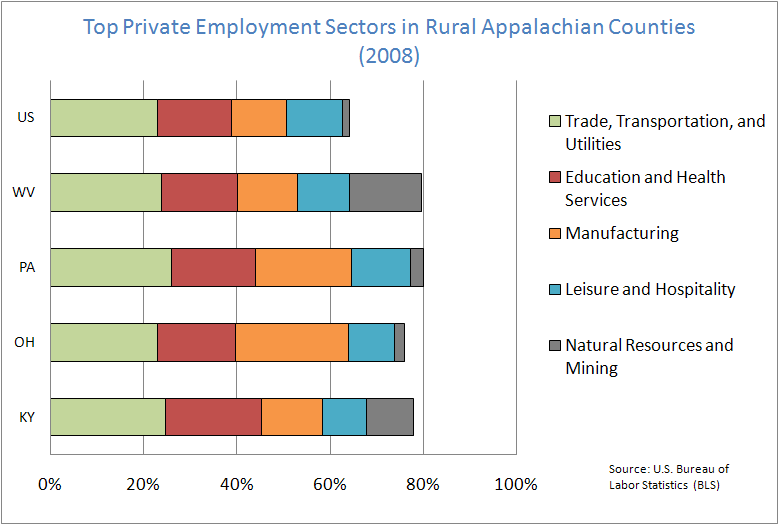
Source: U.S. Bureau of Labor Statistics (BLS).
Figure 10 details the percentage change for the top private employment sectors and total population in each state's rural Appalachian counties from 2000 - 08. All areas experienced sharp losses in manufacturing employment, particularly Ohio's decline of more than 30 percent (-8,524 jobs). Of interest is the growth in health and education services in all four states. Three of the four states also experienced strong growth in mining, while Ohio saw a loss of over 40 percent in that sector (-1,284 jobs). The change in both total private employment and population was relatively small and mixed among the states.
Percentage Change in Top Employment Sectors and Total Population (2000-2008)
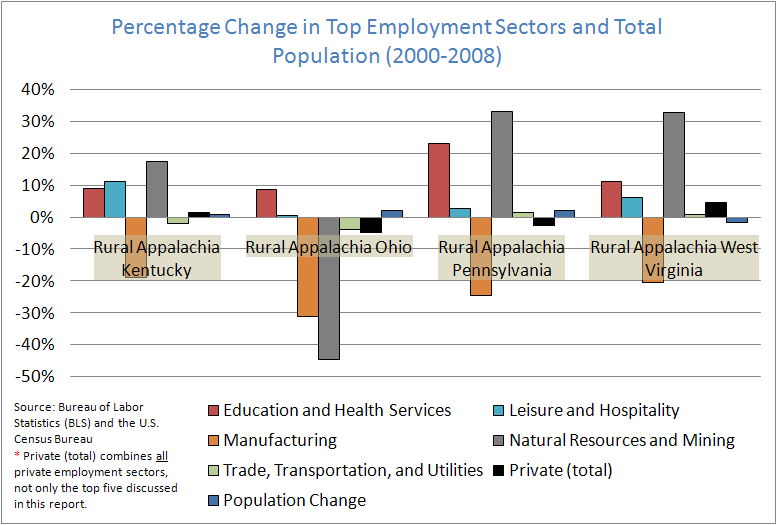
Source: U.S. Bureau of Labor Statistics (BLS); U.S. Census Bureau.
So how does this lack of job diversity influence rural Appalachia's poverty and unemployment rates? It shows that a large portion of each state's rural Appalachian economy rests upon potentially unstable employment sectors: manufacturing and mining. Mining does well during periods of economic growth, but during economic slowdowns, fewer natural resources are used as factories halt production and consumers conserve energy. Also of concern is the outcome of the climate change bill currently being considered in Congress, which could dramatically alter how the U.S. obtains its energy. Manufacturing is an industry that has been in decline for many years now. One problem facing this sector lies in the industry's need to compete on a global scale, an effort vastly more complicated by the isolated nature of rural Appalachia.
Employment-to-Population Ratio
Employment-to-population ratios have seen very little change from 2000 - 08, though broad variations exist among the states (figure 11). Ohio's and Pennsylvania's ratios are substantially higher than Kentucky's and West Virginia's, and this persistent gap highlights a disturbing lack of improvement. This is further illustrated in figure 12, which maps the 2008 difference in employment-to-population ratio from the four-state mean (59.7 percent).
Rural Appalachian Employment-to-Population Ratio
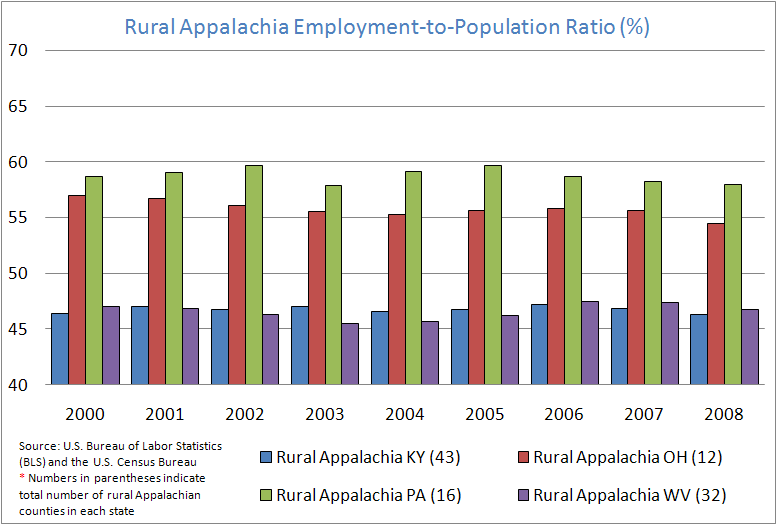
Source: U.S. Bureau of Labor Statistics (BLS); U.S. Census Bureau.
So why are there disparities among the states? One, many people have simply stopped looking for work or have switched to the informal sector, both legal and illegal.9 Two, given the prevalence of mining employment and its dangerous nature, a larger percentage of the population is receiving disability payments. For example, West Virginia has the highest rate in the country, with 22.5 percent of the population between the ages of 21 and 64 disabled in 2007.10 And three, combined with a relatively stagnant overall population, an aging population is leading to a smaller working population.
2008 Difference in Employment-to-Population Ratio from the Four-State Mean
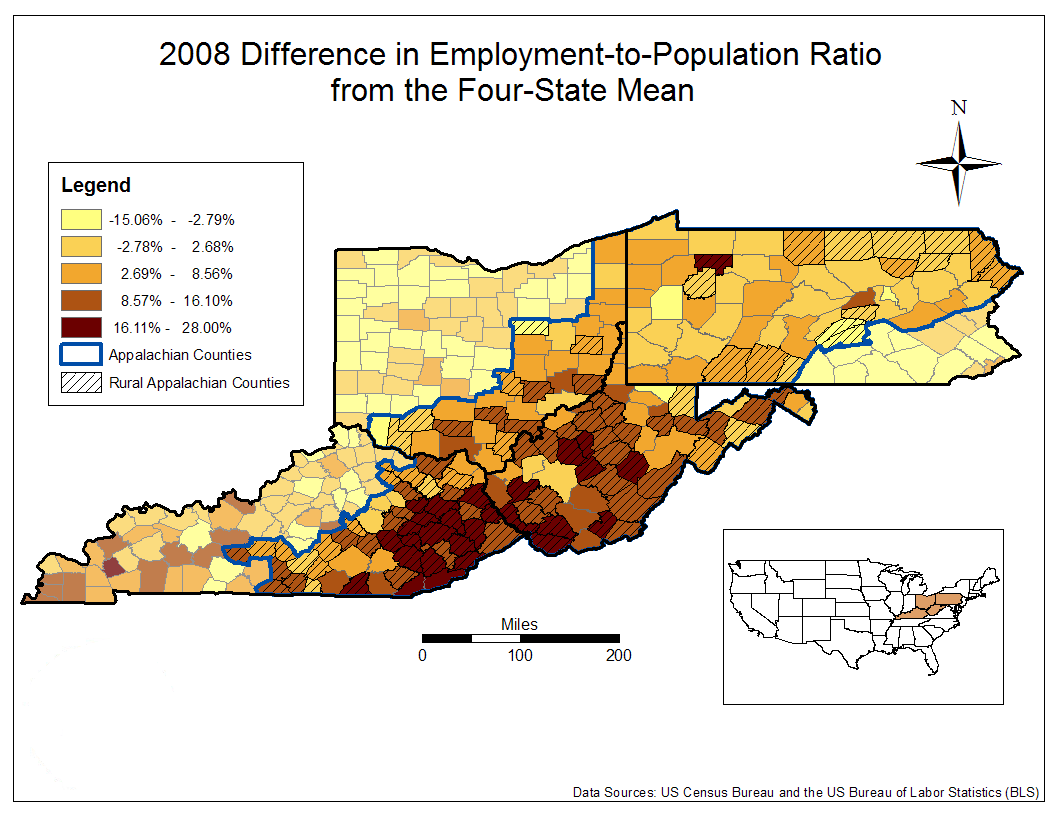
Source: U.S. Bureau of Labor Statistics (BLS); U.S. Census Bureau.
Conclusions
Have these four states' rural Appalachian counties improved, relapsed, or remained static during the current decade? Overall, it's a mixed bag. Of the four, Pennsylvania has consistently boasted lower unemployment rates, higher employment-to-population ratios, and lower poverty rates. Part of this can probably be attributed to the stability generated from the Pittsburgh MSA and the state's ability to diversify its economy (for example, the strong growth in health and education service employment).
Of greater concern are Kentucky's and West Virginia's low employment-to-population ratios and rooted pockets of high poverty. These can point towards a troubled labor market and the problems associated with their past reliance on a singular industry. Ohio has experienced consistently high unemployment, but also the second-highest employment-to-population ratio of the four states. In addition, its total private employment has fallen by the largest amount of the four states (-6,212 jobs), which is troubling considering that it has the fewest counties designated rural Appalachian. The key will be to create the necessary jobs for the unemployed before they drop out of the labor force.
What's in store for rural Appalachia post-recession? Certainly the region's ability to diversify employment opportunities, educate and retain its population, and promote itself as an appealing place to live and work will be critical to its success going forward.
Footnotes
- http://www.clevelandfed.org/Research/Commentary/2007/020107.cfm
- Complete definition of rural and urban areas: http://www.census.gov/geo/www/ua/ua_2k.html
- Tickamyer, Ann R. (2006). "Rural Poverty." Handbook of Rural Studies, pp 407-422.
- Current methodology http://www.arc.gov/images/maps/cty_econ09.html
- Source and methodology prior to 2006 http://www.arc.gov/images/programs/distress/status04.htm
- Blank, Rebecca M. (2007). "How to Improve Poverty Measurement in the United States." University of Michigan and Brookings Institution.
- Fremstad, Shawn (2008). "Measuring Poverty and Economic Inclusion," Center for Economic and Policy Research.
- Mather, Mark (2004). "Housing and Commuting Patterns in Appalachia Population." Reference Bureau and the Appalachian Regional Commission.
- Boettner, Ted, Cormier, Dave, Wilson, Rick (2008). "The State of Working West Virginia." West Virginia Center on Budget & Policy.
- Boettner et al. (2008). "The State of Working West Virginia." West Virginia Center on Budget & Policy.