

- Share
How Sure Can We Be about a COVID-19 Test Result if the Tests Are Not Perfectly Accurate?

The views authors express in Economic Commentary are theirs and not necessarily those of the Federal Reserve Bank of Cleveland or the Board of Governors of the Federal Reserve System. The series editor is Tasia Hane. This paper and its data are subject to revision; please visit clevelandfed.org for updates.
Since the beginning of the COVID-19 pandemic, government officials have promoted the importance of testing as a key tool in the effort to curb the spread of the disease. One complication associated with testing, however, is that the tests available are fallible: Less expensive tests have been shown to yield a significant number of false positives and negatives, and more expensive tests, while more reliable, are still not 100 percent accurate.
Still, both types of test can be useful. More reliable tests are easier to interpret, but less reliable tests offer important advantages as well with their low cost and quick results. For example, they can be used to test more people and increase the odds of identifying an infection in asymptomatic or presymptomatic individuals, which can help to slow the spread of the disease.
It is important to understand how a test’s reliability affects the interpretation of its results. Physicians need to know how to translate a positive or negative test result into the likelihood a patient is actually infected. Policymakers need to know how to interpret results to ascertain the true prevalence of the disease at any point in time.
In this Economic Commentary, we explain how test reliability is measured, how to interpret a test’s results given its degree of reliability, and how the interpretation is affected by the prevalence of the virus in the population being tested. Specifically, we show that when the prevalence of a virus is low in the tested population, even a highly reliable test can produce a large percentage of inaccurate results. We argue that administering inexpensive and less precise tests multiple times may be a more efficient way of curbing the pandemic than administering more precise and expensive tests once. Finally, we briefly discuss some recent attempts to determine the actual prevalence of COVID-19 in the general population.
Test Results and the Probability of Infection
Medical researchers evaluate the accuracy of tests along two dimensions (Manski and Molinari, 2021). One is the probability that an infected person will receive a positive result, referred to as test sensitivity. In other words, given that someone is infected, how likely is it that the test will correctly spot infection? If a test’s sensitivity is 100 percent, then 100 percent of the infected people taking the test get a positive result. The other dimension is the probability that a noninfected person will receive a negative result, referred to as test specificity. In other words, given that someone is not infected, how likely is it that the test will correctly return a negative result? If a test’s specificity is 100 percent, then 100 percent of all noninfected people taking the test get a negative result.
Sensitivity and specificity are important measures to medical researchers, but patients and their physicians are more likely to care about what a positive or negative result means in terms of a patient’s probability of being infected. While this probability is related to a test’s sensitivity and specificity, false negative and positive results can affect the probability in nonintuitive ways. For example, even if a test’s sensitivity is 100 percent, patients testing positive may not be certain they are infected if some noninfected patients can receive a positive test result. Similarly, a negative result does not necessarily mean no infection in the case of 100 percent specificity if a few infected agents wrongly get a negative result. Unless both sensitivity and specificity are 100 percent, patients and physicians cannot assume a given test result is accurate; they must consider its probability of being accurate. The probability of being infected based on a given test result also depends on another factor—the prevalence of the virus—which differs not only for a given virus or disease, but also across specific populations.
Consider the following example that illustrates how these measures are related. Note that all of the numbers are hypothetical to make the principles easier to follow. Numbers are presented in table 1.
| Infected | Noninfected | Total | |
| Positive test result | 13 | 7 | 20 |
| Negative test result | 2 | 78 | 80 |
| Actual status of infection | 15 | 85 | 100 |
Source: Authors’ calculations—illustrative example.
Imagine we have a pool of 100 individuals who are tested for a certain disease. Of those 100, 15 are infected. Thus, the disease’s “prevalence” in our testing pool is 15 percent. When these infected individuals are tested, 13 receive a correct positive result, while 2 receive an incorrect negative result. Consequently, the test’s sensitivity is 13/15=0.867 or 86.7 percent. Similarly, of the 85 noninfected individuals tested, 78 receive a correct negative result, while 7 receive an incorrect positive result. Consequently, the specificity of the test is 78/85=0.918 or 91.8 percent. Overall, this seems an accurate test.
Next, we want to know how the test’s sensitivity and specificity rates affect the chance of a patient’s being infected given a positive or negative result. As we can see in table 1, out of 20 patients with positive results, only 13 are infected; that is, the chance that a patient receiving a positive result is actually infected is 13/20=0.65 or 65 percent. While this chance is significantly higher than the disease’s 15 percent prevalence rate in the testing pool of 100, infection is far from certain even with a positive test result. On the other hand, the chance that a patient receiving a negative result is truly not infected is 78/80=0.975 or 97.5 percent. So a negative result makes us quite certain that a patient is not infected.
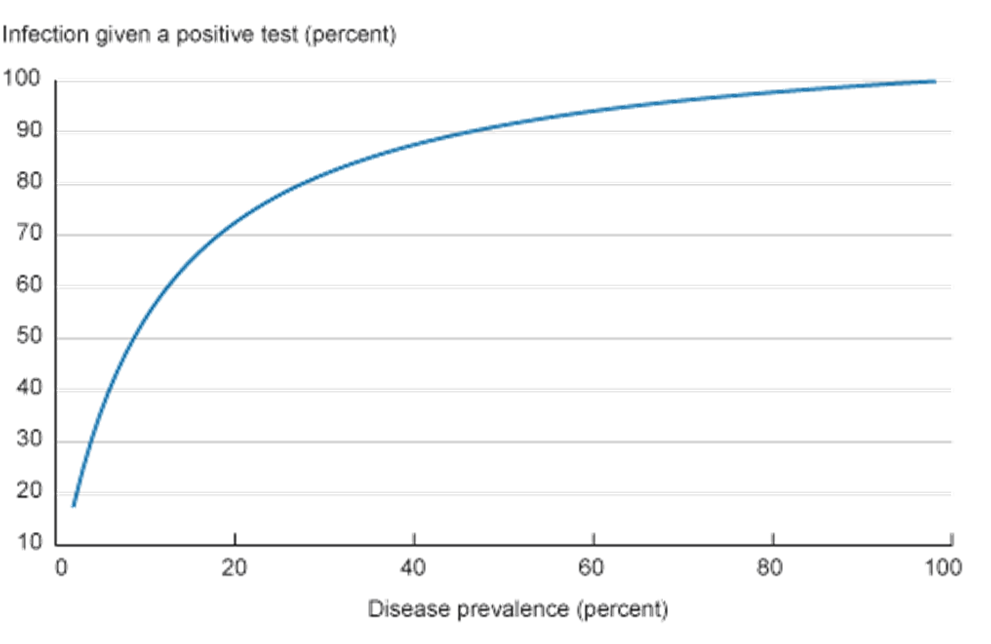
This example illustrates the way in which the prevalence rate of a disease can affect the interpretation of a test’s results. Even though our hypothetical test has high specificity and sensitivity rates, if it is used on a population in which the prevalence of the disease is low, the test’s small error rate can mean that a significant share of the positive results comes from errors.
To illustrate this effect further, we vary the prevalence rate of the disease in the example’s population while keeping the sensitivity and specificity of the test the same as in table 1. Figure 1 shows the effects of these changes in the prevalence rate on the percentage of correct positives.
This is one of the reasons why public health advisors are sometimes reluctant to recommend widespread screening for some relatively rare diseases (some types of cancer, for example) while recommending screening be done only in some subpopulations with a higher prevalence of the disease. Similarly, health officials tend to focus widespread COVID-19 testing in target areas that have been heavily affected by the virus.1 The goal is to focus on a subpopulation in which the disease’s prevalence is higher, in which case a positive result would be a good indicator of actual illness.
One final point we will explain is the effect of repeated testing. Repeated tests may significantly improve a test’s overall sensitivity and specificity rates. Let’s return to the example presented in table 1 and imagine that we repeat the same test with only those individuals from the original population who received a positive result. Because it’s the same test, its sensitivity and specificity rates are the same. For the sake of our example, assume the results of the second test are those in table 2.2
| Infected | Noninfected | Total | |
| Positive result, first test | 13 | 7 | 20 |
| Positive result, second test | 11 | 1 | 12 |
| Negative result, second test | 2 | 6 | 8 |
Source: Authors’ calculations—illustrative example.
The probability of being infected after two positive test results is 11/12=0.92 or 92 percent. Consequently, we became significantly more certain about the infection status of 11/15=0.73 or 73 percent of the infected patients in our initial testing pool by conducting a follow-up test after an initial positive result.
Some Implications for COVID-19 Testing
In terms of COVID-19 tests, RT-PCR tests are considered the “gold standard,” with high sensitivity and specificity rates.3 However, these tests can be quite expensive, $75 to $150 per kit, and slow to process (four to six hours processing time and a results turnaround of two to four days). Conversely, antigen tests, while having lower sensitivity rates, are significantly cheaper ($1 to $23) and produce results in a few minutes.4
A significant issue related to COVID-19 is that symptoms can develop after the disease has become contagious. To limit the spread of infection from asymptomatic individuals, some public health experts recommend conducting repeated cheap and fast antigen tests (see Paltiel and Walensky, 2020; Guglielmi, 2021; and Ramdas et al., 2020, for example) even though such tests have lower sensitivity and specificity rates than RT-PCR tests.5
In order to illustrate how a repeated antigen testing compares to a single RT-PCR test, in table 3 we present the results for one, two, and three tests of each type. We assume the antigen test has a sensitivity rate of 85 percent and a specificity rate of 98, while those for the RT-PCR test are 98 percent and 99 percent, respectively (based on evidence from Johns Hopkins University Center for Health Security data). Following Yang et al. (2020), we assume the prevalence rate of COVID-19 is 5.96 percent, which is their estimate for the disease’s active prevalence in the United States on January 4, 2021.6 As we can see in table 3, two antigen tests are significantly more accurate than one RT-PCR test and close to the performance of two RT-PCR tests. Notice that it costs less to repeat antigen tests three times per suspected case than it does to conduct one RT-PCR test. Additionally, using the antigen tests, it would be possible to obtain faster results, which could potentially avoid further disease spread.
| Number of positive tests out of total number of tests | ||||||
| Test | 1+ out of 1 | 1+ out of 2 | 2+ out of 2 | 1+ out of 3 | 2+ out of 3 | 3+ out of 3 |
| RT-PCR | 86.13 | 11.15 | 99.84 | 0.25 | 92.48 | 100 |
| Antigen | 72.93 | 29.19 | 99.13 | 5.94 | 94.60 | 99.98 |
Sources: Authors’ calculations based on Johns Hopkins University Center for Health Security data and Yang et al. (2020).
Note: The initially published table wrongly used a sensitivity rate of 95 percent instead of 98 percent for the RT-PCR test. The updated table fixes this issue. Nevertheless, our conclusions are unchanged. We thank Mr. Keng Siak Lam for pointing out the mistake.
That said, it is important to emphasize that these results rely heavily on the assumption of test independence. When we say tests A and B are independent, it means that knowing that test A’s result was either positive or negative does not help us to predict test B’s outcome. In practical terms, test independence rules out issues that may induce tests to give a particular outcome regardless of the infection rate. For example, antigen tests are not very sensitive to low viral loads. Consequently, if a patient is tested twice early on in her infection, both tests are more likely to give a negative result, violating the independence assumption.7 Consequently, as discussed in the literature, the assumption that these repeated test results are independent is a strong one and far from certain (see Rubin, 2020).
Finally, we note that COVID-19’s active prevalence rate is unknown in most cases. One reason for this is that tests were not widely available until recently. As a result, the tested pool was not a random one earlier in the pandemic, but comprised of individuals who were more likely to have been infected (those who exhibited flu symptoms or were exposed to infected individuals and so on). Hence, even if tests were perfectly accurate, the biased sample would prevent us from monitoring the evolving prevalence rate in the population.
One of the few large-scale tests of a random sample in the United States was done by the Utah Health and Economic Recovery Outreach (HERO) project (see details in Samore et al., 2020). The study combined both RT-PCR and antibody tests8 to improve accuracy and to detect current and past infection. The results pointed to a prevalence rate of 0.8 percent in the period May 4 to June 30, 2020, with only 42 percent of the infections identified in the case counts. Based on the results from the HERO Project tests and the positivity rates for other states, Yang et al. (2020) show that active prevalence is likely to be two to three times higher than what case counts would suggest. However, even in their analysis, the effect of test fallibility has not been factored in.
Conclusion
Since the beginning of the pandemic, testing and quarantining have been promoted as two of the key tools to curb disease spread. Not only can testing screen for and potentially curb the spread of infection among individuals, it also can act as a useful tool by which we might determine in which stage of the pandemic we are and what to expect going forward. Thus, in order to design efficient testing policies, it is important to understand testing limitations and what we can really learn from them.
We showed that even tests considered precise can produce a high percentage of false positives if the prevalence of a disease in the population is low. This statistical fact has some implications for the design of testing policies. First, it highlights the difficulties of widespread testing to monitor the evolution of the pandemic and as a tool to control it when conducted only once. Second, it shows that repeated testing can be even more important when the prevalence of a disease is low. Given limited public budgets, cheap and less precise tests that can be conducted multiple times can be more efficient in curbing the pandemic than expensive more precise tests conducted less often.
Footnotes
- You can find the CDC guidelines for COVID-19 testing and an overview of the different tests here. Return to 1
- Apart from small rounding effects. Return to 2
- Reverse Transcription Polymerase Chain Reaction (RT-PCR) tests (also called molecular tests) are tests that detect viral genetic material. A fluid sample is collected usually with a nasal swab. While there is uncertainty about the actual rates, most analyses put the sensitivity and specificity rates around 98 percent and 100 percent, respectively. For more information, please see the rates for different tests provided by Johns Hopkins University’s Center for Health Security. Return to 3
- Antigen tests detect the presence of certain viral proteins, after collecting fluid using a nasal swab. Specificity rates are usually closer to the PCR tests, although there is significant variation across test brands. See the Johns Hopkins University Center for Health Security for more details. Rapid antigen tests, such as the BinaxNOW COVID-19 Ag Card, whose emergency use authorization has been granted by the FDA, do not require a laboratory or other equipment to process or analyze the test results. Results are usually available within 15 minutes, and the test can be performed in authorized locations including doctors’ offices and emergency rooms. Return to 4
- Proponents of this strategy argue that rapid and cheap tests are not personal diagnostic tools but public health tools, since they help to monitor the spread of the disease in real time. Return to 5
- See https://marriner.eccles.utah.edu/covid-research/. Return to 6
- One possible solution to this issue would be to delay the repeated test for a day to reduce the correlation between tests. Return to 7
- Antibody or serology tests look for antibodies in the blood sample in order to determine if the person had a past infection with SARS-CoV-2. Return to 8
References
- Guglielmi, Giorgia. 2021. “Rapid Coronavirus Tests: A Guide for the Perplexed.” Nature, 590(7845): 202–205. https://doi.org/10.1038/d41586-021-00332-4.
- Manski, Charles F., and Francesca Molinari. 2021. “Estimating the COVID-19 Infection Rate: Anatomy of an Inference Problem.” Journal of Econometrics, 220(1): 181–192. https://doi.org/10.1016/j.jeconom.2020.04.041.
- Paltiel, A. David, and Rochelle P. Walensky. 2020. “Screening to Prevent SARS-CoV-2 Outbreaks: Saliva-based Antigen Testing Is Better Than the PCR Swab.” Federal Reserve Bank of Atlanta, Health Affairs Blog. https://www.healthaffairs.org/do/10.1377/hblog20200909.430047/full.
- Ramdas, Kamalini, Ara Darzi, and Sanjay Jain. 2020. “‘Test, Re-test, Re-test’: Using Inaccurate Tests to Greatly Increase the Accuracy of COVID-19 Testing.” Nature Medicine, 26(6): 810–811. https://doi.org/10.1038/s41591-020-0891-7.
- Rubin, Rita. 2020. “The Challenges of Expanding Rapid Tests to Curb COVID-19.” JAMA, 324(18): 1813–1815. https://doi.org/10.1001/jama.2020.21106.
- Samore, Matthew, Adam Looney, Brian Orleans, Tom Greene, Nathan Seegert, Julio C. Delgado, Angela Presson, Chong Zhang, Jian Ying, Yue Zhang, et al. 2020. “SARS-CoV-2 Seroprevalence and Detection Fraction in Utah Urban Populations from a Probability-based Sample.” Unpublished manuscript. MedRxiv. https://doi.org/10.1101/2020.10.26.20219907.
- Yang, Mu-Jeung, Nathan Seegert, Maclean Gaulin, Adam Looney, Brian Orleans, Andrew Pavia, Kristina Stratford, Matthew Samore, and Steven Alder. 2020. “What Is the Active Prevalence of COVID-19?” Unpublished manuscript. SSRN. https://doi.org/10.2139/ssrn.3734463.
Suggested Citation
Dizioli, Allan, and Roberto B. Pinheiro. 2021. “How Sure Can We Be about a COVID-19 Test Result if the Tests Are Not Perfectly Accurate?” Federal Reserve Bank of Cleveland, Economic Commentary 2021-12. https://doi.org/10.26509/frbc-ec-202112
This work by Federal Reserve Bank of Cleveland is licensed under Creative Commons Attribution-NonCommercial 4.0 International

