

- Share
America’s Changing Tastes
This analysis shows that age-based consumption profiles have been affected by differences in the growth rates of real income and prices since the onset of the Great Recession in 2008. In particular, it shows that the recession caused changes in both the absolute level of households’ consumption as well as the relative shares of income going to purchase necessities and luxuries, and that these changes differed by age group. It also shows that this shift occurred in spite of higher rates of price inflation for necessity goods relative to luxury items.
The views authors express in Economic Commentary are theirs and not necessarily those of the Federal Reserve Bank of Cleveland or the Board of Governors of the Federal Reserve System. The series editor is Tasia Hane. This paper and its data are subject to revision; please visit clevelandfed.org for updates.
Economic researchers have long documented the relationship between age and patterns of consumption. In the standard model of saving and consumption, individuals borrow when they are young, save as they approach and live through middle age, and dis-save when they are old (Modigliani and Brumberg, 1954; Ando and Modigliani, 1963).
It is generally assumed that households with higher incomes and accumulated wealth will allocate a greater share of their disposable income to luxury consumption, relative to less wealthy households. Older age groups generally have higher levels of income and wealth and thus are more likely to be associated with greater degrees of luxury consumption than younger groups.1
During the Great Recession, income fell for most age groups, though by varying degrees. This analysis measures the impact of those decreases on the consumption habits of different age groups.2 In particular, it shows that the recession caused changes in both the absolute level of households’ consumption as well as the relative shares of income going to purchase necessities and luxuries, and these changes differed by age group. It also shows that this shift occurred in spite of higher rates of price inflation for necessity goods relative to luxury items.
Income Growth
To gain insight into changes in real income and consumption patterns across different age groups, we explore data from the Bureau of Labor Statistics’ annual Consumer Expenditure Survey (CES). The CES program consists of two surveys, conducted on an annual basis since 1984, which provide information on the buying habits of American consumers. CES data on income and consumption is provided in terms of “consumer units.” These consumer units parallel households for most purposes and thus will be referred to as households throughout this analysis.3 Households are divided into six “age groups,” determined by the age of the owner or renter of the housing unit: 16-24, 25-34, 35-44, 45-54, 55-64, and 65 and older.4
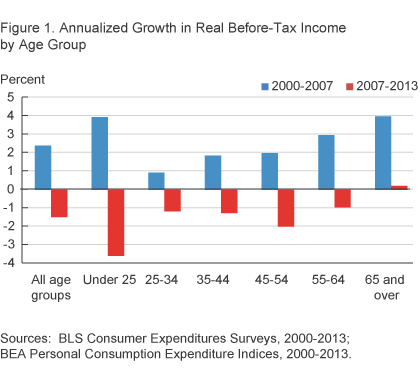
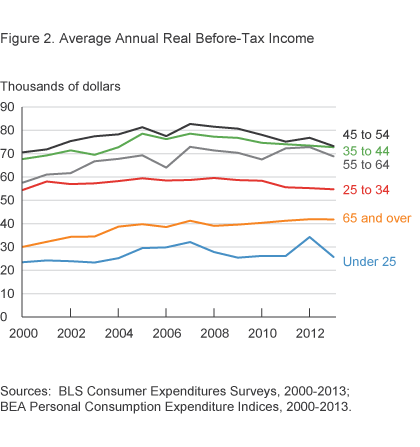
After adjusting the data for inflation5 we see that all age groups experienced growth in their real incomes to differing degrees from 2000 to 2007, and then, with the exception of the oldest group, real incomes fell between 2007 and 2013 (figures 1 and 2). The greatest decline occurred in the youngest age group, those under 25 years old. Across all age groups, real pretax incomes rose at an average annualized rate of 2.4 percent in the pre-recession period and declined 1.5 percent in the recession and recovery period. With such large income changes, it is reasonable to expect that a significant change in consumption spending and composition also occurred.
Changing Levels and Types of Consumption
Changes in consumption patterns can be caused by myriad factors, but one way of thinking about them is in terms of what economists’ call “income and substitution effects.” The income effect refers to the fact that as households’ incomes rise, their consumption increases (up to a point of satiation), while the substitution effect states that households’ consumption patterns are affected by changes in the relative prices of goods. As prices rise for a given good, relative to the price of a substitutable good that provides a comparable level of satisfaction, households will switch to the less costly good when possible. These effects, either in whole or in part, may help explain the shifts in consumption patterns that have occurred across age groups.
Households also can reorder their consumption profiles based on the character of the good or service that is to be consumed. Specifically, households may change how much of a good or service they buy as their incomes and prices change, depending on whether they consider it a luxury or a necessity. In economics, a luxury item is a good or service for which demand increases more than proportionally as income rises. Necessity goods, by contrast, are goods for which demand increases proportionally less as income increases.
The income effect would imply that to the extent possible, households will spend a greater share of their income on luxuries as their income increases and less on necessities. Age factors into the picture such that, as people grow older and their wealth increases, a greater share of their income goes toward the purchase of luxury items (table 1).
Table 1. Relative Percentage of Average Consumption by Age Group of Necessity and Luxury Goods
| Age | |||||||
|---|---|---|---|---|---|---|---|
| All | Under 25 | 25-34 | 35-44 | 45-54 | 55-64 | 65 and older | |
| Necessity goods | |||||||
| 2000-2007 | 37.5 | 50.5 | 37.8 | 34.5 | 35.3 | 35.3 | 45.0 |
| 2008-2013 | 36.7 | 49.1 | 37.6 | 34.0 | 34.7 | 34.0 | 41.4 |
| Luxury goods | |||||||
| 2000-2007 | 57.1 | 44.0 | 56.2 | 59.9 | 59.3 | 59.1 | 50.9 |
| 2008-2013 | 55.9 | 41.7 | 53.8 | 57.9 | 57.5 | 58.3 | 51.8 |
| Indeterminate goods | |||||||
| 2000-2007 | 4.9 | 5.5 | 6.1 | 5.6 | 5.4 | 5.6 | 4.1 |
| 2008-2013 | 4.6 | 9.2 | 8.6 | 8.1 | 7.8 | 7.8 | 6.7 |
Note: The data are adjusted for inflation.
Sources: Bureau of Labor Statistics, Consumer Expenditures Surveys, 2000-2013; Bureau of Economic Analysis, Personal Consumption Expenditure Indices, 2000-2013.
The substitution effect also has implications for the shares of luxury and necessity items consumed. Necessities are goods and services that households consider indispensable and will not likely cut back on even when times are tough. Examples of such items might include food, electricity, water, gas, and even technology such as cell phones and computers. The more necessary a good is, the less responsive its price is to increases in demand for the good, as people will attempt to buy it no matter the price. If prices are rising, a greater share of a household’s income may end up going to these necessity goods and services, if households are not able to substitute away from them due to a lack of appropriate alternatives.
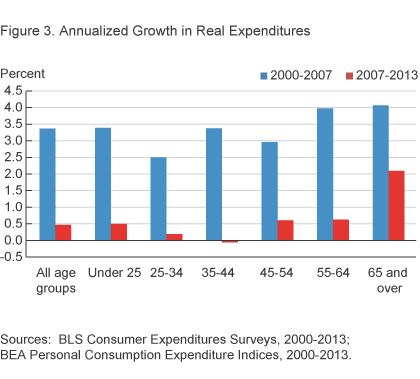
Looking again to the CES data, we see that overall consumption has followed changes in income over theGreat Recession and recovery. From 2000 to 2007, expenditures grew between 2.1 and 4.1 percent for all age groups (figure 3). Once the recession hit and up through 2013, consumption growth fell drastically for all but the oldest age group (though it still fell for them as well).
The Effect of the Recession on the Consumption of Luxuries and Necessities
The consumption data from the CES is recorded in terms of 23 categories of expenditures. We can use these categories to identify changes in the proportions of luxuries and necessities consumed in the different age groups. To do so, each of the 23 categories is classified as a luxury or necessity using a system where luxuries are defined as items that are consumed more, on a percentage basis, as real income levels increase (that is, going from lower to higher income quintiles), and necessities are defined as items that account for a smaller percentage of consumption as real income levels increase (for detail, see Henry, 2014).6 A category is classified as indeterminate if no discernible pattern emerges as income level increases.
Using this method to sort the data into luxury and necessity categories reveals that for households in general, the proportion of income going to the consumption of necessities declined from 2000 to 2007, dropping from 39.5 to 35.1 percent. This again corresponded to a period where households saw rising rates of income growth. However, with the onset of the recession in 2008, the trend reversed, mirroring the trend for income growth, and the share of necessities purchased rose to 37.3 percent of total consumption by 2013.
Meanwhile, the average consumption share for items classified as luxuries declined only slightly over the entire time period, from 56.0 to 55.0 percent. However, this was mainly accounted for by constancy in the older age categories, which largely offset the decline in real luxury consumption among younger age groups.
The data also shows how the consumption of luxuries and necessities varies greatly by age group, and it shows that the recession affected different age groups to lesser or greater degrees. In table 1, one can see that luxury items account for a greater share of the average household’s market basket for those at least 25 and older. In accordance with the income effect, as income levels increased (being proxied for by the successive age groups) luxury consumption became more resistant to decline during the recession and recovery period. Declines in the consumption of luxury items did occur for all age groups during this period with the exception of the oldest, which experienced a marginal increase of 0.9 percentage points in the share of their consumption going to luxury items. Necessity consumption also declined for many but not all age groups during the recession and recovery period. However, the relative percentage allocated toward necessity consumption declined much less for all age groups relative to the magnitude of the luxury share decline.
Inflation for Luxuries and Necessities
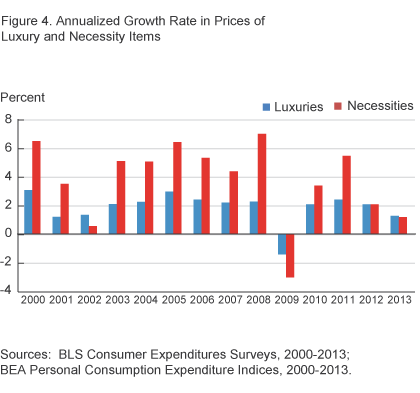
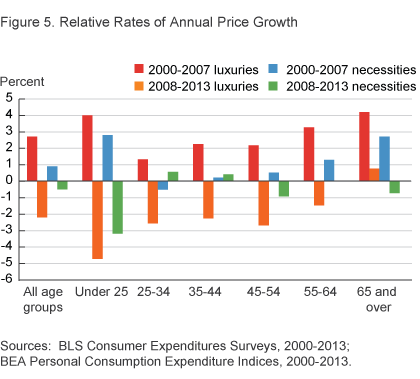
Between 2000 and 2013, the prices of the goods and services used in this analysis, as measured by the Bureau of Economic Analysis’s Personal Consumption Expenditures Index, rose at an average rate of 2.9 percent annually. But luxury and necessity items were not affected equally (figure 4). Price growth for luxuries over the entire period was 1.9 percent, half that of necessities, 3.8 percent. In the pre-recession period, price growth was even more divergent: 2.2 percent for luxuries and 4.7 percent for necessities. However, even up through 2013 the growth of necessity prices (2.7 percent) still exceeded that of luxury prices (1.5 percent). (See figure 5.)
Given the substitution effect, one should expect to see a shift toward luxury consumption during both periods and away from necessity consumption. However, the data does not demonstrate this. What it does show is that while the share of income going toward luxury consumption did increase in the pre-recession period, the share going toward necessity consumption in the recession and recovery period was the most resistant to change, despite higher rates of price growth for necessities. Households sought to maintain, to the best of their abilities, their consumption of necessity items while sacrificing luxury items, during and following the economic downturn. These results speak to the dominant impact that the income effect had relative to the substitution effect in driving consumption trends between the two periods.
Implications
The changes in the relative consumption shares of necessities and luxuries before and after the recession were reinforced by the disparate growth rates of income in different age groups, as well as stronger rates of growth in the prices of necessity goods relative to luxuries. These changes had a greater impact on younger households, as they consume a greater percentage of necessity goods than older households and they generally have lower income and wealth resources to support the consumption of luxury goods during an economic downturn.
Income growth has been stagnant for most sectors of the American population since the turn of the century. All age groups saw declines, or stagnancy, in their income growth rates and adjusted their consumption ratios of necessity to luxury goods. Younger people were the most affected by slow income growth and the rising prices of necessity goods. During the recovery period, people 44 and younger increased their consumption of necessities relative to luxuries. Middle-aged people, 44-54, were the most invariant, holding their consumption mix relatively stable relative to the pre-recession period, while those 55 and older were the most likely to continue increasing the percentage of their income allocated to luxury consumption.
These outcomes bear consideration because the oldest age groups were most likely bearing a large part of the burden of lower interest rates, given that a larger portion of their income is dependent on interest income. For example, according to the Consumer Expenditure Survey, in 2013 people 65 and older received approximately 13 times the amount of interest and dividend income as people 24 and younger. Additionally, the presence of income stabilizers such as Social Security and pensions makes older groups more invariant to economic shocks that would otherwise cause them to reduce or change their consumption patterns.
It should also be noted that these trends are in stark contrast to the long-term trend that typified the reduction of necessity consumption across all age groups prior to the recession. The degree to which this development is or will become permanent has yet to become obvious, but if it were to become permanent it could materially impact production patterns in the future. For example, people aged 25-44, the prime age group at which Americans normally purchase their first home, decreased the relative percentage of their income going to purchase owned dwellings, a luxury good, by an average of 0.8 percent between 2008 and 2013, relative to the 2000-2007 period. Similarly, this group’s consumption of the relative necessity, rented dwellings, rose by 1.0 percent in the post-2007 period.
Such movement is consistent with the resurgence in multifamily construction and the relative weakness in single-family construction that has been observed over a similar period. Continued weak growth in housing construction, due to this and other factors, would directly lessen the nation’s potential future GDP growth.
Footnotes
- According to the Federal Reserve’s 2013 Survey of Consumer Finances, median family net worth rose significantly as the age of the household head increased. For example, families with household heads 35 and younger had a median net worth in 2013 of $10,400. For households with heads aged 65-74, the peak age group for this measure, it was $232,100. Return to 1
- For purposes of this analysis, “age group” is defined as the age of the first household member mentioned by a respondent answering the question “Start with the name of the person or one of the persons who owns or rents the home,” in the Bureau of Labor Statistics’ Consumer Economics Survey. Return to 2
- A consumer unit consists of any of the following: (1) All members of a particular household who are related by blood, marriage, adoption, or other legal arrangements; (2) a person living alone or sharing a household with others or living as a roomer in a private home or lodging house or in permanent living quarters in a hotel or motel, but who is financially independent; or (3) two or more persons living together who use their incomes to make joint expenditure decisions. The reference person of the consumer unit is the first member mentioned by the respondent when asked to “Start with the name of the person or one of the persons who owns or rents the home.” It is with respect to this person that the relationship of the other consumer unit members is determined. Return to 3
- While it is often useful to look at individuals’ incomes, many consumption decisions are shared across a household. Return to 4
- Data were adjusted for inflation using the Bureau of Economic Analysis’s Personal Consumption Expenditures Index. The historical price series was used. All price-related references in the analysis relate to 2009 price levels. Return to 5
- Category-specific results of the relative consumption percentages are provided in Henry, 2014. Return to 6
References
- Ando, Albert, and Franco Modigliani, 1963, “The ‘Life-Cycle’ Hypothesis of Saving: Aggregate Implications and Tests,” American Economic Review, 53(1), 55–84.
- Henry, LaVaughn, 2014. “Consumer Spending Reflects New Priorities after the Recession” Economic Commentary, 2014-18.
- Modigliani, Franco, and Richard H. Brumberg, 1954, “Utility Analysis and the Consumption Function: An Interpretation of Cross-section Data,” in Kenneth K. Kurihara, ed., Post-Keynesian Economics, New Brunswick, NJ. Rutgers University Press, pp. 388-436.
Suggested Citation
Henry, LaVaughn M. 2015. “America’s Changing Tastes .” Federal Reserve Bank of Cleveland, Economic Commentary 2015-08. https://doi.org/10.26509/frbc-ec-201508
This work by Federal Reserve Bank of Cleveland is licensed under Creative Commons Attribution-NonCommercial 4.0 International

