

- Share
Racial and Ethnic Differences in College Major Choice
There are large differences in the average earnings of people who choose different college majors. Majors in computer science, mathematics, and in a variety of engineering fields are associated with high earnings, while majors such as counseling psychology, early childhood education, and social work are associated with low earnings. A recent report finds the median annual earnings for full-time, full-year workers with a terminal bachelor’s degree in petroleum engineering are $120,000, whereas the comparable figure for those who had majored in counseling psychology is only $29,000 (What’s It Worth? The Economic Value of College Majors).
It is not clear to what extent these earnings disparities reflect a true causal effect of college major on earnings and to what extent they reflect differences in the characteristics of students who choose to major in different subjects. But it seems safe to say that the choice of a college major has at least some effect on economic outcomes for students. And if college majors affect outcomes for individuals, they may also affect differences in outcomes across demographic groups, such as the lower incomes of blacks and Hispanics relative to whites and Asians. If this is the case, then studying differences in college major choice across groups may help in understanding economic disparities between groups. Much attention has been paid, for example, to gender differences in the propensity to major in STEM (science, technology, engineering, and mathematics) subjects. Here I consider differences in college major choice by race and ethnicity.
The data come from the Integrated Postsecondary Education Data System (IPEDS), a survey conducted by the National Center for Education Statistics in the US Department of Education. Completing the IPEDS survey is required of all colleges and universities that participate in federal financial aid programs. The survey can thus roughly be thought of as a census of institutions of higher education. I use information on the number of bachelor’s degrees received by members of four mutually exclusive groups, Asians, blacks, Hispanics, and whites, in different majors between July 1, 2012, and June 30, 2013. IPEDS categorizes majors using six-digit codes from the Classification of Instructional Programs (CIP), which standardizes majors across institutions but still allows for fine detail on majors.
Looking at the most popular majors by racial and ethnic group, one feature that is apparent is the great deal of similarity across groups. For example, business administration, psychology, nursing, and biology are four of the top five majors for all four of the groups shown. There are some differences, however. For example, economics, finance, and electrical engineering appear on the top-ten list only for Asian students, whereas social work appears on the list only for black students. Elementary education, history, and marketing are unique to the top-ten list for white students.
| Asian | Black | ||
|---|---|---|---|
| Major | Percent | Major | Percent |
| Business Administration | 8.2 | Business Administration | 10.3 |
| Biology | 8.2 | Psychology | 7.2 |
| Nursing | 5.7 | Nursing | 5.8 |
| Psychology | 5.5 | Criminal Justice/Safety Studies | 3.5 |
| Accounting | 3.8 | Biology | 3.3 |
| Economics | 3.7 | Sociology | 3.2 |
| Finance | 2.6 | Social Work | 2.3 |
| Political Science | 2.1 | Accounting | 2.3 |
| Sociology | 1.7 | Political Science | 2.2 |
| Electrical Engineering | 1.7 | Criminal Justice/Law Enforcement Administration | 2.0 |
| Hispanic | White | ||
| Major | Percent | Major | Percent |
| Business Administration | 7.7 | Business Administration | 6.5 |
| Psychology | 7.6 | Psychology | 6.0 |
| Nursing | 4.9 | Nursing | 5.9 |
| Biology | 3.5 | Biology | 3.5 |
| Sociology | 2.9 | Accounting | 2.8 |
| Criminal Justice/Safety Studies | 2.8 | English | 2.8 |
| Accounting | 2.7 | Elementary Education | 2.6 |
| Political Science | 2.6 | History | 2.4 |
| English | 2.2 | Political Science | 2.3 |
| Multi-/Interdisciplinary Studies | 2.0 | Marketing | 2.0 |
Source: Author’s calculations from Integrated Postsecondary Education Data System (IPEDS) data for July 1, 2012 – June 30, 2013.
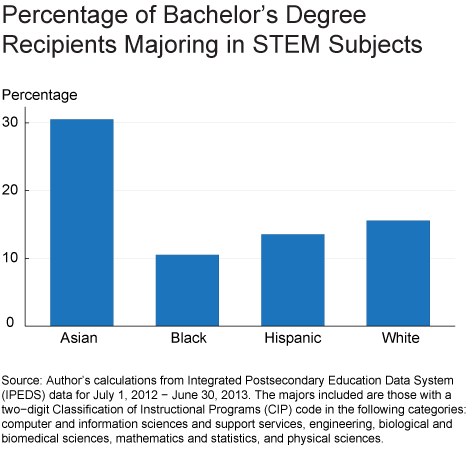
To explore differences in major choice by race and ethnicity across broader groups of majors, I aggregate majors up to the two-digit CIP level. I begin by examining differences in STEM subjects. I use a narrow definition of “STEM fields,” which includes only fields with a two-digit major code in the following categories: computer and information sciences and support services, engineering, biological and biomedical sciences, mathematics and statistics, and physical sciences. Using this definition, about 16 percent of white bachelor’s degree recipients had a major in a STEM subject, and over 30 percent of Asian students did. The comparable figures for black and Hispanic students are around 11 percent and 14 percent, respectively.
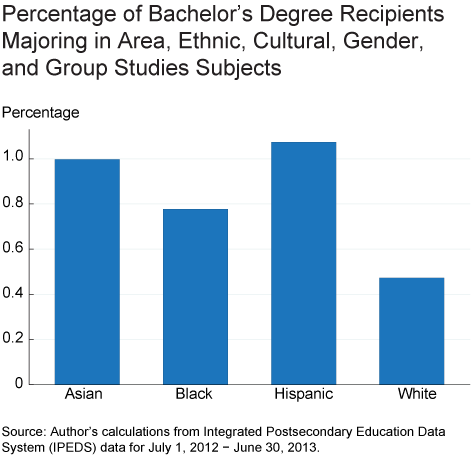
If STEM fields have a disparity in favor of Asian and white students, which fields have a disparity in favor of black and Hispanic students? One set of fields with particularly low representation from white students consists of those included in the two-digit CIP major category “area, ethnic, cultural, gender, and group studies.” However, relatively few students from any racial or ethnic group major in these subjects. Less than 1 percent of black students major in these subjects, about 1 percent of Asian students do, and only slightly more than 1 percent of Hispanic students do.
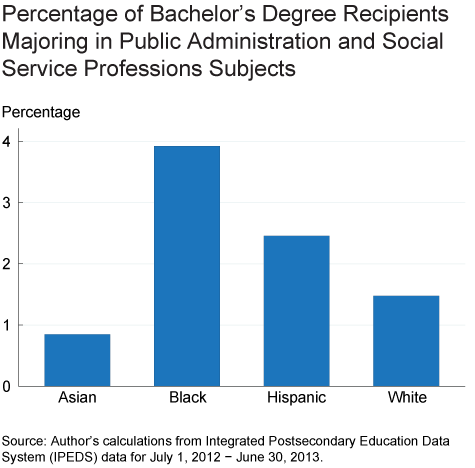
An area in which there is an even larger disparity in favor of black and Hispanic students is the two-digit CIP major category for public administration and social service professions. Nearly 4 percent of black students and 2.5 percent of Hispanic students major in these subjects, whereas only around 1.5 percent of white students do and less than 1 percent of Asian students do.
So although there are a number of similarities in major choice across racial and ethnic groups, there are also some differences. And there are inherent tradeoffs for policies and programs designed to draw students into selected majors. New students in these majors must come from somewhere. The possibilities are students who would not have otherwise attended college, students who would add the selected major as an additional major, and students who would major in the selected subject instead of some other subject. For example, having more STEM majors may come partly at the expense of fewer social work majors. Whether this shift would enhance students’ overall well-being or be best for society as a whole is a difficult question.