

- Share
The Prospects of Non-College-Bound Workers in the Fourth District

The views expressed in this report are those of the author(s) and are not necessarily those of the Federal Reserve Bank of Cleveland or the Board of Governors of the Federal Reserve System.
Introduction
It's hard to argue against the value of education - both for individual workers and the labor market as a whole. For example, at the metropolitan level, the average wage of workers with a bachelor's degree was anywhere from 1.4 to 2.2 times the average wage of a high school degreed worker in 2011. And this wage difference has been increasing since the early 1980s.1 Still, roughly 66 percent of individuals in the U.S. labor market did not have a 4-year college degree in 2011, and, according to recent research, the prospects of these less-educated workers will vary widely depending not only on their subsequent training and occupations, but also on where they live.2
In the Fourth Federal Reserve District - comprising Ohio, western Pennsylvania, eastern Kentucky, and the panhandle of West Virginia - many local labor markets have in common an industrial past, one in which less-educated workers had a good chance of enjoying middle-class wages in manufacturing employment. Decades after their heyday, these metro areas are striving to re-invent themselves in the midst of continued population decline and significant changes in job opportunities, such as the progressive polarization of employment towards relatively low skill/low wage and high skill/high wage occupations.3 More recently, the population of workers without a college degree has been especially hard hit by the Great Recession, and has thus been the focus of many workforce development initiatives nationally and regionally. Partnerships among industry groups, economic development organizations, and academic institutions, often supported by foundations and state or federal funding, have led to increasing training opportunities for low-educated workers that qualify them for high-demand jobs in their local labor markets.4
In this report, we describe the current patterns of employment, wages, and education of eight of our Fourth District metro areas, or MSAs (metropolitan statistical areas) - Akron, Cincinnati, Cleveland, Columbus, Dayton, Pittsburgh, Toledo, and Youngstown - as they compare to the 100 largest metros in the nation. Throughout the analysis, we point to relevant labor market research as we examine the prospects of workers in the region without a college degree. How is this group specifically faring, and what do their employment and earning prospects look like?
Overall, we see in our analysis that educational attainment, measured by the share of college graduates, has increased from 32 to 34 percent among young workers between 2006 and 2011. This is consistent with national trends. But a college degree does not necessarily lead to higher wages; training and occupation choices also matter. In 2011, the top 30 percent of earners with a high-school degree earned more than what 50 percent of workers with an Associate's degree earned. This same top-earning group of high-school-degree workers also made more than a quarter of workers with bachelor's degrees. We find that higher-paid high-school-degreed workers are represented more heavily in occupations that require technical post-secondary education attainable through certificates or apprenticeships. However, while the completion of certificates has grown rapidly over the past decade, some researchers argue that a significant share of these certificate programs do not provide economic value.5
While wages of non-college workers vary widely with training and occupation, they also appear to depend on the overall level of education of the metropolitan labor market.6 Research on "knowledge spillovers" tries to identify the potential effects of education beyond the individual level, such as benefits that could derive from increased innovation within and across industries. We briefly discuss this research and note that the average wages of high-school-degree workers do, in fact, tend to be higher for metros with a higher share of workers holding a bachelor's degree.
Based on our analysis of employment and education patterns in Fourth District metros, and in light of recent labor market research, we conclude by stressing the importance of education and career guidance that includes post-secondary education short of a college degree. Increasing the number of college graduates is undeniably desirable for the economic health of a region; it is also important to make sure that every high-school student graduates with strong analytical and soft skills, along with the guidance needed to access technical and service jobs that provide for middle-class wages and a more equitable region.
Increasing the number of college graduates is undeniably desirable for the economic health of a region; it is also important to make sure that every high-school student graduates with strong analytical and soft skills, along with the guidance needed to access technical and service jobs that provide for middle-class wages and a more equitable region.
Education of the Workforce
Our analysis uses Public Use Micro Samples from the 100 largest (in 2011) metropolitan statistical areas in the country for the years 2006 and 2011. These metro areas exhibit a wide variation in the education of their labor force. The share of individuals in the labor market under the age of 35 with a bachelor's or post-graduate degree, for example, ranges from just above 10 percent to 45 percent. On average, this share increased about 2 percentage points from 32 to 34 percent between 2006 and 2011, with no distinct differences between less- and more-educated metros. Among the eight metro areas in the Fourth District in our analysis - Akron, Cincinnati, Cleveland, Columbus, Dayton, Pittsburgh, Toledo, and Youngstown - Pittsburgh had the highest share of workers younger than 35 with at least a bachelor's degree, with 38 percent, and Youngstown had the lowest share, at 19 percent.
We also see some notable differences at the lower levels of educational attainment for young workers in these metros. A relatively low high-school drop-out rate can be a sign of strength in a school system itself and of the regional economy as a whole. Among the MSAs in our region, Pittsburgh has the most desirable combination of educational metrics: It is the 7th-highest metro (out of the nation's 100 largest MSAs) in terms of college-degreed workers under the age of 35 and has the 3rd-lowest share of drop-out workers in this age group. Dayton, on the other hand, has about twice the share of high-school dropouts and half the share of college graduates.
Where does your city fall? Rankings of Top 100 MSAs on Educational Attainment of Young Workers
Share of High-Skilled versus Low-Skilled Young Workers, 2001 Workers 18-35 years old
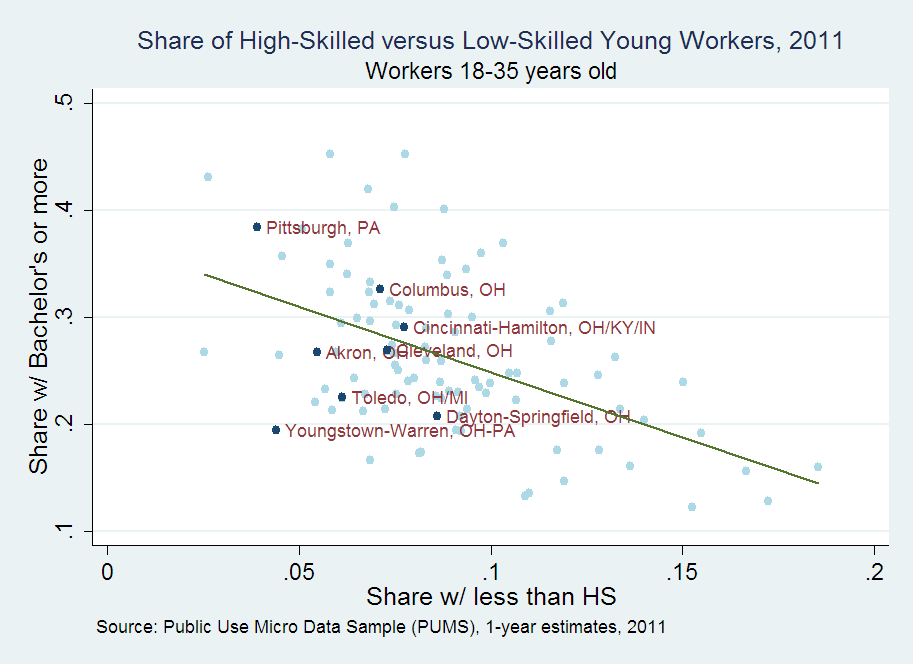
Source: Public Use Micro Data Sample (PUMS), 1-year estimates, 2011.
Differences in Wages by Education
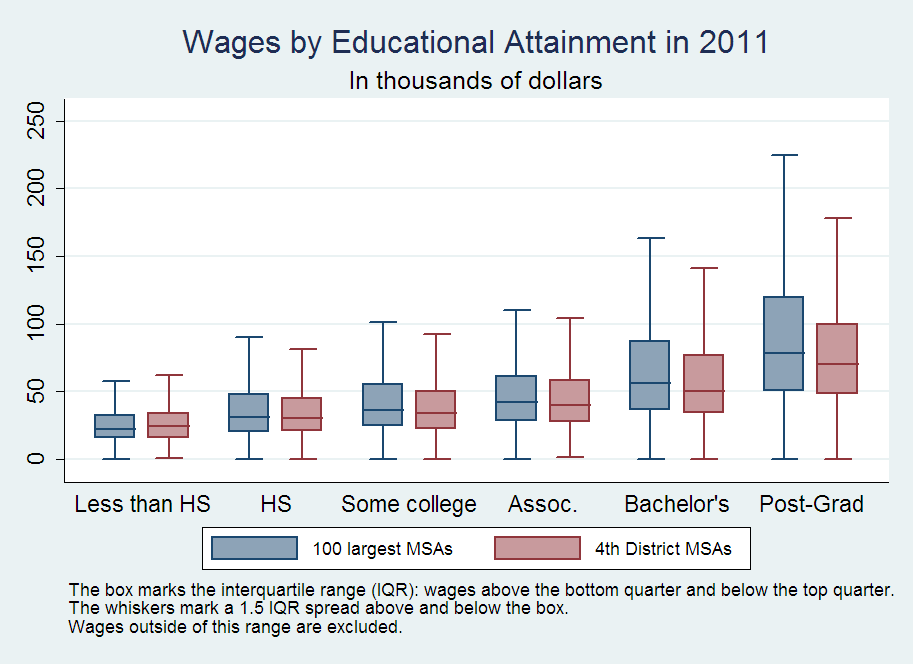
While it is clear that average wages are higher for more-educated versus less-educated workers, there is quite a bit of variation in this "wage premium" at the metropolitan level. Among the 100 largest metro areas studied, the average wage of workers with a bachelor's degree was anywhere from 40 percent to 120 percent higher than the average wage of high-school-degreed workers in 2011. In our region, the Cincinnati metro had the highest premium, at 84 percent, and Youngstown the lowest, at 54 percent. But averages are not informative of the degree of wage variation within each educational category. (The six educational categories used here are less than high school, high school degree, some college, Associate's degree, bachelor's degree, and post-graduate degree.) So in Figure 2 we use box-plots to compare wages of full-time, full-year workers by educational attainment in all MSAs and in our District. The wage premium over a high-school diploma is small for those with some college as well as for workers with an Associates' degree, for instance. Larger wage premiums apply at the bachelor's and post-graduate levels, although these premiums are smaller for the metros in our District, particularly above the median.
Researchers Autor and Dorn argue that much of the rising polarization in wages and employment has to do with the movement of low-skilled workers from routine-task-intensive occupations into service occupations, a consequence of both the increasing adoption of information technology and an increasing demand for services. The researchers document that low-skill service occupations have been growing rapidly since the 1980s, while low-skill/low-wage, non-service occupations continued their precipitous fall through that period. With local labor markets seeing higher concentrations of employment in high-skill/high-wage occupations and low-skill service occupations, then, it may not be surprising that the employment outlook of less-educated workers is tied to the overall educational attainment of their local labor markets.
Wages by Educational Attainment in 2011
The Social Returns to Education
Stated differently, the returns to education appear to extend beyond the individual level in the sense that a less-educated worker may benefit (e.g., earn higher wages) from working among more-educated workers. The argument is that low-educated workers can be more productive in a more-educated labor market and that they also benefit from knowledge spillovers to the local economy as a whole.7
To help illustrate this point, Figure 3 shows the relationship between the share of college-degree workers and average full-time, full-year wages for all workers. (Each dot corresponds to one of the top 100 MSAs; those in our District are represented by dark blue dots.) In order to factor out the individual returns to education, in Figure 4 we plot the same relationship for wages of high-school graduates only. While the association is stronger for the average wages across all workers regardless of education (0.82 correlation), it is also the case that, on average, low-educated workers are likely to have higher wages in cities with higher shares of college graduate workers (correlation 0.37).8 Is it possible that these higher wages reflect the higher cost of living of more-educated cities? Certainly, to some extent. But the positive relation between education and wages continues to hold when we account for differences in the median rent, which can proxy for the cost of living.9
Judging by their average wages, workers with equally low levels of education would seem to be better off in more-educated cities, but correlation alone cannot confirm this. One researcher, using 1980 and 1990 Census data, finds that a percentage-point increase in the supply of college graduates caused wages of high-school-degree workers to rise by 1.6 percent during those years.10 In our District metros, this relationship seems somewhat more subdued, as wages of workers with a high-school degree are at or below the expected wage given their respective metro's share of college graduates.
We also see potential positive effects of education on the labor market as a whole when we consider unemployment rates. Because more-educated individuals are less likely to be unemployed (we can refer to this as the individual level effect of education), it is expected that more-educated cities will have lower levels of unemployment (see figure 5). But that may not be the whole story. A trio of researchers finds that, for January 2010, the negative correlation between skills and unemployment rates is stronger than would be predicted by individual level effects, suggesting that educated cities overall may be more resilient to economic downturns.11
Average Wages and Education of Labor Force, 2011, Workers aged 18 and above
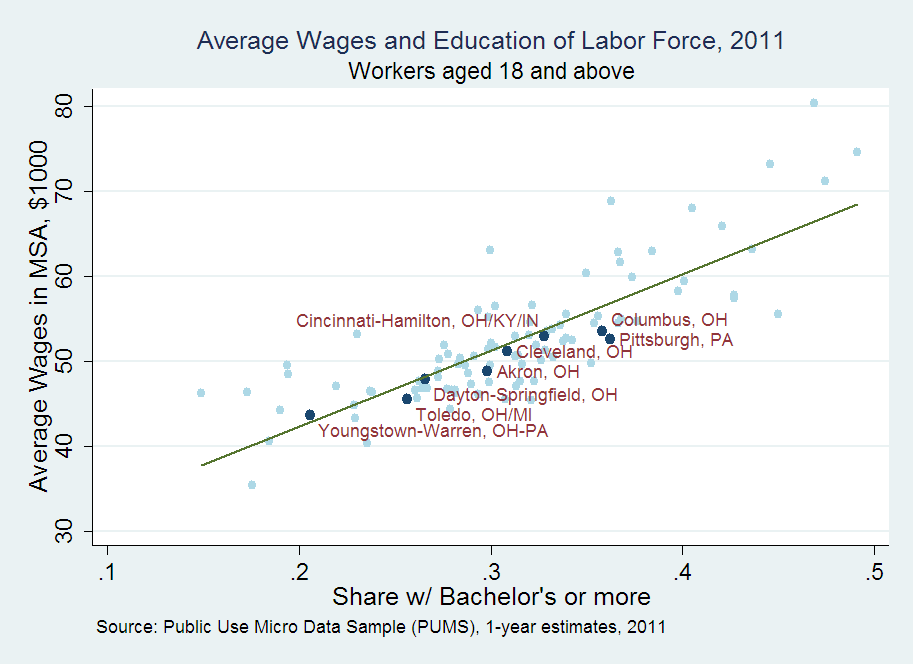
Source: Public Use Micro Data Sample (PUMS), 1-year estimates, 2011.
Wages of Low-Educated Workers by Education of Labor Force, 2011, Workers aged 18 and above
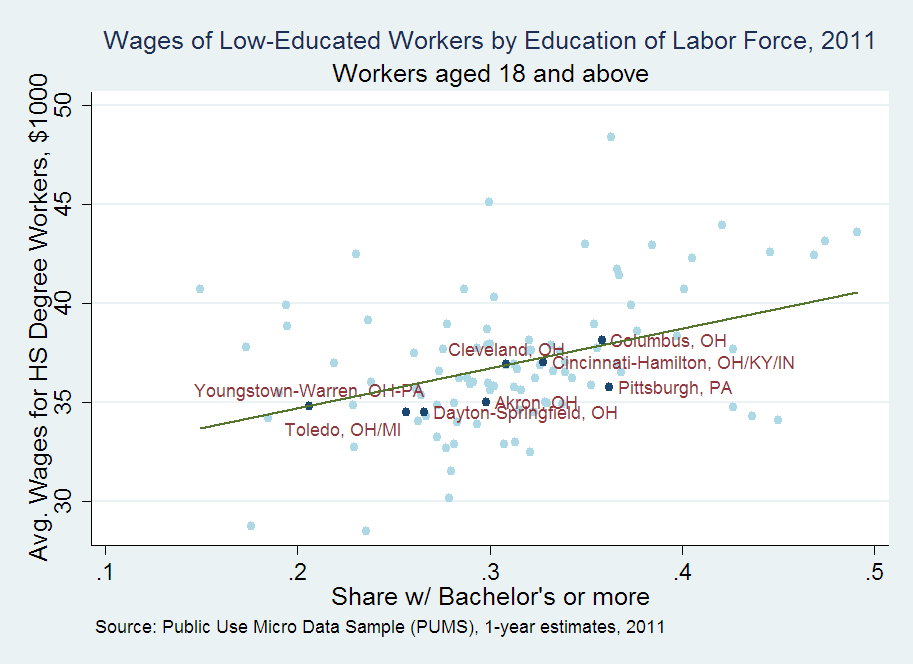
Source: Public Use Micro Data Sample (PUMS), 1-year estimates, 2011.
Figure 5 shows that the link between education of the workforce and overall unemployment follows the expected direction - more educated cities tend to have lower unemployment rates - with a correlation of -0.53. This association between education and unemployment is weaker when we look at high-school-degree workers only, as seen in Figure 6 (correlation is -0.30), suggesting that other factors besides college shares have an influence on the unemployment of less-educated workers. Among the Fourth District MSAs, Pittsburgh stands out for having relatively low wages among high school graduates despite being a highly educated city. Yet it is also worth noting that Pittsburgh has the lowest unemployment rate among less-educated workers compared to the other District metros. About 9 percent of workers with a high school diploma were unemployed in 2011 in Pittsburgh, whereas Cincinnati, Akron, and Cleveland had 14 percent and Toledo almost 16 percent unemployment in this group.
Unemployment Rate by Education of Labor Force, 2011, Workers aged 18 and above
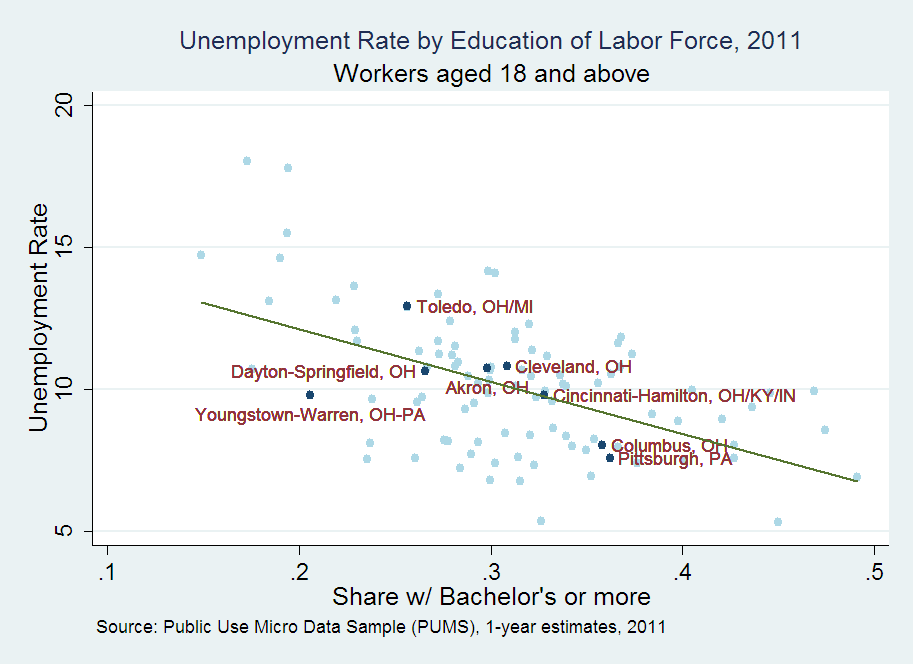
Source: Public Use Micro Data Sample (PUMS), 1-year estimates, 2011.
Unemployment Rate by Education of Labor Force, 2011, Workers with HS Degree, aged 18 and above
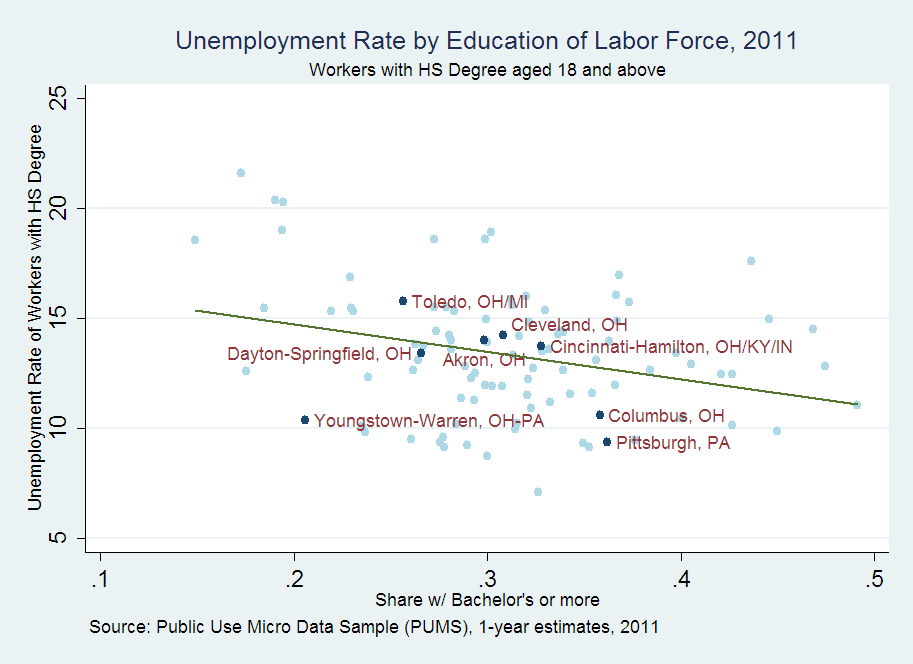
Source: Public Use Micro Data Sample (PUMS), 1-year estimates, 2011.
Wage Differences by Occupation
A more granular look at the data shows that wages vary considerably, even within the same education level. For instance, nationally we find that the top 30 percent of young high-school-degree earners make as much or more money than 50 percent of young workers with an Associate's degree. They also earn more than a quarter of young workers with a bachelor's degree. In our District MSAs, the overlap is slightly smaller at the Associate's level, but wider for workers with a bachelor's degree: The top 30 percent of young high-school-degree earners in these eight cities make more than what 30 percent of young workers with a bachelor's degree make.
The wage overlap between workers with a high school versus an Associate's degree could have several explanations. It might be due in part to a mismatch of worker skills to job skills, or to a misalignment of 2-year college degrees with labor-market demands. It is also possible that certificates or training, which are not included in the data, could contribute to this overlap. According to researchers whose work looks at certificates and training, the attainment of certificates has jumped dramatically in the past several decades: In 1984 only 2 percent of adults had certificates as their highest educational attainment; by 2009, it was 12 percent.12 Since the difference in wages between certificate holders and high-school graduates with no certificates varies widely, these researchers developed a method to identify the certificate fields that have a significant economic value - that is, that provide at least a 20-percent difference in wages relative to a high-school diploma. By their measures, Pennsylvania ranks 18th among the 50 states and Ohio 28th in terms of the percent of certificates awarded in 2010 with economic value (55 and 50 percent, respectively).
Next, we take a look at the occupations of high-school-degreed young workers at the top (highest 30 percent) and bottom (lowest 30 percent) of the wage spectrum. Figure 7 shows how these workers are distributed across occupations, where occupations have been ordered from the lowest to the highest average wage in Fourth District metros. At the lower end of wages (blue bars), we see a higher concentration of young workers with a high-school degree in Food Preparation occupations in Fourth District metros compared to all metros (24 percent and 18 percent, respectively). This explains in part the lower wages of less-educated workers in the region (see Figure 4), as average wages in Food Preparation are by far the lowest among all occupations. At the higher end of the wage spectrum (red bars), we find greater shares of low-educated workers in Installation & Repair and Management jobs. In our eight Fourth District MSAs, jobs in Production and Construction also have greater shares of low-educated workers earning higher wages - although jobs in these occupations have fallen from 2006 to 2011. Most notably, in 2006, 14 percent of young workers with a high-school diploma but not a college degree were employed in production occupations across the eight District metros. By 2011, only 11 percent of such workers held production jobs. Across the 100 largest MSAs in the nation, the decline was much less pronounced, going from about 9 percent to 8 percent.
Employment Share of High-School Degree Young Workers across Occupations
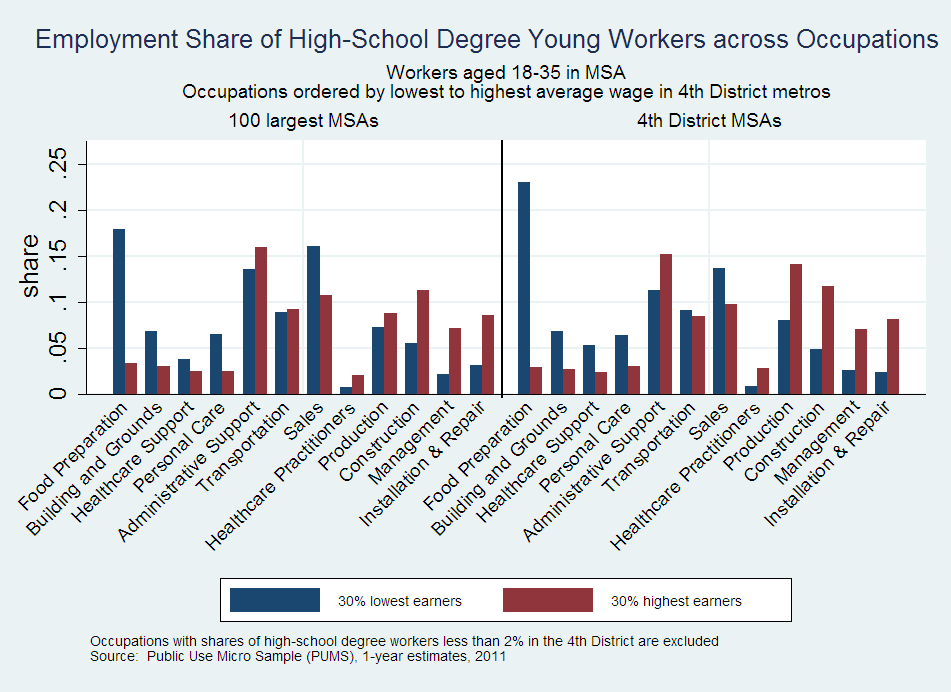
Source: Public Use Micro Data Sample (PUMS), 1-year estimates, 2011.
The Bottom Line: Education Matters
While jobs in the manufacturing sector continue to be a source of decent wages in the Fourth District, our region is not exempt from the labor market polarization documented over the past three decades, trending towards high-skill occupations and low-skill, service occupations. High skills favor innovation and entrepreneurship, which ought to increase the demand for services in the local economy. Higher-paid service occupations often require cognitive and soft skills that are acquired during the primary and secondary years, and technical skills that can be learned through 1-2 year certificate programs and on-the-job training. In this context, investments in education at the lower levels - high school and younger - clearly matter. Increasing high-school graduation rates and facilitating access to post-secondary education that is in line with local labor demands should give non-college-bound workers higher chances of reaping the social returns to education.
Footnotes
- David Autor and David Dorn, 2013. "The Growth of Low-Skill Service Jobs and the Polarization of the U.S. Labor Market." American Economic Review, 103(5), 1553-1597.
- Enrico Moretti, 2004. "Estimating the Social Return to Higher Education: Evidence from Longitudinal and Repeated Cross-Sectional Data." Journal of Econometrics, 121(1-2).
- Autor and Dorn, 2013.
- Harry J. Holzer, 2012. "Good workers for good jobs: improving education and workforce systems in the US." IZA Journal of Labor Policy, 1:5.
- Anthony P. Carnevale, Stephen J. Rose, and Andrew R. Hanson, 2012. "Certificates: Gateway to Gainful Employment and College Degrees." Georgetown University Center on Education and the Workforce.
- Moretti, 2004.
- Moretti, 2004.
- A correlation coefficient is a measure of linear association between two variables. It can take values anywhere from -1 to 1, with zero indicating no correlation at all, and 1 (-1) indicating a linear co-movement of variables in the same (opposite) direction.
- We use HUD's 2-bedroom median rents for 2011 at the CBSA level and compute the (log) average wage-to-median-rent ratio.
- Moretti, 2004. One way in which Moretti tries to identify the effect of education on wages is by looking at the variation in education of the workforce during 1980 and 1990 due to differences in the age structure of cities in 1970. Age structure influences college shares in the future because of the long-run trend of younger generations to become more educated. Assuming that the 1970 age structure of cities can only influence future wages through its effect on future college shares, he estimates the effect of age-structure-induced education differences on wages in 1980 and 1990, free from other factors.
- Edward L. Glaeser, Giacomo A.M. Ponzetto, and Kristina Tobio, 2011. "Cities, Skills, and Regional Change." National Bureau of Economic Research Working Paper 16934.
- Carnevale, Rose, and Hanson, 2012
Table: Educational attainment of workers aged 18-35 years old, 2011
| 100 Largest Metro Areas in 2011 | Rank(1=highest % with BA+) | Percent with BA degree or more | Percent HS dropouts | Rank (1= lowest % HS dropouts) |
|---|---|---|---|---|
| Washington, DC/MD/VA | 1 | 45.3% | 7.8% | 45 |
| Boston, MA-NH | 2 | 45.2% | 5.8% | 13 |
| Madison, WI | 3 | 43.0% | 2.6% | 2 |
| San Jose, CA | 4 | 42.0% | 6.8% | 24 |
| San Francisco-Oakland-Vallejo, CA | 5 | 40.3% | 7.5% | 37 |
| New York-Northeastern NJ | 6 | 40.1% | 8.8% | 60 |
| Pittsburgh, PA | 7 | 38.4% | 3.9% | 3 |
| Minneapolis-St. Paul, MN | 8 | 38.2% | 5.1% | 7 |
| Seattle-Everett, WA | 9 | 36.9% | 6.3% | 19 |
| Raleigh-Durham, NC | 10 | 36.9% | 10.3% | 77 |
| Austin, TX | 11 | 36.0% | 9.7% | 74 |
| Ann Arbor, MI | 12 | 35.7% | 4.6% | 6 |
| Chicago, IL | 13 | 35.3% | 8.7% | 59 |
| Albany-Schenectady-Troy, NY | 14 | 35.0% | 5.8% | 12 |
| Hartford-Bristol-Middleton- New Britain, CT | 15 | 34.5% | 9.4% | 69 |
| Philadelphia, PA/NJ | 16 | 34.0% | 6.3% | 18 |
| Denver-Boulder, CO | 17 | 33.9% | 8.9% | 61 |
| Baltimore, MD | 18 | 33.2% | 6.9% | 27 |
| Columbus, OH | 19 | 32.6% | 7.1% | 30 |
| Rochester, NY | 20 | 32.4% | 6.8% | 25 |
| Buffalo-Niagara Falls, NY | 21 | 32.3% | 5.8% | 11 |
| Milwaukee, WI | 22 | 31.5% | 7.4% | 34 |
| Atlanta, GA | 23 | 31.3% | 11.9% | 86 |
| Nashville, TN | 24 | 31.2% | 7.0% | 29 |
| Monmouth-Ocean, NJ | 25 | 31.1% | 7.6% | 43 |
| Kansas City, MO-KS | 26 | 30.6% | 7.9% | 47 |
| Indianapolis, IN | 27 | 30.5% | 11.6% | 83 |
| Richmond-Petersburg, VA | 28 | 30.3% | 8.9% | 62 |
| Charlotte-Gastonia-Rock Hill, NC-SC | 29 | 30.0% | 9.5% | 71 |
| Wilmington, DE/NJ/MD | 30 | 29.9% | 6.5% | 21 |
| Charleston-N. Charleston, SC | 31 | 29.6% | 6.9% | 26 |
| St. Louis, MO-IL | 32 | 29.5% | 6.1% | 16 |
| Portland, OR-WA | 33 | 29.3% | 7.5% | 41 |
| Cincinnati-Hamilton, OH/KY/IN | 34 | 29.0% | 7.7% | 44 |
| Omaha, NE/IA | 35 | 29.0% | 8.3% | 52 |
| Birmingham, AL | 36 | 28.6% | 9.1% | 64 |
| Los Angeles-Long Beach, CA | 37 | 27.8% | 11.6% | 84 |
| San Diego, CA | 38 | 27.4% | 7.4% | 35 |
| Syracuse, NY | 39 | 27.2% | 8.3% | 51 |
| Cleveland, OH | 40 | 26.9% | 7.3% | 32 |
| Allentown-Bethlehem-Easton, PA/NJ | 41 | 26.8% | 7.3% | 33 |
| Honolulu, HI | 42 | 26.7% | 2.5% | 1 |
| Akron, OH | 43 | 26.7% | 5.5% | 9 |
| Fort Lauderdale-Hollywood-Pompano Beach, FL | 44 | 26.7% | 6.0% | 15 |
| Grand Rapids, MI | 45 | 26.6% | 7.5% | 38 |
| Little Rock--North Little Rock, AR | 46 | 26.6% | 7.5% | 36 |
| Knoxville, TN | 47 | 26.5% | 4.5% | 5 |
| Dallas-Fort Worth, TX | 48 | 26.2% | 13.3% | 91 |
| Providence-Fall River-Pawtucket, MA/RI | 49 | 26.0% | 8.3% | 53 |
| Memphis, TN/AR/MS | 50 | 25.9% | 8.7% | 57 |
| Louisville, KY/IN | 51 | 25.5% | 7.5% | 39 |
| Boise City, ID | 52 | 25.0% | 7.6% | 42 |
| Tulsa, OK | 53 | 24.8% | 10.5% | 78 |
| Baton Rouge, LA | 54 | 24.7% | 10.7% | 80 |
| Greensboro-Winston Salem-High Point, NC | 55 | 24.6% | 12.8% | 89 |
| Detroit, MI | 56 | 24.3% | 8.0% | 48 |
| Columbia, SC | 57 | 24.3% | 6.5% | 20 |
| Miami-Hialeah, FL | 58 | 24.1% | 9.6% | 72 |
| Harrisburg-Lebanon--Carlisle, PA | 59 | 24.0% | 7.8% | 46 |
| Houston-Brazoria, TX | 60 | 23.9% | 15.0% | 95 |
| Tampa-St. Petersburg-Clearwater, FL | 61 | 23.9% | 8.7% | 56 |
| Oklahoma City, OK | 62 | 23.8% | 11.9% | 87 |
| New Orleans, LA | 63 | 23.8% | 10.0% | 76 |
| Albuquerque, NM | 64 | 23.5% | 9.7% | 73 |
| Provo-Orem, UT | 65 | 23.3% | 5.7% | 10 |
| Phoenix, AZ | 66 | 23.1% | 8.9% | 63 |
| San Antonio, TX | 67 | 23.0% | 9.2% | 66 |
| Greenville-Spartanburg-Anderson SC | 68 | 22.9% | 9.9% | 75 |
| Mobile, AL | 69 | 22.8% | 7.5% | 40 |
| Scranton-Wilkes-Barre, PA | 70 | 22.8% | 6.7% | 23 |
| Jacksonville, FL | 71 | 22.6% | 8.6% | 54 |
| Toledo, OH/MI | 72 | 22.5% | 6.1% | 17 |
| Orlando, FL | 73 | 22.4% | 8.7% | 58 |
| Wichita, KS | 74 | 22.2% | 10.7% | 79 |
| Norfolk-VA Beach--Newport News, VA | 75 | 22.1% | 5.4% | 8 |
| Springfield-Holyoke-Chicopee, MA | 76 | 21.4% | 9.4% | 70 |
| Salt Lake City-Ogden, UT | 77 | 21.4% | 7.3% | 31 |
| West Palm Beach-Boca Raton-Delray Beach, FL | 78 | 21.3% | 13.4% | 92 |
| Colorado Springs, CO | 79 | 21.3% | 5.9% | 14 |
| Sacramento, CA | 80 | 21.2% | 6.7% | 22 |
| Dayton-Springfield, OH | 81 | 20.8% | 8.6% | 55 |
| Tucson, AZ | 82 | 20.7% | 9.2% | 67 |
| Lancaster, PA | 83 | 20.4% | 14.0% | 94 |
| Augusta-Aiken, GA-SC | 84 | 19.5% | 9.1% | 65 |
| Youngstown-Warren, OH-PA | 85 | 19.4% | 4.4% | 4 |
| Daytona Beach, FL | 86 | 19.3% | 9.2% | 68 |
| Ventura-Oxnard-Simi Valley, CA | 87 | 19.1% | 15.5% | 97 |
| Las Vegas, NV | 88 | 17.6% | 11.7% | 85 |
| Fort Myers-Cape Coral, FL | 89 | 17.6% | 12.8% | 90 |
| Melbourne-Titusville-Cocoa-Palm Bay, FL | 90 | 17.3% | 8.2% | 50 |
| El Paso, TX | 91 | 17.2% | 8.1% | 49 |
| Tacoma, WA | 92 | 16.7% | 6.9% | 28 |
| Stockton, CA | 93 | 16.0% | 13.6% | 93 |
| McAllen-Edinburg-Pharr-Mission, TX | 94 | 16.0% | 18.5% | 100 |
| Lakeland-Winterhaven, FL | 95 | 15.6% | 16.7% | 98 |
| Sarasota, FL | 96 | 14.6% | 11.9% | 88 |
| Modesto, CA | 97 | 13.5% | 11.0% | 82 |
| Riverside-San Bernardino, CA | 98 | 13.2% | 10.9% | 81 |
| Fresno, CA | 99 | 12.8% | 17.2% | 99 |
| Bakersfield, CA | 100 | 12.2% | 15.2% | 96 |
Note: Blue indicates Fourth District MSAs

Source: Public Use Microdata Sample (PUMS), 1- year estimates, 2011.