- Share
Focused on the Workforce…But Why?
At a glance, workforce development may seem outside the Federal Reserve System’s typical purview. But it’s not. A Cleveland Fed analyst offers 10 reasons why the Federal Reserve is committed to workforce development.

1. The Federal Open Market Committee, the monetary policymaking body of the Federal Reserve System, has a mandate to pursue maximum employment. Despite substantial declines in the unemployment rate, significant labor market stresses remain. A well-functioning workforce development system can aid progress toward maximum employment.
2. The Workforce Innovation and Opportunity Act (WIOA), enacted in July 2014 and “designed to help job seekers access employment, education, training, and support services to succeed in the labor market and to match employers with the skilled workers they need to compete in the global economy,” includes reforms that focus on the demand, or employer-side, rather than the supply, or customer-side, of the workforce development process. WIOA calls for significant collaboration across different groups, many of them partners with which the Cleveland Fed already has working relationships: public sector, private sector, philanthropic, educational, and nonprofit institutions.
3. The Cleveland Fed possesses unique attributes to move the policy conversation forward: It functions as an objective and neutral convener that can offer technical assistance on a wide variety of policy-related issues. For example, the Cleveland Fed has recently brought together both public and private workforce development professionals in the Cleveland metro area to discuss ways to overcome challenges faced by the local workforce development system. Moreover, it has the resources available to take a big-picture view and support the long-term changes necessary to improve the workforce development system.
4. The populations traditionally served by the workforce development system align with the Community Development department’s mission to promote stable communities. The Community Development department at the Cleveland Fed has focused on issues that affect low- and moderate-income populations, including housing and access to credit. More recently, these discussions have shifted to focus on access to jobs and other employment-related issues. Recent work, for example, investigates employment prospects for non-college-bound youth.
5. Previous work done by the Cleveland Fed on poverty points to a need for education and training. The conclusions reached in the 2006 Annual Report suggest that “programs encouraging the production of human capital through education and training may be the most fruitful approach to fighting the battle against poverty.” A well-functioning workforce development system is essential to lowering the rate of poverty.
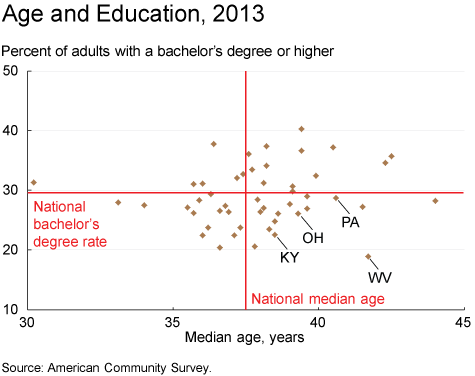
6. Fourth District states are relatively undereducated. The share of college-educated adults is widely used to measure the skill level of a population. Business owners often consider the skill level of the local population when deciding where to locate their businesses. A well-functioning workforce development system will increase education and skill levels of the population in the Fourth District.
7. Fourth District populations are aging. An older population is a potential risk to the District’s economy. The ability to replace older workers as they reach retirement is important, as is the need to make sure that nursing and other health-related and service occupations are staffed appropriately to accommodate the needs of aging populations.
8. Fourth District states specialize in occupations with older workforces, especially within the manufacturing sector (engineering managers, drafters, industrial and mechanical engineers, press machine operators/setters, and lathe operators/setters). The potential risk of not replacing older workforces in these specialized occupations is incalculable. An effective workforce development system works to ensure there exists a pipeline of talent into specialized occupations.
| Total Number of Occupations^ | Share of Occupations with LQ ≥ 1.5 | Share of LQ > 1.5 Occupations That Have an Average Age ≥ 42 | Share of Total State Employment with LQ ≥ 1.5 and Average Age ≥ 42 | |
|---|---|---|---|---|
| US** | 713 | 15.6 | 54.2 | 6.8 |
| Kentucky | 696 | 18.1 | 53.1 | 7.3 |
| Ohio | 731 | 14.1 | 55.3 | 6.5 |
| Pennsylvania | 731 | 11.6 | 65.9 | 3.9 |
| West Virginia | 623 | 24.4 | 50.6 | 15.8 |
*Occupation ages correspond to national statistics
**state employment weighted average
^only includes occupations with available LQ and age data
Source: Bureau of Labor Statistics, Occupational Employment Statistics.
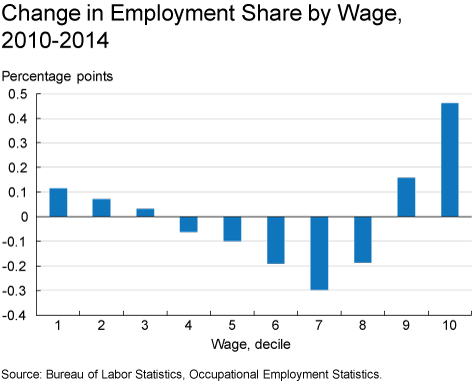
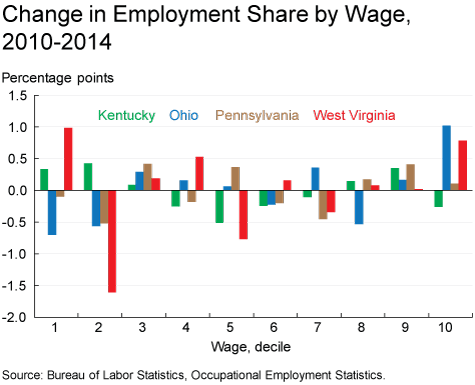
9. Employment growth over the past 4 years has continued the polarization trend in labor markets nationally and in the Fourth District. Technological change and the automation of routine tasks have increased the demand for skilled workers while decreasing the employment opportunities of low- and middle-skill workers. Workers then compete for the remaining manual or low-skill/low-wage tasks that are incapable of being automated. This competition effectively drives down wages further. In short, polarization of the labor market promotes income inequality.
10. The Cleveland Fed’s Community Development department model promotes discussion and debate around workforce development and other important community and economic development issues. Our model leverages on-the-ground networks in order to motivate, inform, and guide policy-oriented research.
Future work from the Cleveland Fed will analyze various supply-and-demand aspects of workforce development in Kentucky, Ohio, Pennsylvania, and West Virginia.
Certainly, we all want to encourage an education, but does it have to be college? Probably not, … There are a lot more avenues for education now than there used to be. And when you talk to business contacts, a lot of them say they’re having trouble finding skilled workers, and a lot of the skills (they need) are not necessarily skills you’d get in college.
If you work in workforce development and would like to discuss some of these or other workforce development topics, please contact the author: kyle.d.fee@clev.frb.org.