

- Share
Using Advance Layoff Notices as a Labor Market Indicator
We use advance layoff notices filed under the Worker Adjustment and Retraining Notification (WARN) Act as an indicator of current and imminent labor market conditions. We have constructed a database of establishment-level notices starting in 1990 by scraping state government websites, contacting state officials, and retrieving historical data. We find evidence that these notices, aggregated to the national level, lead other prominent labor market indicators, such as initial unemployment insurance claims, the change in the unemployment rate, and changes in private employment. The lead relationship seems strongest at one month with economically meaningful magnitudes. Most recently, WARN data suggest a slight increase in labor market slack.


The views authors express in Economic Commentary are theirs and not necessarily those of the Federal Reserve Bank of Cleveland or the Board of Governors of the Federal Reserve System. The series editor is Tasia Hane. This paper and its data are subject to revision; please visit clevelandfed.org for updates.
On March 8, 2019, after operating for over 50 years, the General Motors (GM) plant in Lordstown, Ohio, shut down. Three months earlier, Lordstown’s employees and Ohio state officials had learned of the impending layoff through an advance notice stating that GM expected to lay off about 1,600 workers in March. GM filed this notice in accordance with the Worker Adjustment and Retraining Notification (WARN) Act. The aim of the act is to provide workers with sufficient time to begin new job searches and to trigger services from local rapid response teams, including outplacement services, retraining opportunities, and information about unemployment insurance.1 Soon after Lordstown closed, Ohio officials reported that initial unemployment insurance (UI) claims in Ohio in the week ending March 9 rose by about 1,500 relative to the previous four weeks, almost certainly because of the workers laid off from Lordstown. Events unfolded similarly around Lordstown’s elimination of its third and second shifts in January 2017 and June 2018, respectively.2
More than 2,700 WARN notices were filed in the United States during 2018, affecting almost 290,000 workers. To our knowledge, analysts have not used these data to gauge the current or future state of the labor market. In this Commentary, we assess whether WARN notices filed across the country can signal impending changes in national initial UI claims, as well as movements in other labor market indicators, including changes in the unemployment rate and changes in employment.3
The WARN Data
Under the WARN Act, employers with 100 or more full-time workers (or 100 or more workers who work at least a combined 4,000 hours a week) are required to inform workers, as well as the local government and the state dislocated worker unit, with written notices at least 60 days in advance of a potential plant closure or mass layoff. The act does not cover employees who have worked fewer than 6 months in the last 12 months or those who work an average of fewer than 20 hours a week. The act covers private and quasi-public employers, including nonprofits, but does not cover regular federal, state, or local government employees. Employers can provide fewer-than-60-day notices for the following (rare) exceptions: closing of a faltering company, unforeseeable business circumstances, or a natural disaster.4 About 65 percent of employment was in establishments with 100 or more workers in 2016, according to evidence from the Census Bureau’s Business Dynamics Statistics.
WARN defines plant closures as shutdowns for more than six months at a single site of employment if the shutdown results in an employment loss for 50 or more employees and occurs over any 30-day period. A mass layoff is defined as a layoff that lasts for six months or longer and affects 500 or more employees. For businesses with employment losses of between 50 and 499 employees, the relevant threshold for a notice requirement is 33 percent of the workforce or more. The penalty for noncompliance can be severe: The employer is liable to each aggrieved employee for an amount including back pay and benefits for the period of violation, up to 60 days. In addition, the employer is subject to a civil penalty of at most $500 per day.
The WARN Act went into effect on February 4, 1989. Since then, states have maintained records of the WARN notices that have been filed with their dislocated worker units. We have collected these records by visiting and scraping state websites, contacting state officials, and retrieving historical data. The records typically include the following information: the name and address of the employer; the date the notice was filed; the anticipated layoff date; and the estimated number of affected workers.
We have aggregated the data so that for each month since January 1990, we observe the number of workers affected by WARN notices at the state level. The data are “unbalanced,” in the sense that the number of states in our sample changes over time.5 In particular, in January 1990 we have WARN information only from the state of Michigan in our sample, by January 2000 we have data from 14 states, by January 2010 we have 27 states, and by January 2019 we have 32 states. As of the end of November 2019, our data set has about 55,000 WARN notices affecting more than 6 million workers. The 32 states included toward the end of the sample period are large and represent the national-level labor conditions well. For example, these states cover roughly 90 percent of national initial UI claims. Hence, we can aggregate the WARN data from these states to produce a nationally representative WARN indicator. We seasonally adjust the state-level data using the Census Bureau’s X-12-ARIMA process.
How Much Advance Notice Do Employers Give?
These WARN data will be useful for assessing current and future labor market conditions only if employers give their workers sufficient advance layoff notice. Before we aggregate these state-level data to a national indicator, we investigate how much advance notice employers give their workers. To assess the amount of advance notice, we use the number of days between the date a notice was filed and the anticipated layoff date for each WARN notification. Figure 1 summarizes this information by showing the fraction of WARN notices by the number of days of advance notice.
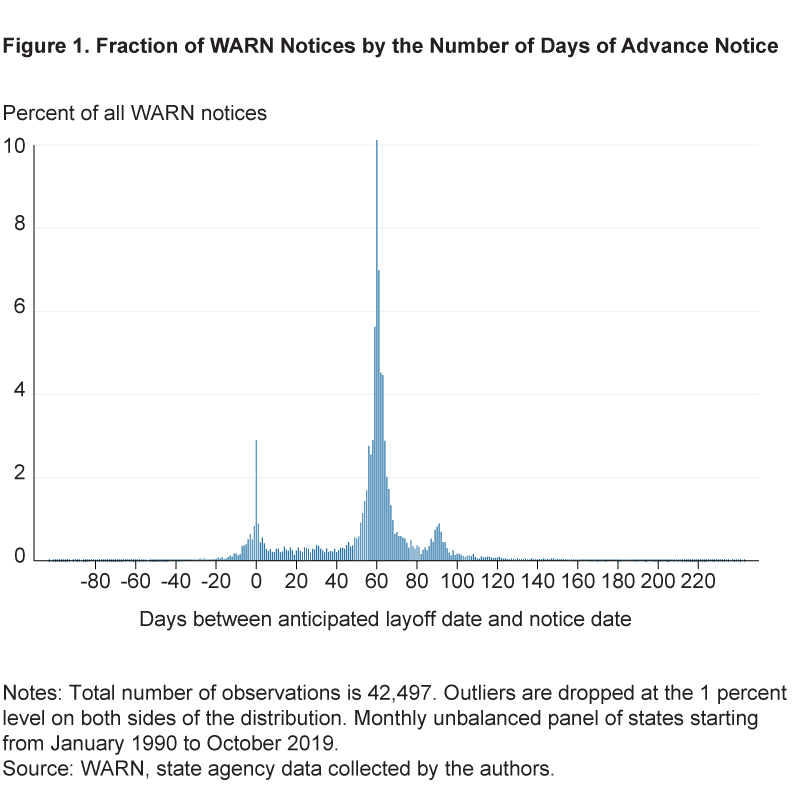
The figure has three features that suggest that WARN notices provide substantial advance layoff notice, largely consistent with the structure of the WARN Act. First, there is a large spike at 60 days. This is not surprising since the law mandates that employers give their workers 60 days’ advance notice. Second, most notices are filed 40 to 80 days (one to three months) prior to the anticipated layoff date. Third, there is another large increase in the fraction of issued WARN notices around 90 days of notice. This is because New York is one of a few (but large) states that deviate from the federal mandate of 60 days’ advance notice and, as of February 2009, requires employers in the state to give their workers 90 days’ advance notice. There is also a spike at 0 days, which seems to represent employers that file the WARN notice the same day they start laying off some of their workers.
A National WARN Indicator
To assess whether WARN notices contain information about the national labor market, we must aggregate the state-level information into a national WARN indicator. However, we cannot simply sum up the number of workers affected by WARN notices across all states for two reasons. First, as mentioned before, WARN information is available for some states earlier than others. Second, states release their WARN data on different schedules.6 Because we want WARN notice data to be a useful real-time indicator, we cannot wait for all states to release their data for a given month. To address these issues, we use a statistical tool called a dynamic factor model. This statistical tool allows us to estimate a common national “WARN factor” for each month, even if we do not have data from every state in that month. We use this WARN factor as our national-level aggregate of the state-level data.
Intuitively, the national WARN factor follows common movements in the state-level data. When the number of workers affected by WARN notices increases across many states at the same time, then the WARN factor increases, and when the number of WARN-affected workers decreases, the WARN factor decreases. If we do not have data for a state in a particular month, then we can use the common movements from other states to estimate the WARN factor. The dynamic factor model allows us to estimate the WARN factor back to July 1996.7
Formally, we use the estimation procedure in Shumway and Stoffer (1982) and Bańbura and Modugno (2014) and we normalize the factor to have mean zero and unit standard deviation. Important caveats of our approach include the use of a two-sided smoother, which uses some future information when estimating the WARN factor in a given month, and current-vintage data. This implies that our results are best viewed as suggestive, in-sample evidence that our WARN factor is useful for indicating impending movements in national UI claims, employment, and the unemployment rate.
We plot our national WARN factor in figure 2. Along with it we plot two commonly used labor market indicators, seasonally adjusted initial UI claims and the 3-month-moving-average of changes in the national unemployment rate, to see how well the WARN factor moves with them. We use the 3-month-moving-average because month-to-month movements in the national unemployment rate are noisy.
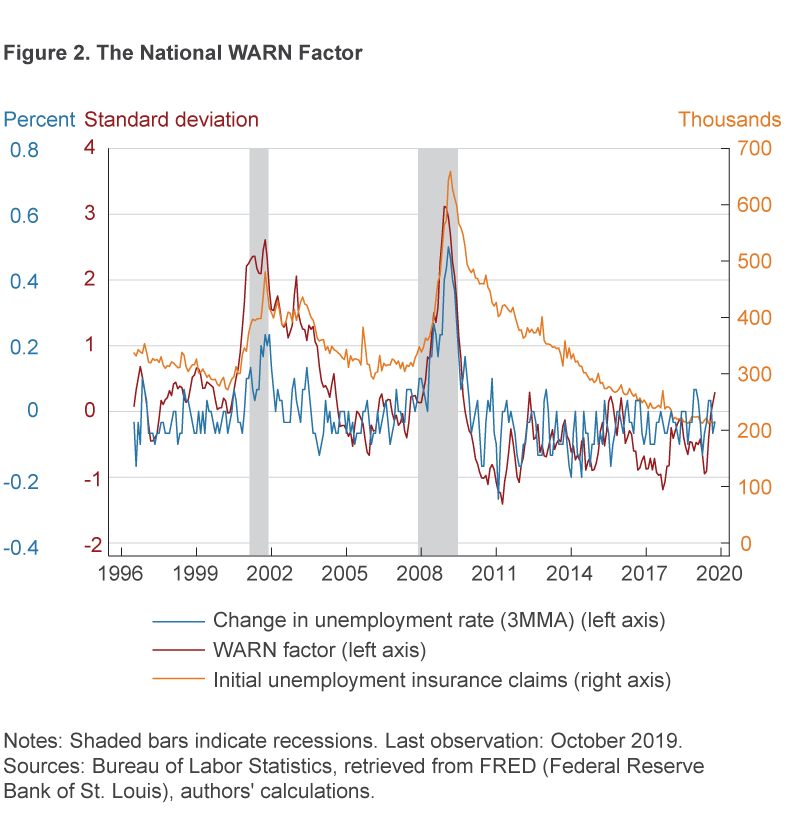
Figure 2 highlights that the WARN factor seems to be coincident with or leading initial UI claims and changes in the unemployment rate. One noteworthy example is that the WARN factor turned and began to improve one month before initial UI claims and the change in the unemployment rate began to fall at the trough of theGreat Recession.
Figure 2 also suggests several ways in which the WARN factor has successfully captured the state of the labor market in the past. First, the WARN factor rises around recessions, falls during the initial parts of expansions, and is relatively flat during later parts of expansions. Second, according to the WARN factor, the labor market deteriorated more quickly during the Great Recession than during the 2001 recession, which accords with sharper increases in initial UI claims and the national unemployment rate in the Great Recession than in 2001. Third, the WARN factor has few false positives for detecting recessions: Although the measure has some underlying noise, when it rises by one standard deviation or more, it is an indication of increasing slack in the labor market.
More recently the WARN factor has risen somewhat and is slightly above its historical average. This increase suggests a slight increase in labor market slack and is consistent with recent Institute for Supply Management (ISM) reports, which indicate employment is contracting in the manufacturing sector.8
The WARN Factor as a Labor Market Indicator
To formalize the in-sample lead relationship of the WARN factor for other labor market indicators, we perform a statistical analysis. The basic idea of the analysis is to see whether our national WARN factor leads other labor market variables, after controlling for the influence of the lags of these other variables. The labor market indicators we focus on are seasonally adjusted (monthly) initial UI claims, the change in the unemployment rate, and the change in private employment. The latter two series tend to be noisy, so we focus on the 3-month-forward average.9 Details of our empirical specification appear in the online appendix.
Table 1 presents the results of our statistical analysis.10 The first column of the table suggests that if the WARN factor rises by one standard deviation this month, then initial UI claims are likely to rise by about 14,000 the next month. Although the first lag of the WARN factor is different from zero in a statistical sense, its magnitude is economically small given that initial claims have been about 200,000 recently.
|
|
(1) ui claimst | (2) ΔUt | (3) ΔEt |
|---|---|---|---|
| WARNt−1 | 14,326** (6,061) |
0.07** (0.03) |
–105,999*** (38,349) |
| WARNt−2 | –2,518 (9,748) |
–0.05 (0.04) |
42,949 (51,188) |
| WARNt−3 | –9,467 (6,343) |
–0.004 (0.03) |
42,980 (33,966) |
| p-value of WARNt−i= 0 | 0.004 | 0.046 | 0.005 |
| Observations | 277 | 275 | 275 |
***p<0.01, **p<0.05, *p<0.1.
Notes: All three estimating equations include three lags of initial unemployment insurance (UI) claims, changes in the unemployment rate, and changes in private employment growth. Newey and West (1987) standard errors (3 lags) are in parentheses. Standard errors take into account that the factor is a generated regressor. There are 280 months between July 1996 and October 2019, and we lose three observations at the beginning of the sample because we include three lags in columns (1) through (3), and we lose another two observations in columns (2) and (3) because we use the 3-month-forward average of ΔUt and ΔEt.
[Correction: On 12/20/2019, in column (2), the WARNt−3 value was changed from –0.04.]
The second column of the table suggests that a one-standard deviation increase in the WARN factor this month is typically followed by an increase in the average change of the national unemployment rate over the next three months of about 0.07 percentage points (pp). Changes in the 3-month moving average of the unemployment rate have been under ±0.1 pp recently and were only as large as +0.5 pp during the depth of the Great Recession, so this is an economically meaningful magnitude.
The third column of table 1 suggests that if the WARN factor rises by one standard deviation this month, then the average change in private employment will fall by about 100,000 over the next three months. Since the 3-month moving average of private employment growth has been less than +200,000 recently, this is an economically meaningful magnitude. Statistical tests suggest that there is only a very small likelihood that the WARN factor is uninformative for future movements of the three labor market indicators that we feature.
Conclusions
In this Commentary, we use advance layoff notices filed in compliance with the WARN Act as another labor market indicator. We find that these layoff notices, typically issued about 60 days before the anticipated layoff event, contain information about national labor market conditions at the time of notice. We also find some in-sample evidence that they lead other pertinent labor market indicators, such as initial UI claims, changes in the unemployment rate, and changes in private employment. The lead relationship is strongest at one month.
We emphasize that our present results use current-vintage data and our national WARN indicator is estimated using some future information, so our results cannot be treated as an out-of-sample forecasting exercise. Nevertheless, given our promising in-sample evidence, we think that these data may be useful to policymakers and labor market analysts as they judge the current state of the labor market and its possible future direction. Our next step is to perform a careful out-of-sample forecasting exercise to see whether our national WARN indicator can help improve on existing forecasts of relevant labor market data.
Footnotes
- For information about Ohio’s Rapid Response program, see https://jfs.ohio.gov/owd/WorkforceProf/RapidResponse-home.stm.Return
- Initial UI claims in Ohio rose sharply by about 2,000 in the week ending January 28, 2017, and about 1,500 in the week ending June 30, 2018, and these increases were almost certainly related to Lordstown’s elimination of its third and second shifts, respectively. These shift eliminations actually occurred on January 20, 2017, and June 23, 2018. The WARN notices for these eliminations were filed about two months before the anticipated layoffs.Return
- The idea for this project grew out of early conversations with Andrew Foote.Return
- Please see https://www.doleta.gov/layoff/docs/WorkerWARN2003.pdf for more details about the WARN Act.Return
- Data retention policies vary from state to state, so we are unable to collect historical data for some states. For no state do we have WARN notice data back to February 1989, when the WARN Act took effect.Return
- Following terminology from the nowcasting literature, we have a “jagged edge problem” where the real-time data flow is not synchronized, so that some data are available sooner than other data (Bańbura et al., 2013). In practice, we stop counting the number of workers affected by WARN notices in a given state and a given month when we observe a WARN notice for that state in a subsequent month. For some smaller states, this means that we may not have a measure of workers affected by WARN notices in a given month until several months later when a subsequent WARN notice is filed. In this situation, we treat the most recent data for these states as unavailable.Return
- Our sample includes five states in July 1996 (Michigan, North Carolina, Ohio, Virginia, and Wisconsin), and we think that WARN notices in these states contain sufficient information to inform the estimate of the national WARN factor. For example, during 2018, WARN notices in these five states accounted for about 20 percent of all WARN-affected workers in our sample. This starting date also gives us some estimates of the factor before the start of a recession in March 2001. If we choose a later starting date for our analysis, our results are little changed.Return
- The ISM manufacturing employment index has been below 50 from August 2019 to November 2019. This reading indicates that manufacturing employment has been contracting.Return
- The results are similar if we use the monthly changes without averaging.Return
- The standard errors in table 1 are adjusted for the WARN factor being a generated regressor. This adjustment follows the spirit of Murphy and Topel (1985). We use a parametric bootstrap to produce the mean squared errors for the factor as in Pfeffermann and Tiller (2005) when making the generated regressor adjustment.Return
References
- Bańbura, Marta, Domenico Giannone, Michele Modugno, and Lucrezia Reichlin. 2013. “Now-Casting and the Real-Time Data Flow.” Handbook of Economic Forecasting. Volume 2, Part A: 195–237.
- Bańbura, Marta, and Michele Modugno. 2014. “Maximum Likelihood of Factor Models on Datasets with Arbitrary Pattern of Missing Data.” Journal of Applied Econometrics, 29(1): 133–160.
- Murphy, Kevin M., and Robert H. Topel. 1985. “Estimation and Inference in Two-Step Econometric Models.” Journal of Business & Economic Statistics, 3(4): 88–97.
- Newey, Whitney K., and Kenneth D. West. 1987. “A Simple, Positive Semi-Definite, Heteroskedasticity and Autocorrelation Consistent Covariance Matrix.” Econometrica, 55(3): 703–708.
- Pfeffermann, Danny, and Richard Tiller. 2005. “Bootstrap Approximation to Prediction MSE for State-Space Models with Estimated Parameters.” Journal of Time Series Analysis, 26(6): 893–916.
- Shumway, Robert H., and David S. Stoffer. 1982. “An Approach to Time Series Smoothing and Forecasting Using the EM Algorithm.” Journal of Times Series Analysis, 3(4): 253–264.
Suggested Citation
Lunsford, Kurt G., Pawel M. Krolikowski, and Meifeng Yang. 2019. “Using Advance Layoff Notices as a Labor Market Indicator.” Federal Reserve Bank of Cleveland, Economic Commentary 2019-21. https://doi.org/10.26509/frbc-ec-201921
This work by Federal Reserve Bank of Cleveland is licensed under Creative Commons Attribution-NonCommercial 4.0 International

