

- Share
PPP Loans & State-level Employment Growth
The views authors express in Economic Commentary are theirs and not necessarily those of the Federal Reserve Bank of Cleveland or the Board of Governors of the Federal Reserve System. The series editor is Tasia Hane. This paper and its data are subject to revision; please visit clevelandfed.org for updates.
The SARS-CoV-2 (COVID-19) pandemic and the mitigation efforts instituted by state and local governments slowed economic activity drastically in spring 2020. Unlike in a typical recession, social distancing measures and widespread shutdowns forced many businesses to cease activity without officially going out of business. This unique situation motivated policymakers to institute a large-scale employment subsidy program, the Paycheck Protection Program (PPP), in the effort to save small businesses from going under. The United States Congress quickly passed the Coronavirus Aid, Relief, and Economic Security (CARES) Act and instituted the PPP geared toward small businesses to weather the adverse effects of the pandemic. The PPP was the largest spending item in the CARES Act and was in effect between March 27 and August 8 in 2020. The program was later reinstated on January 11, 2021, with new funding through the Consolidated Appropriations Act, 2021, which was, after an extension, active until the end of June 2021.1
In this Economic Commentary, we focus on the first round of PPP loans granted beginning in March 2020 until early August 2020, when turbulence in the labor market was pronounced, in order to demonstrate its effects on local labor markets.2 The PPP was designed to “provide small businesses with the resources they need to maintain their payroll, hire back employees who may have been laid off, and cover applicable overhead.”3 Given these stated intentions, the main question we address is whether PPP loans supported employment during this period. We conduct an analysis using comparisons of employment and PPP loans across states. We rely on the aggregate impact of the loans at the state level to address this question because though we now have information on the loans made to individual businesses, corresponding data on employment levels for individual businesses are not available.
Previous research suggests that employment subsidies in the wake of a serious recession could have more long-lasting positive effects on employment than would alternative policies that provide hiring subsidies and payroll tax deductions, albeit at a higher fiscal cost (Kitao, Sahin, and Song, 2010). PPP loans act as inexpensive employment subsidies, from the government and facilitated by lenders, to individual businesses since these loans are, in principle, forgivable. To date, about 89 percent of all loans and 91 percent of the total PPP loan value from 2020 has been forgiven in full or in part.4
We find that PPP loans helped mitigate the negative impact of the pandemic-related recession on state-level employment growth. This effect was more pronounced during the initial stage of the pandemic in the United States, when uncertainty surrounding the pandemic and its effects prevailed and unemployment rates peaked across the country through April 2020. The positive effect becomes less significant during the early part of the recovery starting in May and ending with the expiration of the PPP in August 2020. Overall, our analysis suggests that one additional week of payroll support in the form of PPP loans during this initial distribution period would have mitigated the state-level employment decline by between around 1.5 percentage points to 2.3 percentage points. Moreover, conditional on receiving the same amount of PPP loans over the entire period, states whose small businesses received the bulk of their overall PPP loans early on had much smaller net employment declines over the entire period, from February to August, than did states that received the bulk of their PPP loans later in the period. Overall, our results indicate that the PPP had significant benefits. But it remains for future research to compare these benefits to the costs of the program and the efficacy of possible alternatives.
Data on PPP loans and labor market outcomes
We aggregate individual loans from the PPP data at the state level and focus on two distinct episodes over the course of the first round of the PPP applications based on the evolution of the pandemic and labor markets.5 The first episode covers the period just before the pandemic in the United States through its earliest months, from February 2020 through April 2020, when the unemployment rate peaked nationally. This episode essentially covers the initial shock to the US economy and labor markets in general.6 The second episode covers the period that immediately follows and ends by August 2020, when the first-round PPP expired.7 We interpret this episode as the initial labor market recovery. As a result, we have two measures of PPP utilization for each state, one during the COVID-19 shock and one during the recovery period.
It is, however, hard to interpret the amount of total PPP loans at the state level on its own. Larger states or states with small businesses that on average have higher revenue streams could have applied for and received larger amounts of PPP loans irrespective of how severely they were affected by the pandemic. The level of the PPP loans is particularly uninformative because of the legislative design of the PPP. Since businesses could apply for loans that amount to between 10 and 11 weeks’ worth8 of their average payroll expenses, states with larger populations will appear in our data with larger total loan amounts distributed. By the same token, the small-business sector in two similarly sized states, say, Maryland and Missouri, might incur different payroll costs because of geographical differences in wages and benefits.9 To alleviate this anomaly, we normalize the total PPP loan amount in a state with the total weekly payroll of the small-business sector in that state. For instance, if all the small businesses in a state apply for PPP loans and obtain the maximum eligible amount, the state-level measure of the PPP loan will be slightly more than 10, that is, somewhat greater than 10 weeks of average payroll costs in a reference year. In our case, the reference year will be 2018, which is the year for which we have the most recent data from the Census Bureau’s Statistics of US Businesses (SUSB) to identify a measure of total payrolls for firms with fewer than 500 employees.10
Based on this normalization, our data indicate that states and the District of Columbia (DC) obtained PPP loans totaling somewhere between 6 weeks (District of Columbia) to 11.3 weeks (Hawaii) of their 2018 average payroll costs.11 The second lowest amount in the sample is 8.5 weeks for Massachusetts. It appears that most of the states received loans equivalent to 85 percent to 115 percent of 10 weeks of their 2018 payroll averages. This result echoes Schweitzer and Borawski’s (2021a) analysis at the industry level.
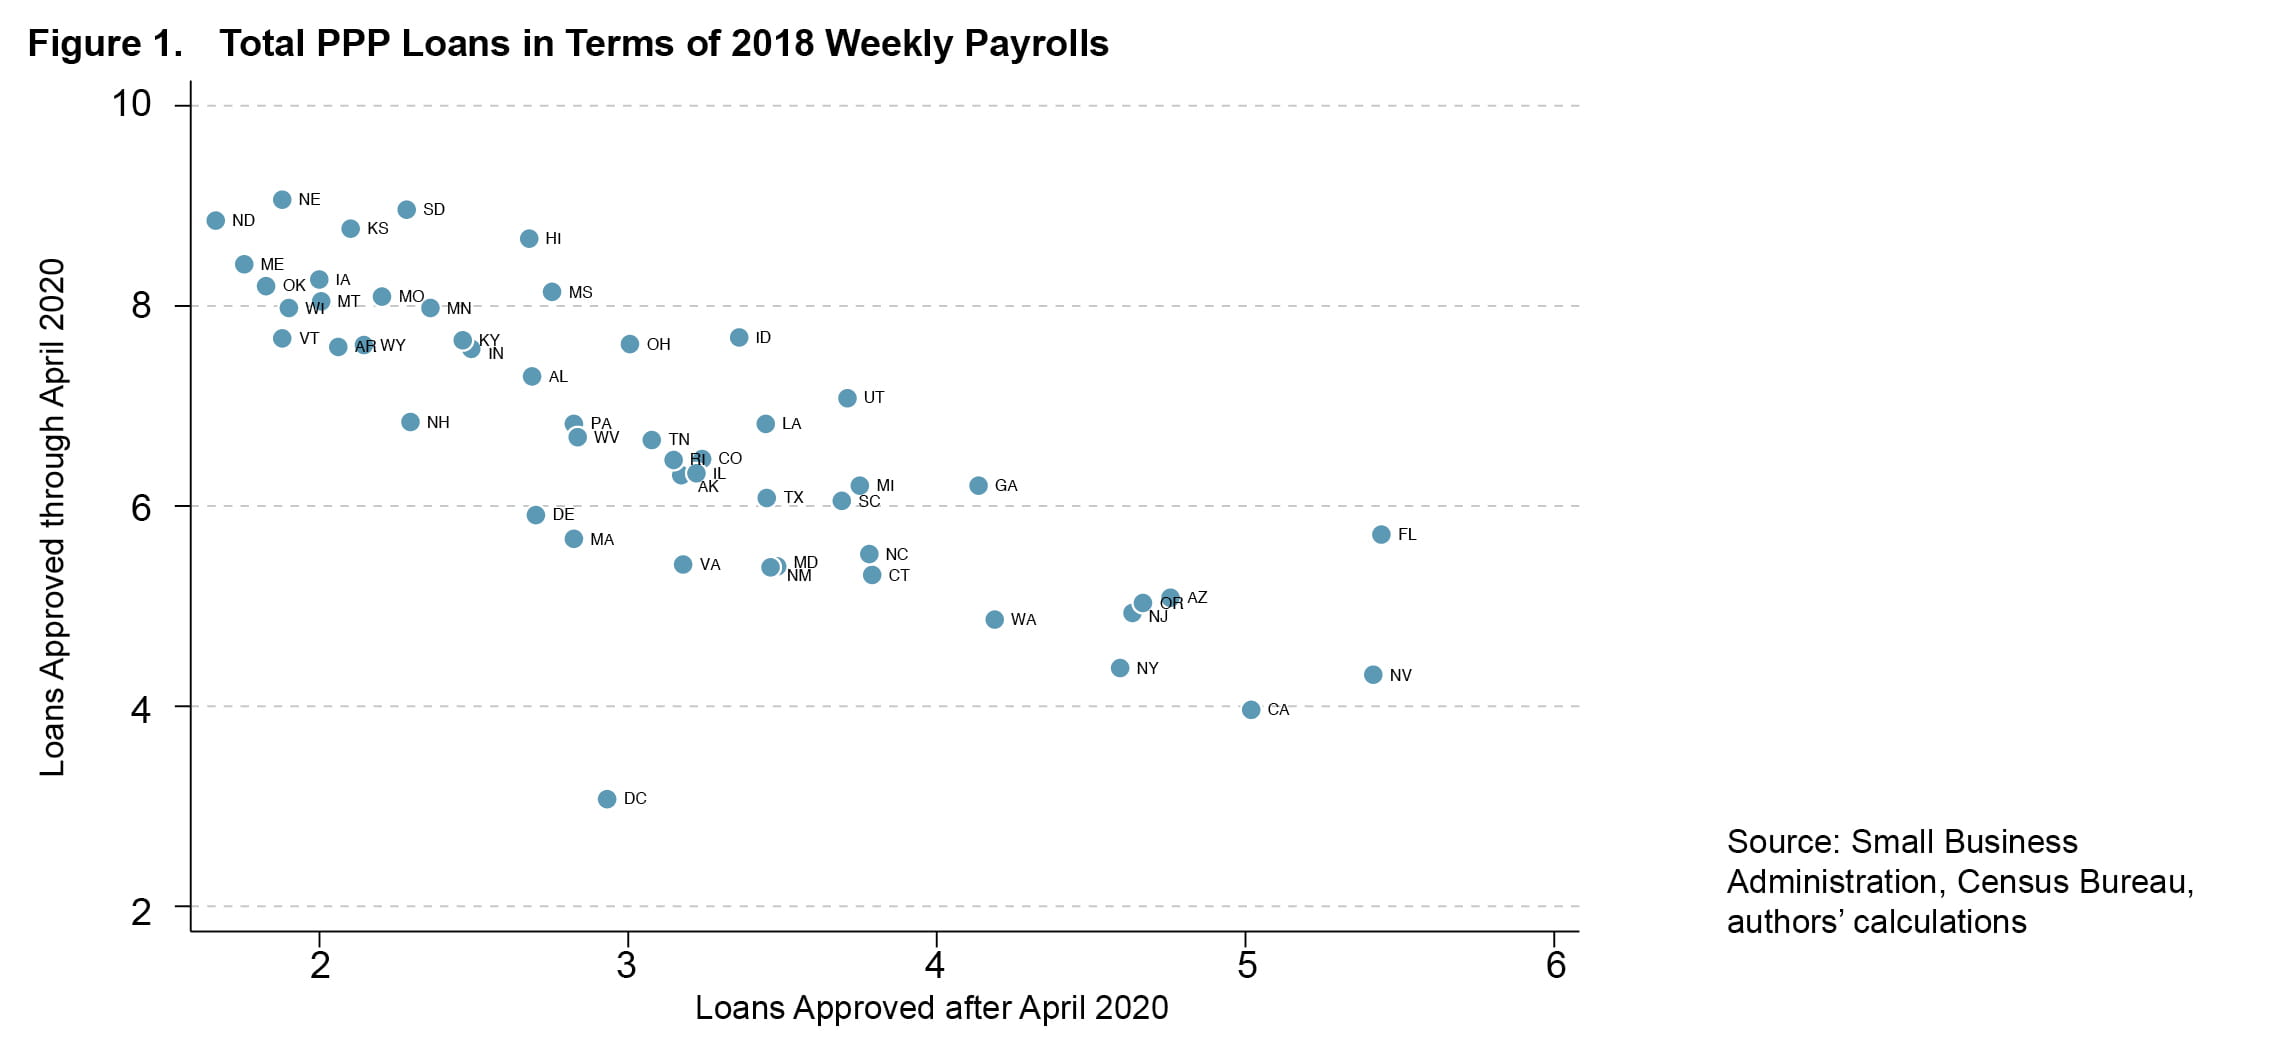
Figure 1 shows for each state and DC how the composition of the total PPP loans was distributed over time. States that received large shares of PPP loans as a fraction of 2018 payrolls through April 2020 received smaller loans during the second phase after April. For most locations, when adding up the weeks of loans in the two phases, PPP borrowing was about 10 weeks of 2018 payrolls. That is, most firms maxed out their PPP borrowing. Two more patterns also emerge from this picture. First, most of the locations that received a larger share of their total PPP loans during the first wave were relatively small states.12 Interestingly, three large states by population received the larger share of their loans or received more than 5 weeks of 2018 payroll averages during the recovery period.13
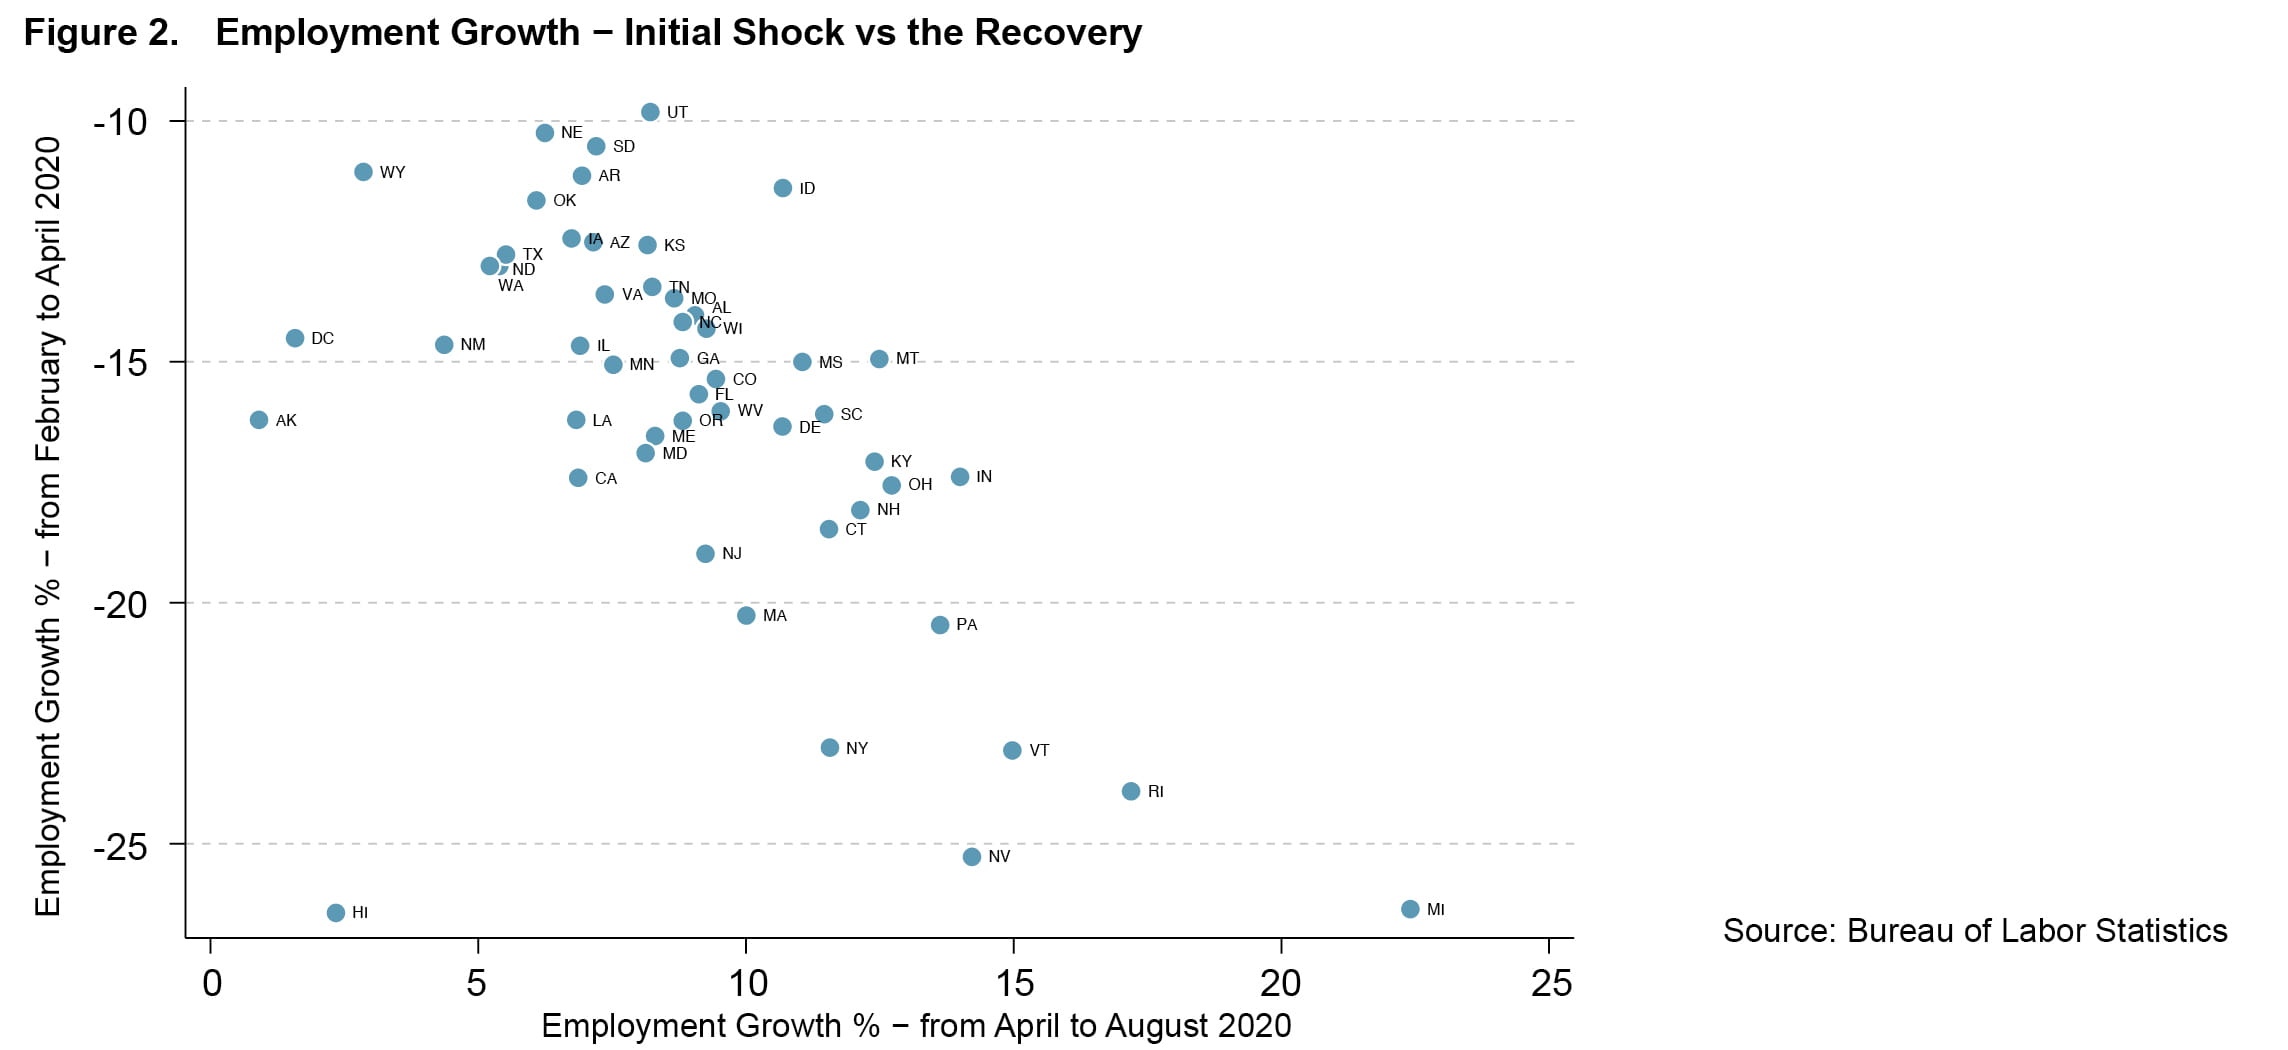
In order to evaluate the effects of the PPP loans on labor market outcomes, we focus on payroll employment at the state level in the private sector.14 As we did with the total PPP loans, we compute employment growth rates in two distinct periods: first from February to April 2020 and second from April to August 2020. The first measure gauges the severity of the labor market shock, and the second quantifies the strength of the early recovery. Based on previous research, one would expect to see that states with larger employment declines at the onset of the pandemic recession would bounce back stronger during the recovery episode (Tasci and Zevanove, 2019). As Figure 2 shows, this was indeed the case. States that faced larger drops in employment early on later experienced stronger growth in employment in the early phase of the recovery. Nevertheless, none of the states or DC recovered fully by August 2020 from the steep employment losses experienced in the initial shock. Data presented in Figures 1 and 2 cover all 50 states and DC. However, for the formal analysis in the rest of this Commentary, we omit from our sample data from Hawaii and DC, the two outliers.15
Did PPP loans lessen employment loss across states?
Our analysis suggests that the answer is yes, PPP loans did lessen employment loss across states. For a given loan amount, the effects of the PPP were strongest at the beginning of the recession; loans received earlier in the pandemic seem to have had a disproportionately larger positive effect on net employment loss at the state level. The prevalence of both high-contact-intensity (HCI) jobs and COVID-19 infections within a state negatively affected employment growth, especially early in the pandemic.
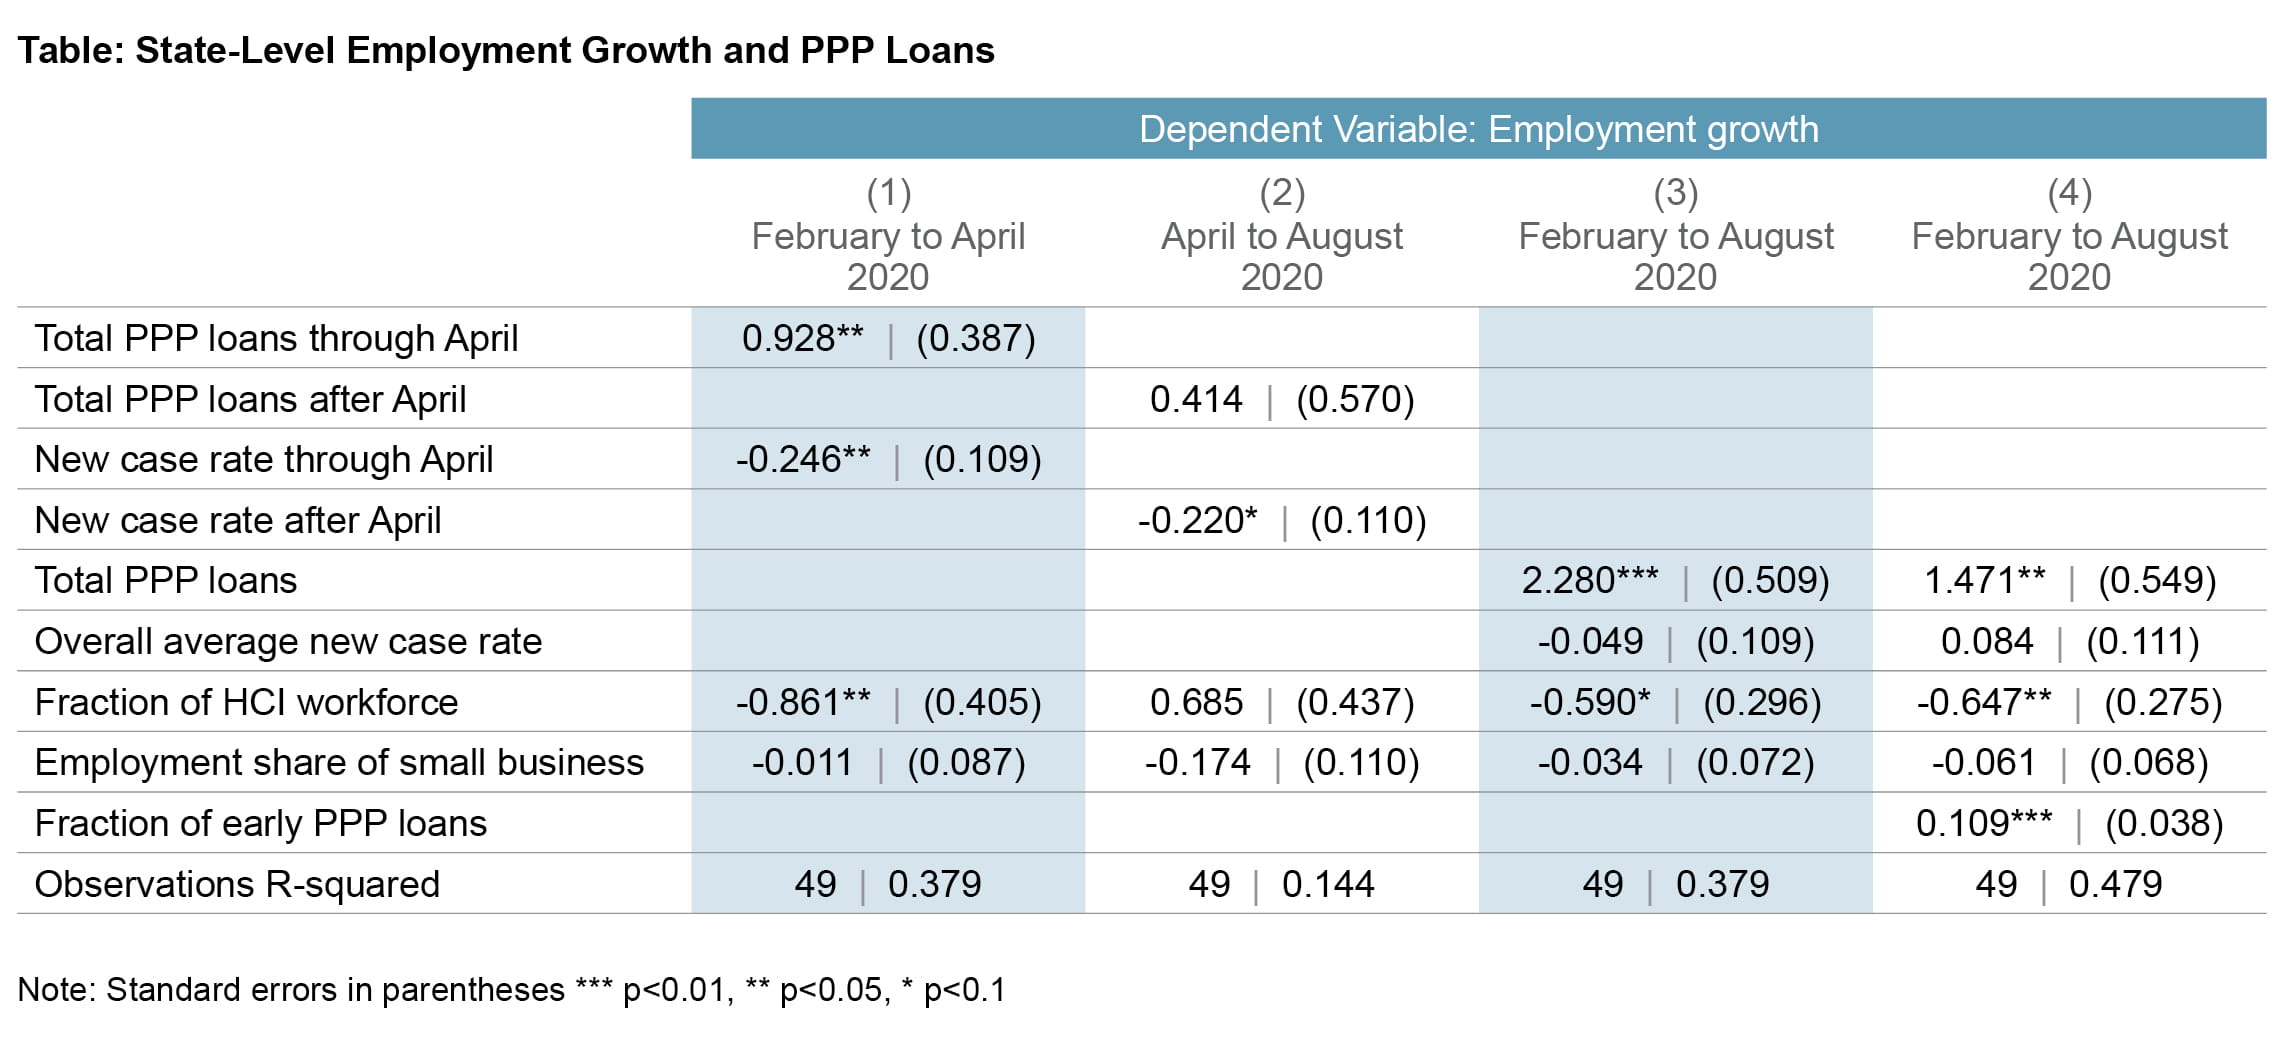
The CARES Act became law on March 27, 2020, and the US Department of the Treasury and the US Small Business Administration launched the PPP immediately. Private financial institutions accepted applications and administered the approval process. Despite the brief window between the launch of the program in late March and the significant contraction in total employment by April 2020, many states were able to obtain large sums during the first wave of lending. Figure 3 shows that there was quite a bit of variation on this dimension, represented on the x-axis by equivalent number of weeks of average 2018 payroll. There is a positive correlation between total PPP loans and employment growth in this first period. In other words, states that received larger PPP loans experienced smaller employment declines by April 2020, as represented on the y-axis.
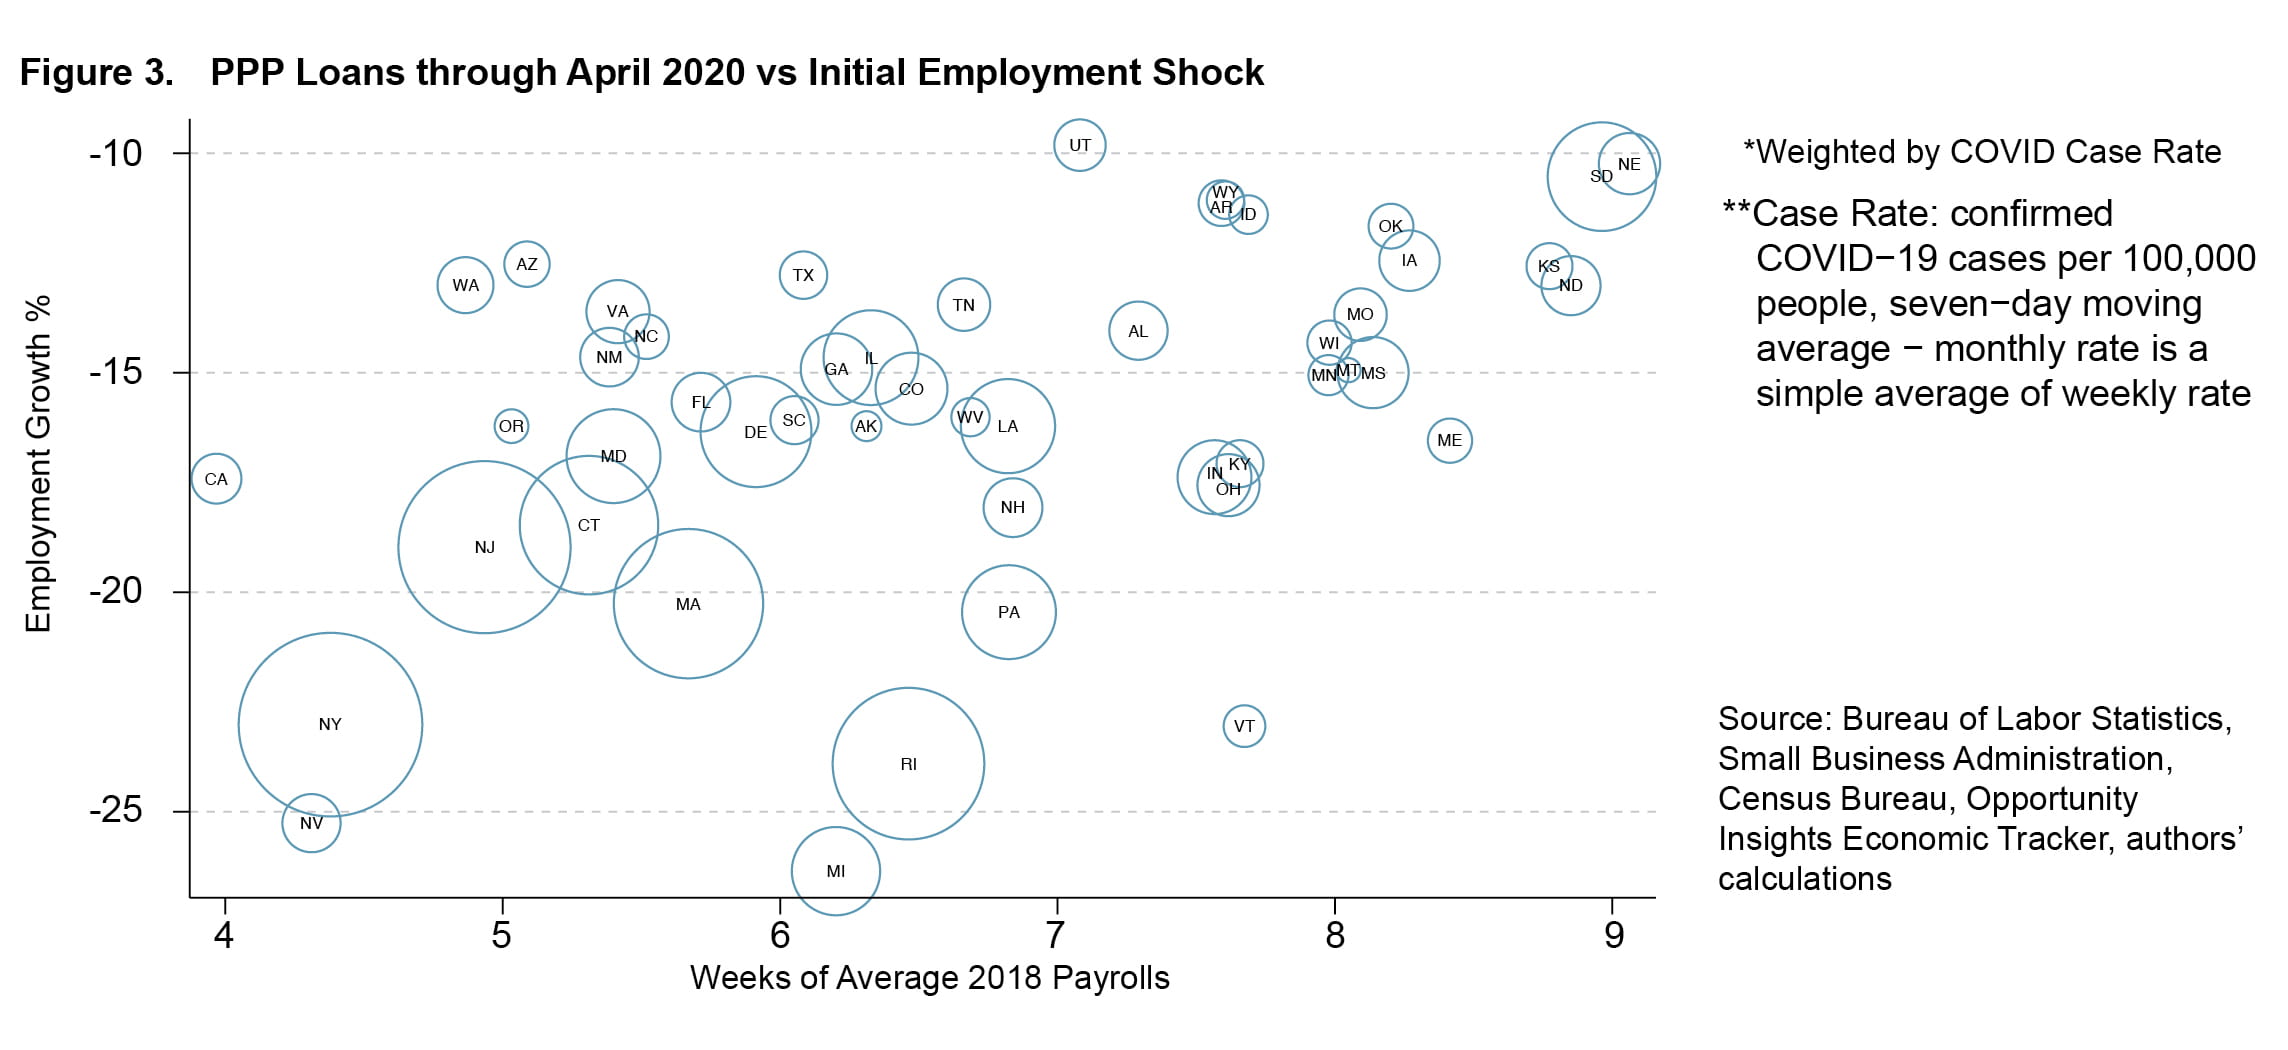
In Figure 3, each state is represented with a circle; the size of the circle reflects the average new case rate per day from February through April 2020.16 We use data on new case rates to control for the severity of the pandemic at the state level. It appears that most of the states with large outbreaks did in fact experience more employment contraction. This is expected as consumers and workers started to avoid their usual economic activities, either voluntarily or because of local government mandates and stay-at-home orders. It is also interesting to note that states that obtained larger PPP loans were not the areas hardest hit by COVID-19 during this first loan dispersal period. We formally test these correlations within a regression framework and control for additional covariates. Column 1 in the table shows that both the total PPP loan amount and the average number of new cases were significant variables correlated with payroll growth from February through April 2020. Our coefficient estimates suggest that one additional week of PPP loans mitigated the decline in employment by almost 1 percentage point (0.93), a number which is statistically significant and economically meaningful.17
We also control for some other observable features of the states to understand the evolution of employment within each state during the pandemic periods outlined. We know, for instance, the pandemic and related mitigation efforts disproportionately affected occupations and jobs that require high social contact with other individuals, such as grocery store clerks, hairstylists, servers, and so on. Hence, states with a larger share of employment in HCI jobs were expected to be especially vulnerable to employment loss.18 As column 1 of the table shows, we find a significant and negative relationship between employment growth during the early days of the pandemic and the share of employment in HCI occupations. The average state had about 21.7 percent of its workforce employed in HCI occupations. Based on our results, this implies that a state with a slightly larger employment share for HCI occupations, at 23 percent, would have suffered 1 percent more employment loss. Finally, we find no significant effect of a larger small-business sector in a state on the employment loss experienced at the onset of the pandemic recession.
PPP loans and the early labor market recovery until August 2020After the initial shock of the recession, labor markets started to recover, as demonstrated in the incoming data for May 2020, and they continued to do so at a varying pace for each state throughout August 2020. For instance, Wyoming and Alaska barely registered growth during this period, 0.9 percent and 2.8 percent, respectively, whereas Michigan witnessed a payroll growth above 20 percent from April to August. Of course, since the employment base in April was much lower than the level in February, even an otherwise incredible growth rate of 20 percent within a month was not enough to erase the pandemic-induced employment loss experienced earlier.
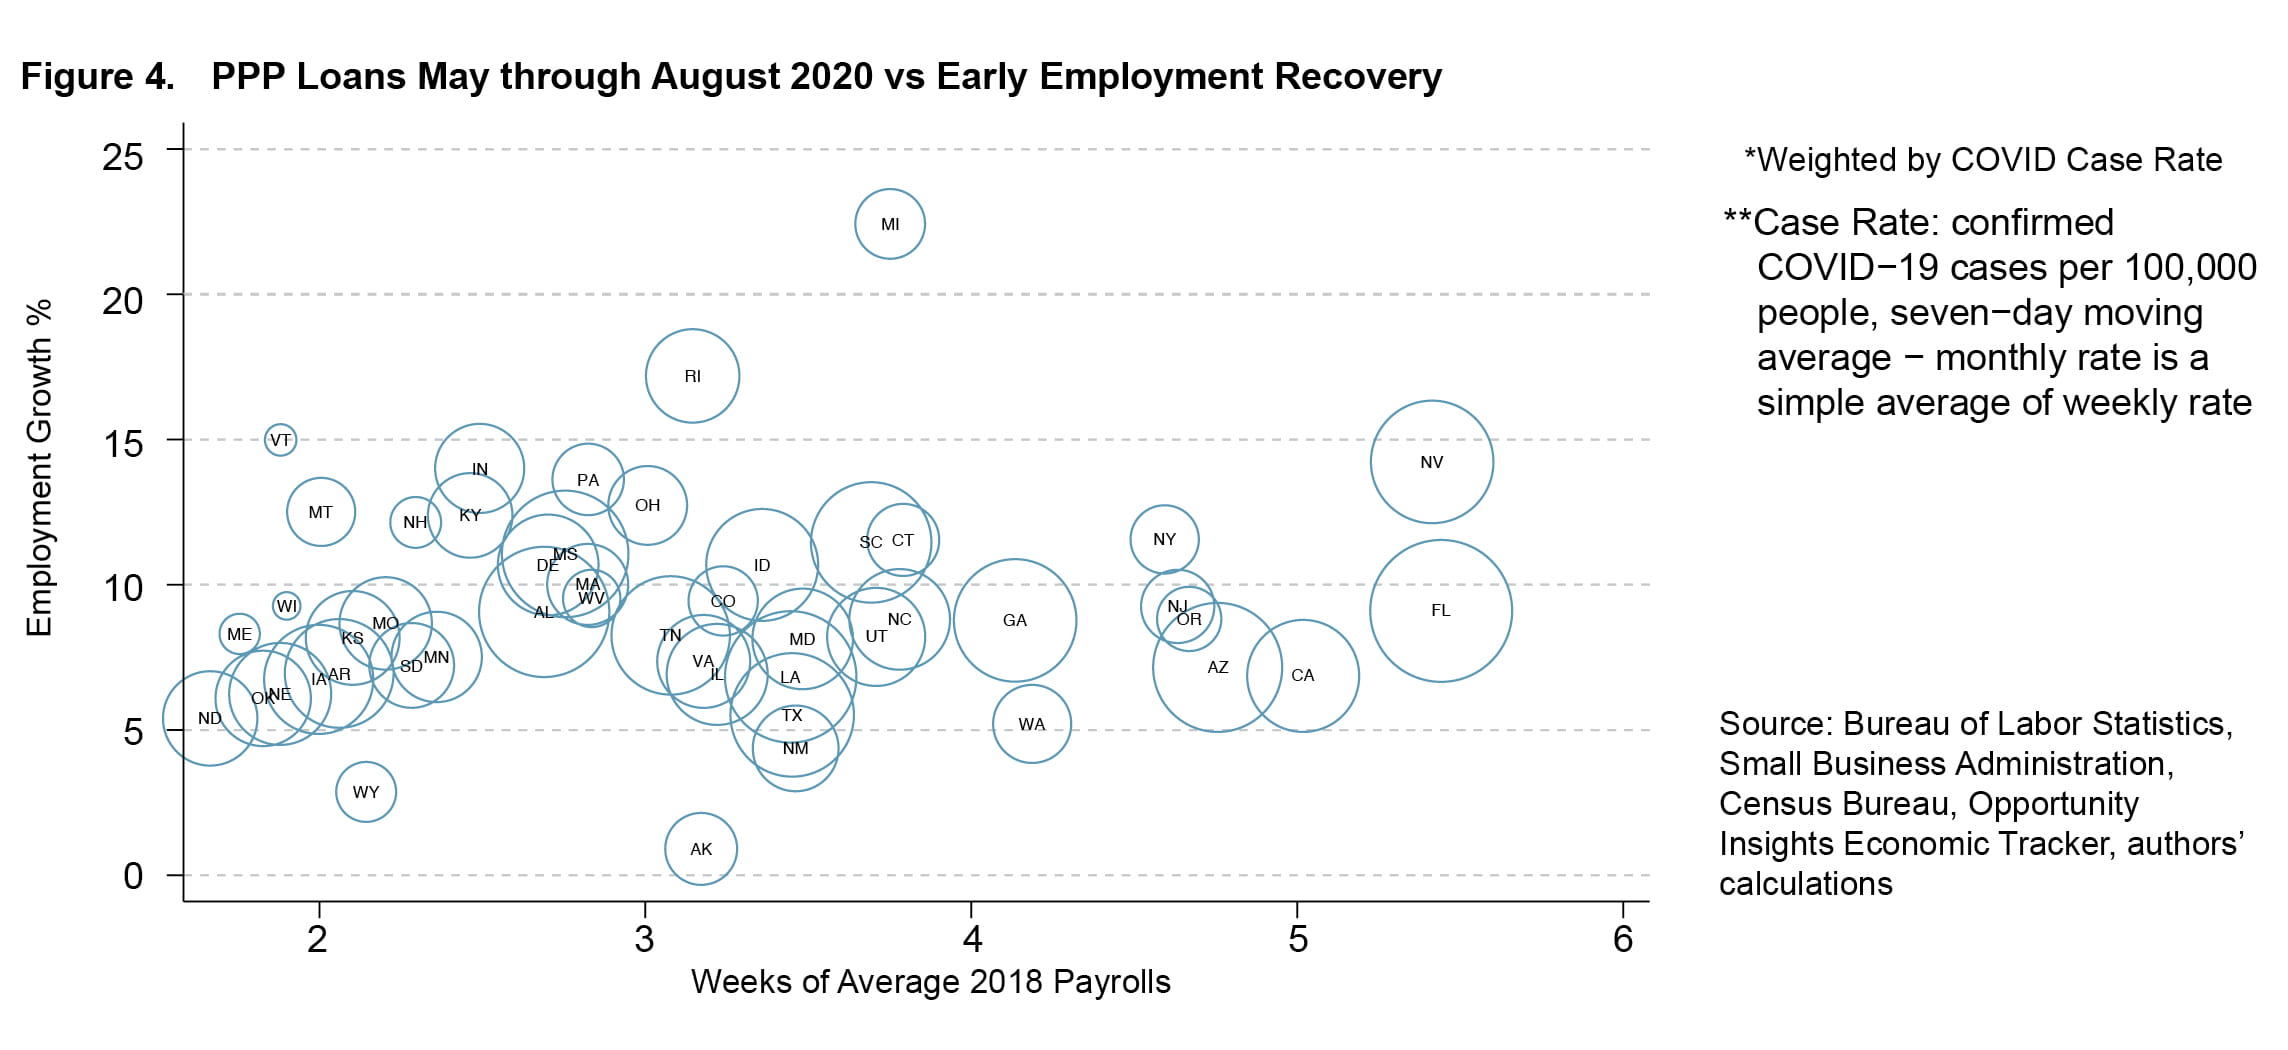
In Figure 4, we visually explore whether employment growth over this early recovery phase was correlated with PPP lending. Even though there seems to be significant variation in terms of PPP loan receipts and employment growth during this episode, the relationship of PPP loans to employment growth appears weaker in this period than in the early months of the pandemic. Column 2 in the table presents our results from the regression for this episode, results which confirm the visual observation and suggest that the correlation is not statistically significant. Thus, higher amounts of PPP loans were not associated with significantly larger employment rebound between April and August. This was a period when outbreaks affected multiple states over the course of the summer, and unlike in the early phase of the pandemic during which caseloads were driven by a handful of states, cases on average stayed relatively high across the country. We can observe this by comparing Figures 3 and 4 and the relative size of the circles for each state. As infections became more widespread geographically, the explanatory power of outbreaks declined during this period (May through August), though they are still statistically somewhat significant.
Other covariates such as the fraction of HCI jobs or the size of the small-business sector did not seem to matter much for explaining differences across states in terms of employment recovery during this period of the recovery. In all, our regression framework seems to provide a poor fit for this period. One potential explanation for this is the underlying heterogeneity in terms of mitigation measures and government policy at the state level. Unlike in the first phase up to April 2020, when the entire country was experiencing a lockdown of varying degrees, some states eased their coronavirus restrictions starting in early summer. In this analysis, we did not control for this as we could not find a clear summary measure describing the whole episode (May through August 2020) uniformly for each state.
PPP loans and net employment loss from February to August 2020Our study of the recessionary shock and the early recovery period in isolation suggests that, to assess the overall impact of PPP loans from 2020, we need to pay close attention to the early disbursement of loans at the onset of the recession. As small businesses were contemplating what to do in the face of a somewhat novel threat to their survival, having financial support readily available could have mitigated the negative impact of the shock. It is also important to keep in mind that for each individual eligible business, a PPP loan had a maximum feasible limit of 2.5 months of average payroll costs. Thus, in our state-level analysis, there will be a very close relationship between the PPP loans from the two periods (loans received through April versus those obtained from May through August). For instance, Utah received PPP loans that were equivalent to 7 weeks of payrolls by the end of April 2020, a disbursement amount which meant that about 3 to 4 weeks of additional support could have been available for the reminder of the program. Indeed, as Figure 4 shows, Utah received an additional 3.7 weeks’ worth of PPP loans from May to August. Since total loan amounts across the two periods should be close to 10 weeks of the aggregate payroll, PPP loan amounts at the state level for the first period should predict the later amount obtained because of the limitations on the number of weeks of payroll costs available (see Figure 1).
Nevertheless, not all states obtained PPP loans that equal exactly 10 to 11 weeks of payrolls in the small-business sector, and there are several reasons for this. First, some small businesses by our definition (fewer than 500 employees) might have declined to apply for PPP loans. Second, those that applied could have requested loan amounts that were lower than the maximum for which they were eligible. Finally, our definition for the eligible group of establishments (based on size) misses other potential recipients. The CARES Act allowed some businesses larger than 500 employees, that is, larger than our cutoff, to apply for PPP loans if they satisfied certain criteria.19 In Figure 5, we see some clustering around 10 weeks, but there is still a lot of variation across states with respect to payroll equivalent.
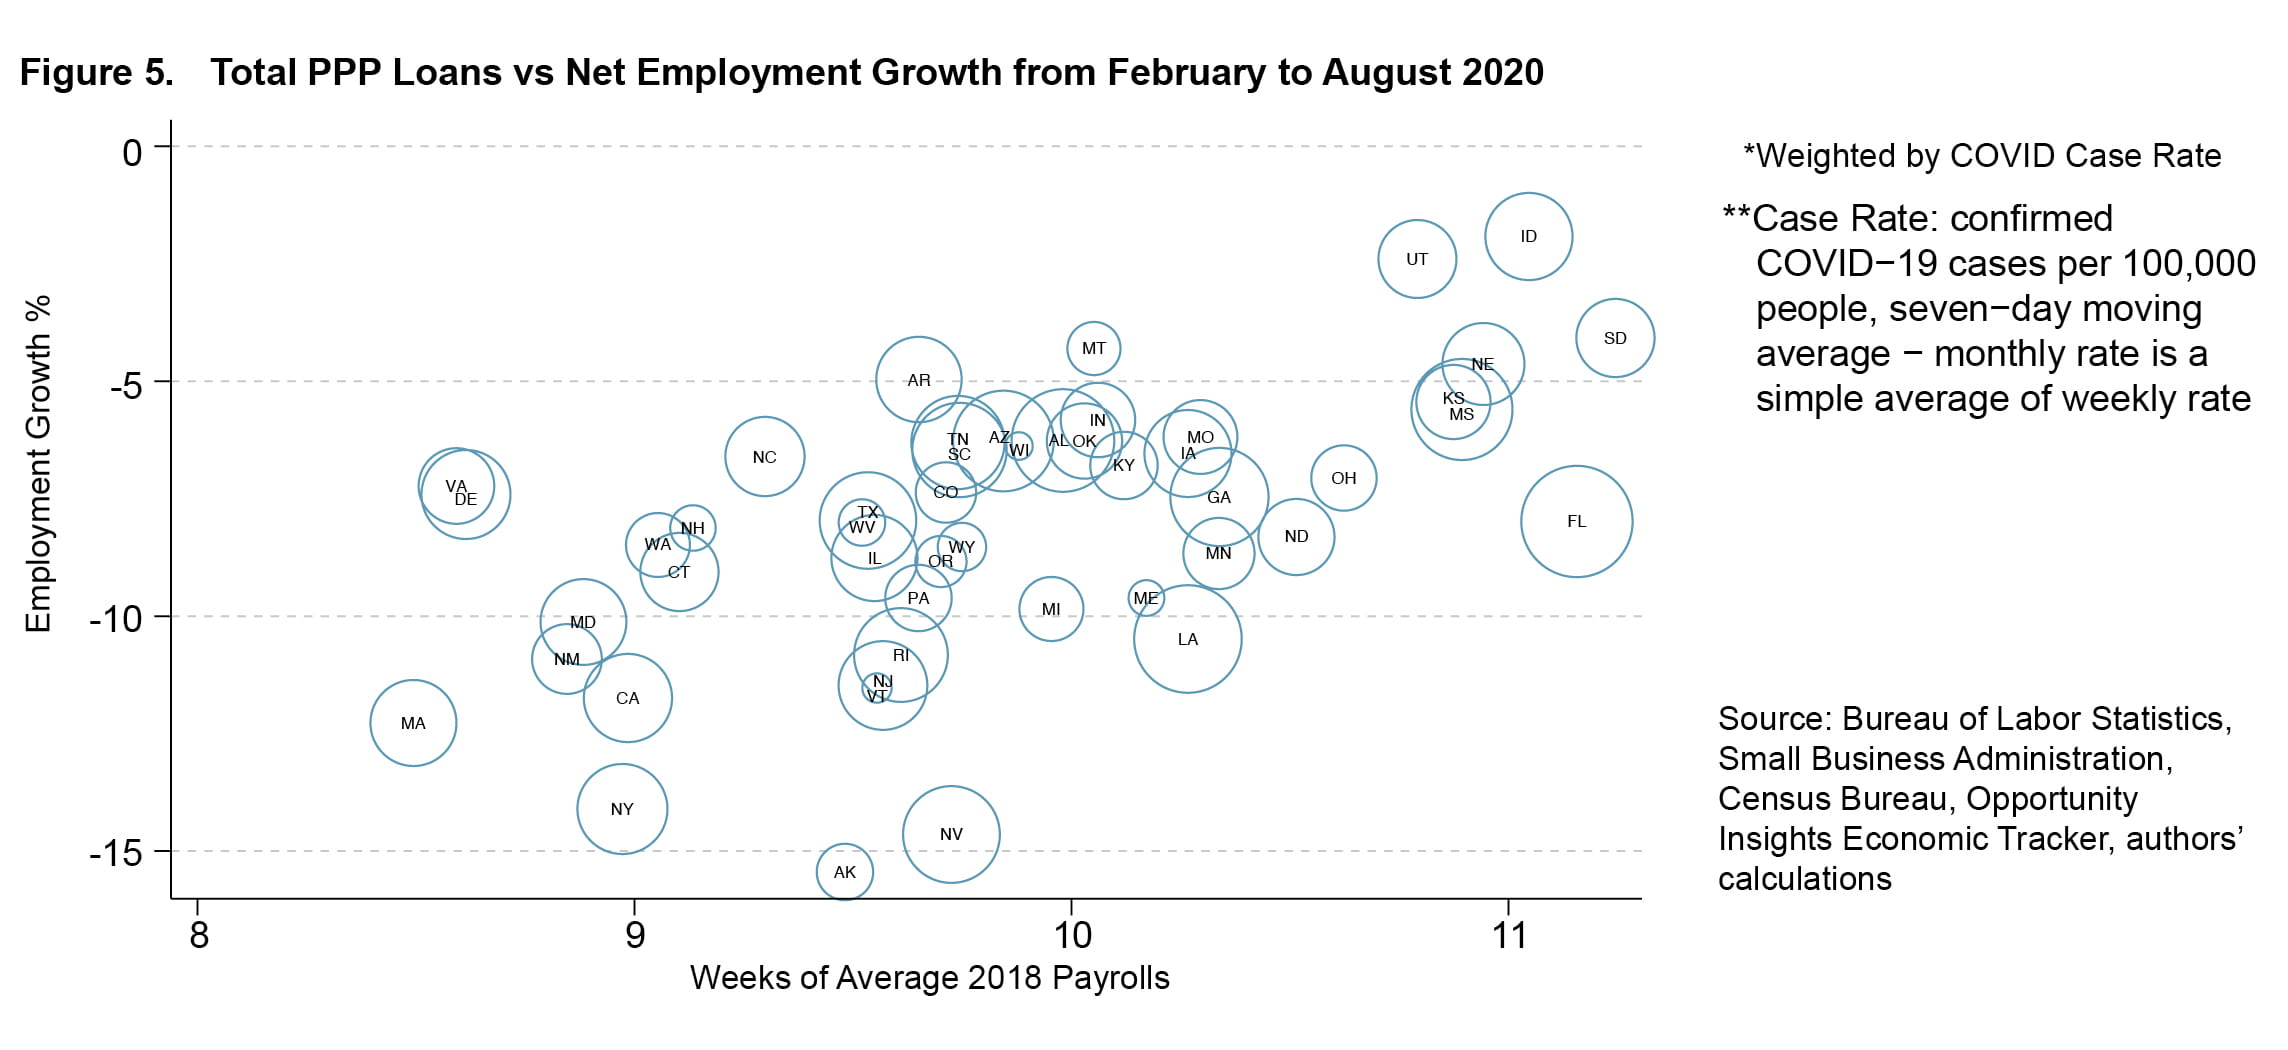
When we analyze the cumulative employment change from February to August, the significant correlation between PPP loan amounts and employment growth returns. As column 3 in the table shows, one additional week of PPP loans obtained throughout the whole period is associated with a statistically significant 2.3 percent increase in the net employment change over this period. The overall new case rate average over the sample period does not seem to be correlated with employment growth. To understand the role of PPP loans that states received before May 2020, we also look at an empirical specification in which we control for how much of the overall PPP loans a state received within that timeframe. As column 4 of the table indicates, even for states that received identical loan amounts, a state receiving a larger portion of the total amount earlier experienced smaller employment declines across the two periods together.
The average state in our sample received 68 percent of its total PPP loans during April 2020, with significant variation over this number across states. Consider two states, one of which at the end of April 2020 had received total PPP loans placing the state at the tenth percentile of states ranked in terms of available funding percentages received and another one at the ninetieth percentile. The former received 52 percent of its total loans in the early phase. The latter, however, obtained about 81 percent of its PPP loans at the beginning of the PPP. Even if both states had received PPP loans equivalent to 10 weeks of 2018 payroll over the course of the whole lending period, the latter would have suffered an employment loss that was 3.2 percentage points lower than the former, a number which is a meaningful and statistically significant difference.
Conclusion
The COVID-19 pandemic presented extraordinary challenges for the US labor market. These extraordinary challenges were met with a set of extraordinary responses by policymakers. In this Commentary, we analyzed the effect of timely distribution of Paycheck Protection Program loans and how such timing ultimately affected a state’s individual employment recovery. Our results suggest that loans provided under the PPP umbrella in fact mitigated the negative effects of the COVID-19-induced recession to some extent. State-level data suggest that PPP loans equivalent to an additional week of payroll kept the state-level employment declines lower by somewhere between 1.5 percentage points to 2.3 percentage points. Moreover, conditional on receiving the same amount, states that received the bulk of their overall PPP loans early on had much smaller net employment declines over the entire period, February through August 2020. More research is needed to understand the true economic mechanisms behind these results and how state-level pandemic restrictions played a role.
Footnotes
- The Paycheck Protection Program Extension Act of 2021 was signed into law by President Biden on March 26, 2021, extending the application period from March 31 to June 30, 2021. Return to 1
- This Commentary uses the total amount lent per state rather than the number of loans made in each state because we think the actual dollar amounts are, on the whole, more informative than the number of loans made to small businesses per state. Return to 2
- See Assistance for Small Businesses | U.S. Department of the Treasury. Return to 3
- See Forgiveness Platform Lender Submission Metrics, September 27 (sba.gov). Return to 4
- The loan level data we use come from SBA’s PPP data, geocoded and appended with ACS data as described in Schweitzer and Borawski (2021a and 2021b). Return to 5
- With the exception of seven states (CT, DE, MA, MN, NJ, NM, NY) all of the US states experienced their peak unemployment rates in April 2020 and labor market started recovering afterwards. Return to 6
- PPP applications resumed in January after the US Congress passed the fiscal package, Consolidated Approprations Act of 2021, in late December 2020 and added another $284 billion of funding. Return to 7
- To be precise, 2.5 times average monthly payroll, the measurement given, could correspond to a loan amount as large as 10.9 weeks of payrolls. Return to 8
- In this example, both states employ about 1.2 million workers in the small-business sector by our definition in this Commentary. However, small businesses in Maryland incurred about $59 billion in payroll costs in 2018 compared to $46 billion in Missouri. Hence, larger total PPP loans for Maryland does not necessarily reflect a larger shock to small businesses or more generous support for the state compared to Missouri. Return to 9
- We follow a similar logic presented in Schweitzer and Borawski (2021a) for picking our 500-employee threshold. Data can be accessed at SUSB Datasets (census.gov). Return to 10
- See section 2.c, for a list of reasons why state level total loans could differ from 2.5 months of payrolls. Return to 11
- Nebraska, North Dakota, Kansas, Vermont, South Dakota, and so on. Return to 12
- California, New York, and Florida. Return to 13
- Even though PPP loans are offered mostly to small businesses, data on payroll employment for this firm class size are not available at a high frequency. Hence, we focus on total private employment. Data on private employment for states are from the Current Employment Statistics for State and Metro Areas: SAE Home Page: US Bureau of Labor Statistics (bls.gov). Return to 14
- DC stands out as an outlier in terms of PPP usage (Figure 1). This status is likely a result of the composition of establishments in DC: the public sector is relatively large, and nonprofit establishments constitute a larger fraction of the establishments in the class size on which we focus. For this reason, DC has been omitted. Hawaii appears to be an outlier in terms of employment growth performance. After contracting almost 26.5 percent in two months, employment grew only a very small amount, leaving it 24.7 percent below February’s level. This is likely related to the industry composition of employment in the state, which relies to a large degree on the tourism industry. Beyond Hawaii, net employment change by the end of August ranged between -15 percent and -2 percent. For the empirical analysis we present here, we ignore both Hawaii and DC. This omission does not effect our formal results qualitatively. Return to 15
- Data on new case rates at the state level come from the Opportunity Insights Economic Tracker (Economic Tracker (tracktherecovery.org)). Return to 16
- During the Great Recession, average employment decline in a state was 7.8 percent. Thus, mitigating the employment decline by a few percentage points could be an economically meaningful intervention. Return to 17
- We use the HCI definition of Leibovici, Santacreu, and Famiglietti (2020) and use their estimates for state-level share of these occupations. Return to 18
- See Schweitzer and Borawski (2020a) for a detailed discussion on this topic. Return to 19
References
- Leibovici, Fernando, Ana Maria Santacreu, and Matthew Famiglietti. 2020. “Social Distancing and Contact-Intensive Occupations.” On the Economy (blog). March 24, 2020. https://www.stlouisfed.org/on-the-economy/2020/march/social-distancing-contact-intensive-occupations.
- Schweitzer, Mark E., and Garrett Borawski. 2021a. “Which Industries Received PPP Loans?” Economic Commentary (Federal Reserve Bank of Cleveland), no. 2021–08 (April). https://doi.org/10.26509/frbc-ec-202108.
- Schweitzer, Mark E., and Garrett Borawski. 2021b. “How Well Did PPP Loans Reach Low- and Moderate-Income Communities?” Economic Commentary (Federal Reserve Bank of Cleveland), no. 2021–13 (May): 1–5. https://doi.org/10.26509/frbc-ec-202113.
- Tasci, Murat, and Nicholas Zevanove. 2019. “Do Longer Expansions Lead to More Severe Recessions?” Economic Commentary (Federal Reserve Bank of Cleveland), no. 2019–02 (January): 1–6. https://doi.org/10.26509/frbc-ec-201902.
Data Summary
We use data from multiple sources. The main data on PPP loans come from the Small Business Administration’s (SBA) PPP individual-level data that have been geocoded by Schweitzer and Borawski (2021a). We append to this data additional labor market-relevant information from other publicly available sources. Employment growth in the nonfarm private sector at the state level is from Current Employment Statistics (CES) State and Metro Area Employment program. We rely on the Census Bureau’s Statistics of US Businesses (SUSB) to obtain total payroll expenses in 2018 at the state level for businesses that employ fewer than 500 workers. Share of employment in the small-business sector also comes from the SUSB. Fraction of HCI jobs within a state is from Fernando, Santacreu, and Famiglietti (2020), and the data on new case rates come from the Opportunity Insights Economic Tracker.
Suggested Citation
Tasci, Murat, Bezankeng Njinju, and Hana Braitsch. 2021. “PPP Loans & State-level Employment Growth.” Federal Reserve Bank of Cleveland, Economic Commentary 2021-20. https://doi.org/10.26509/frbc-ec-202120
This work by Federal Reserve Bank of Cleveland is licensed under Creative Commons Attribution-NonCommercial 4.0 International

