

- Share
Whose Inflation Expectations Best Predict Inflation?


The views authors express in Economic Commentary are theirs and not necessarily those of the Federal Reserve Bank of Cleveland or the Board of Governors of the Federal Reserve System. The series editor is Tasia Hane. This paper and its data are subject to revision; please visit clevelandfed.org for updates.
Inflation readings fell as economic activity slowed in 2020, but when the economy began to recover, inflation rebounded as well—quite sharply, in fact. By June 2021, the consumer price index had increased 5.4 percent over the previous 12 months, putting inflation at its highest reading since the summer of 2008. Since then, it has remained elevated, registering 5.4 percent in September. Considerable attention has turned to the question of whether this surge in inflation will persist into 2022 and beyond.
An answer could come from developments in inflation expectations. People’s expectations about future inflation influence their behavior, and thus their expectations are thought to play a role in shaping inflation. With this in mind, inflation expectations should be able to give us an idea of where inflation is headed. However, there are several measures of inflation expectations, and they don’t always agree. For example, one-year-ahead inflation expectations from three different surveys—the University of Michigan Surveys of Consumers, Blue Chip Economic Indicators, and the Federal Reserve Bank of Atlanta’s business inflation expectations—have all risen sharply since January and have been around the 2.5 percent to 4.7 percent range since June. By contrast, one-year-ahead inflation expectations from the Federal Reserve Bank of Cleveland's inflation expectations model, which is based on financial-market data, has averaged 2.2 percent since June (and currently stands at just 1.8 percent). Given these mixed signals, whose inflation expectations provide the best signal about the inflation outlook?
This Commentary compares the predictive relationship between several measures of inflation expectations and future inflation. We use cross-correlations, in-sample estimations, and out-of-sample forecasting exercises to assess the relative predictive performance of these measures. We find that the expectations of professional economists and businesses have been notably more accurate predictors of inflation over the following year than the expectations of households, with financial-market-based expectations sitting in the middle of the pack. However, the forecasts coming from a relatively simple and popular benchmark inflation forecasting model, that of Stock and Watson (2007), have historically been about as accurate as the expectations of professional economists and businesses.
Inflation Expectations Measures and Inflation
Inflation expectations are influenced by inflation; if inflation has been high in the recent past, inflation expectations tend to be high, as well. But inflation expectations also exert an influence on inflation. Indeed, the influence of inflation expectations on subsequent inflation is thought to be so strong that central banks view them as critical to the functioning of monetary policy. They monitor expectations closely to determine whether those expectations are anchored at the policy target (Binder et al., 2020). However, there is no consensus on whose inflation expectations are most important in explaining where inflation is headed.
This Commentary focuses on four measures of inflation expectations.
- Inflation expectations of households, as measured by the University of Michigan Surveys of Consumers one-year-ahead inflation expectations.
- Inflation expectations of professional economists, as measured by the Blue Chip Economic Indicators one-year-ahead consumer price index (CPI) inflation expectations.
- Inflation expectations of firms, as measured by the Federal Reserve Bank of Atlanta’s business inflation expectations survey. This measure captures expected growth in the production costs of the firm over the next year, although we use it to predict consumer price inflation.1
- Inflation expectations of financial markets, as captured by the model behind the one-year-ahead Federal Reserve Bank of Cleveland inflation expectations series. The Cleveland model (Haubrich, Pennacchi, and Ritchken (2012)) estimates inflation expectations using data that include nominal yields from US Treasury securities, survey forecasts, and inflation swap rate data.2
These inflation expectations measures are all available in a monthly series. We examine the relationship of each of these measures to several measures of inflation including CPI inflation, core CPI inflation, median CPI inflation, and trimmed-mean CPI inflation. The median CPI is arguably a better signal of the trend in CPI inflation than overall CPI inflation and has been found to be useful in predicting future CPI inflation (Meyer, Venkatu, and Zaman, 2013) and other variables (Meyer and Zaman, 2019). We compute year-over-year inflation rates for the CPI and core CPI using nonseasonally adjusted data, which are not revised. We use the most recent vintage of year-over-year median CPI and trimmed-mean CPI inflation data to compute year-over-year inflation rates for those variables.
A large literature has documented changes in inflation dynamics since the mid-1980s (Aastveit et al, 2017). Accordingly, we focus on data from 1986 onward, a date coinciding with the start of the Blue Chip expectations measure. Data from the Atlanta Fed’s business survey are available only starting in October 2011.
Cross-Correlations
Cross-correlations permit a simple examination of the lead or lag structure between two series and the strength of the connections between the series. If inflation expectations reliably predict actual inflation, then the strongest cross-correlations would be expected between actual inflation at time t and inflation expectations at some point in the k periods before t.
Figure 1 presents the correlations between CPI inflation at time t and one-year-ahead inflation expectations at time t+k for our measures, with a long sample in Panel A starting in the mid-1980s and a shorter sample starting in 2011 in Panel B.3 For almost all of the inflation expectations series we consider, the correlation peaks in month t. This pattern suggests that CPI inflation and expectations of inflation for the next year tend to comove; in other words, a high inflation reading at time t indicates that households, businesses, financial markets, and professional forecasters expect a high inflation reading at time t+12. Over the longer sample, expectations from both the Cleveland Fed model and Blue Chip exhibit correlations with CPI inflation that are similar and moderately high (in the range of 0.6 to 0.7). But many of the cross-correlations are lower during the post-2011 period, and some of the cross-correlations turn negative at higher lags, suggesting a much more limited ability of the expectations measures to predict one-year-ahead inflation recently.
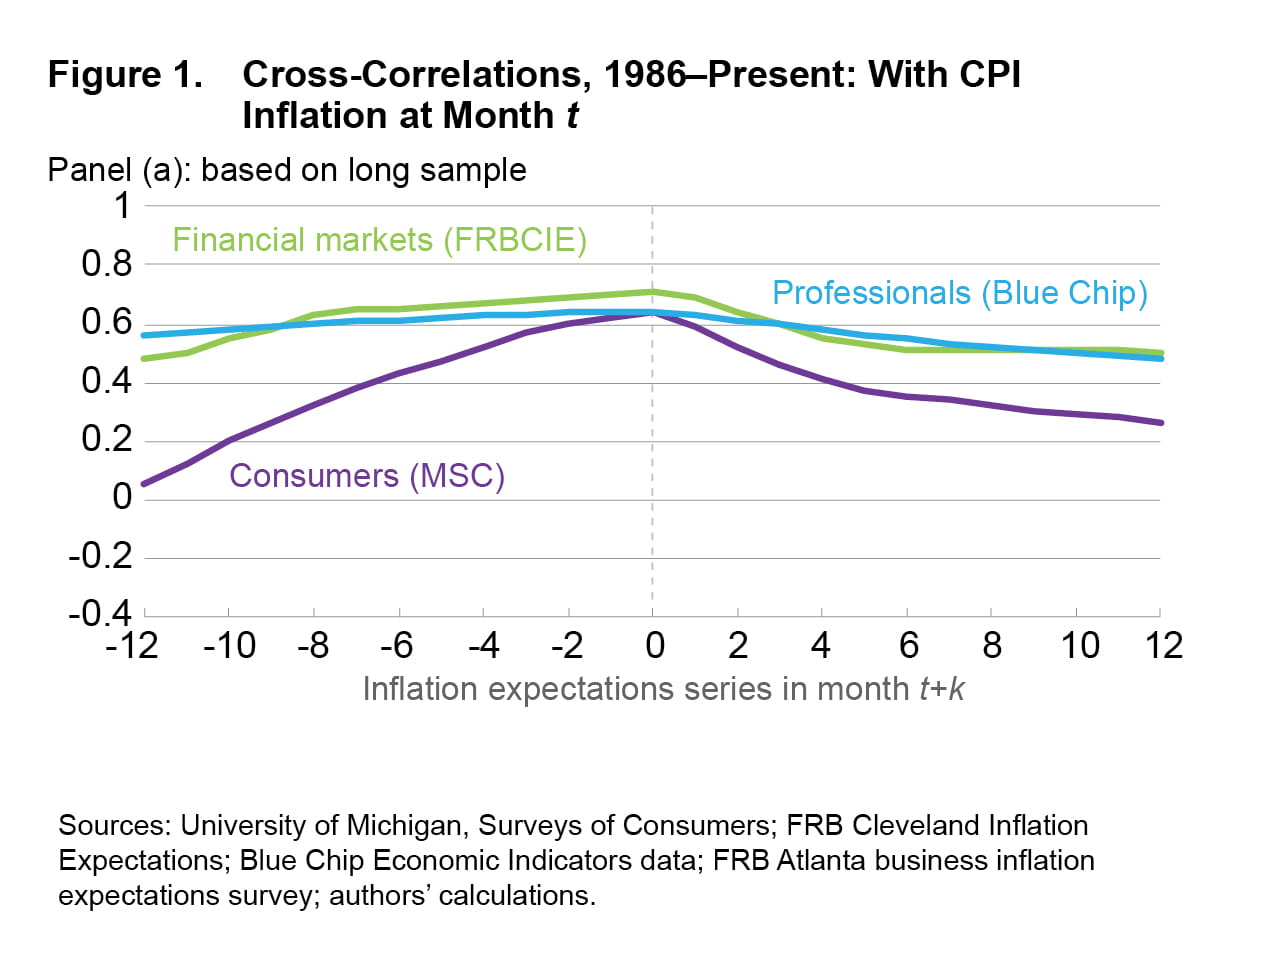
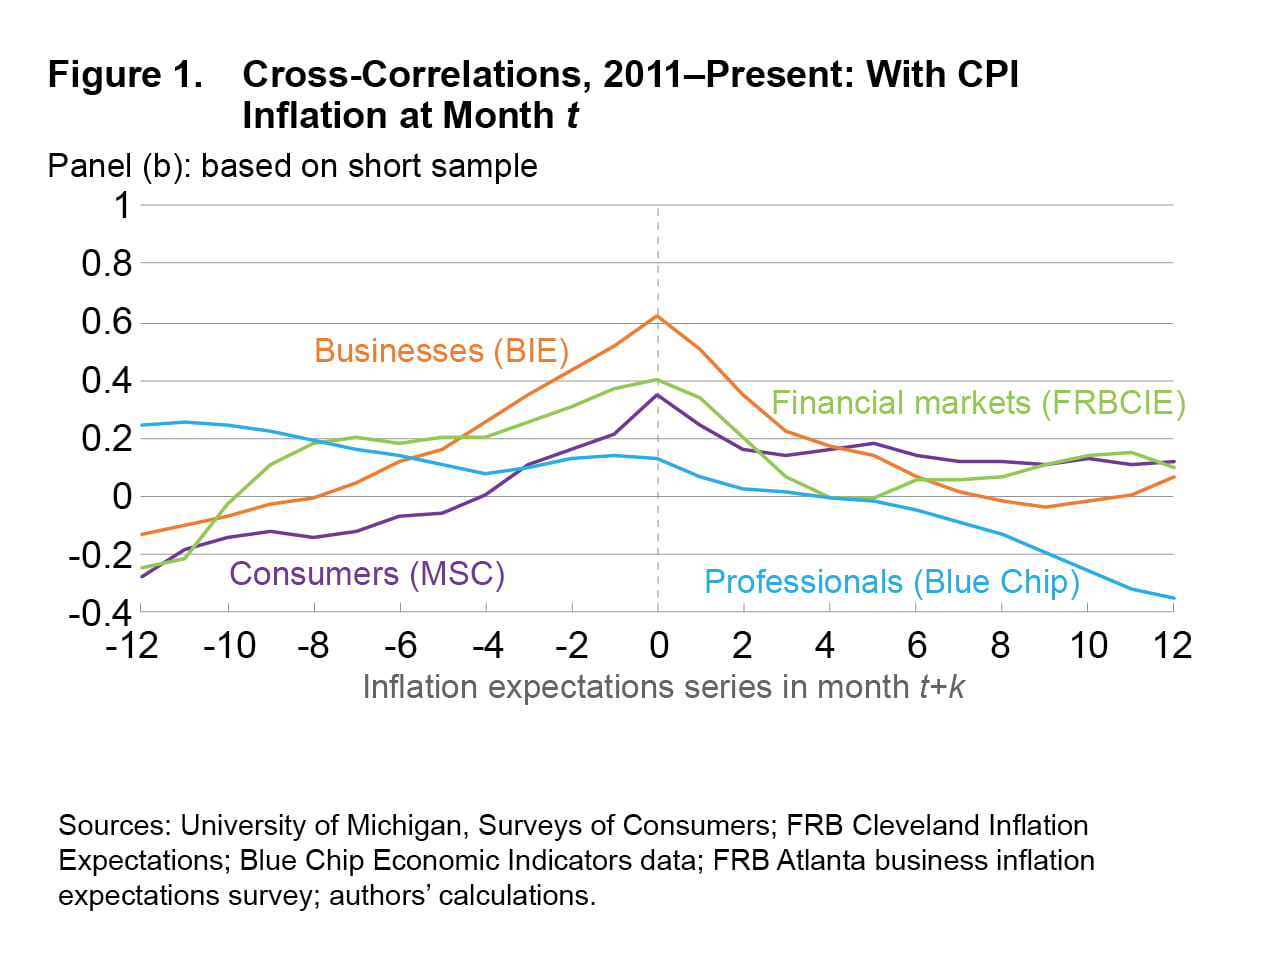
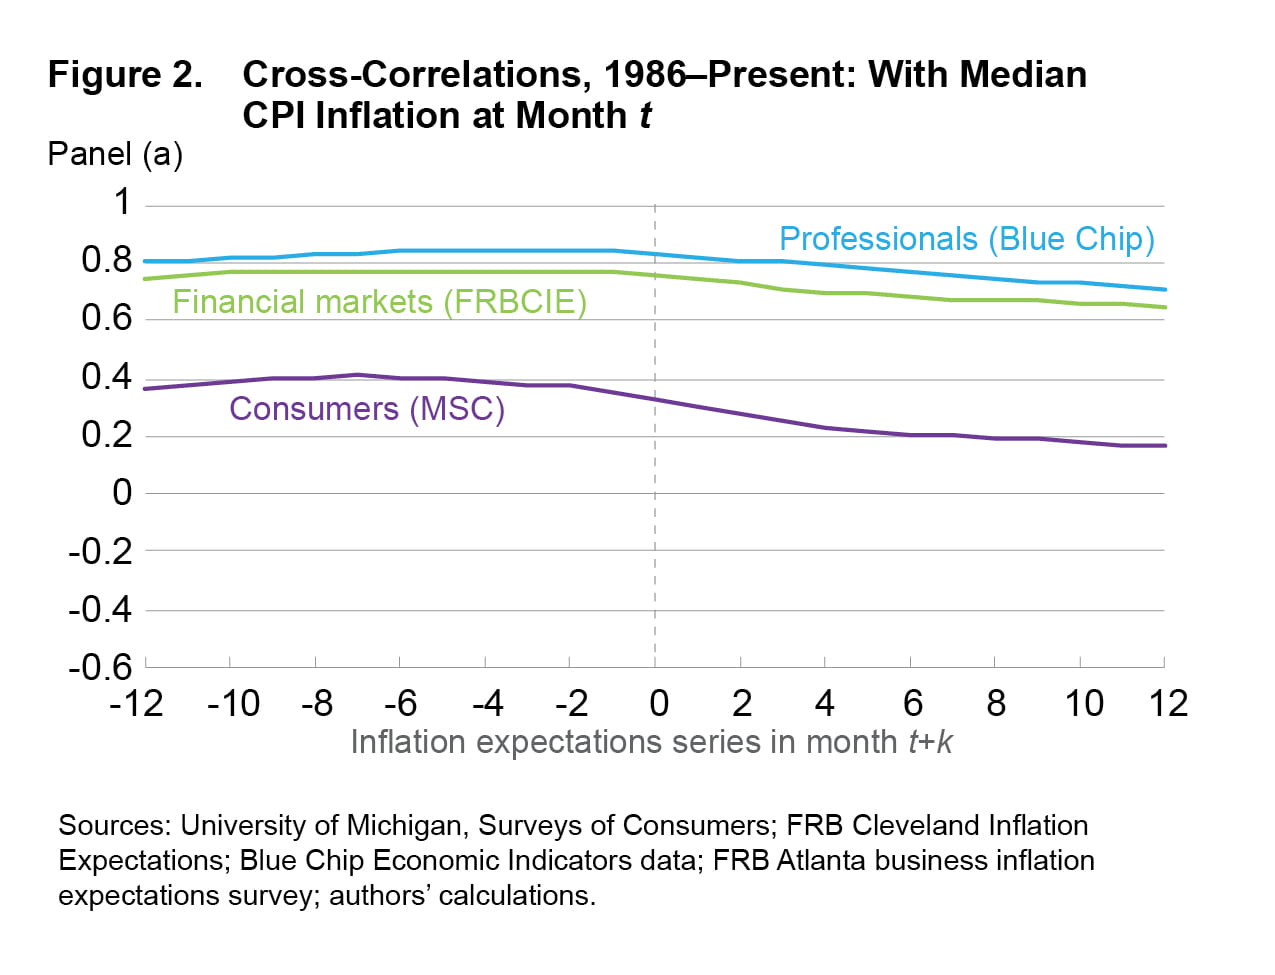
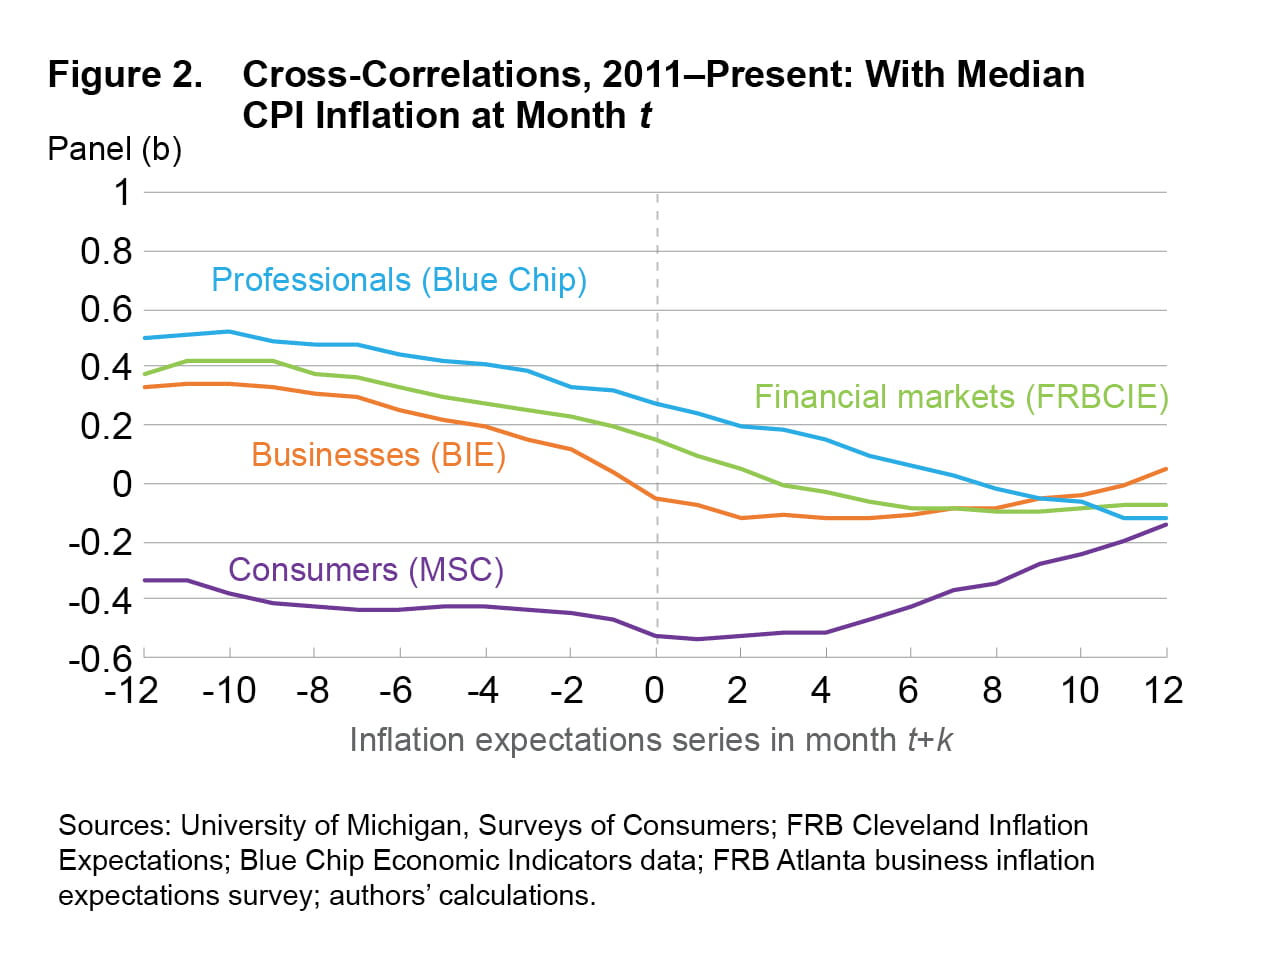
Figure 2 plots cross-correlations between median CPI inflation at time t and inflation expectations at time t+k. We note two observations. First, expectations from both the Cleveland Fed model and Blue Chip exhibit similar cross-correlations with median CPI inflation that vary little over different leads and lags over the longer sample. Second, in contrast to the case of CPI inflation, the strongest correlations for several measures, especially in the later sample, are at time t-12 (instead of at time t), suggesting that Blue Chip, the Cleveland Fed model, and the Atlanta Fed business survey have some ability to predict future median CPI inflation. By contrast, household expectations coming from the Michigan consumer survey have low correlations with median CPI inflation.
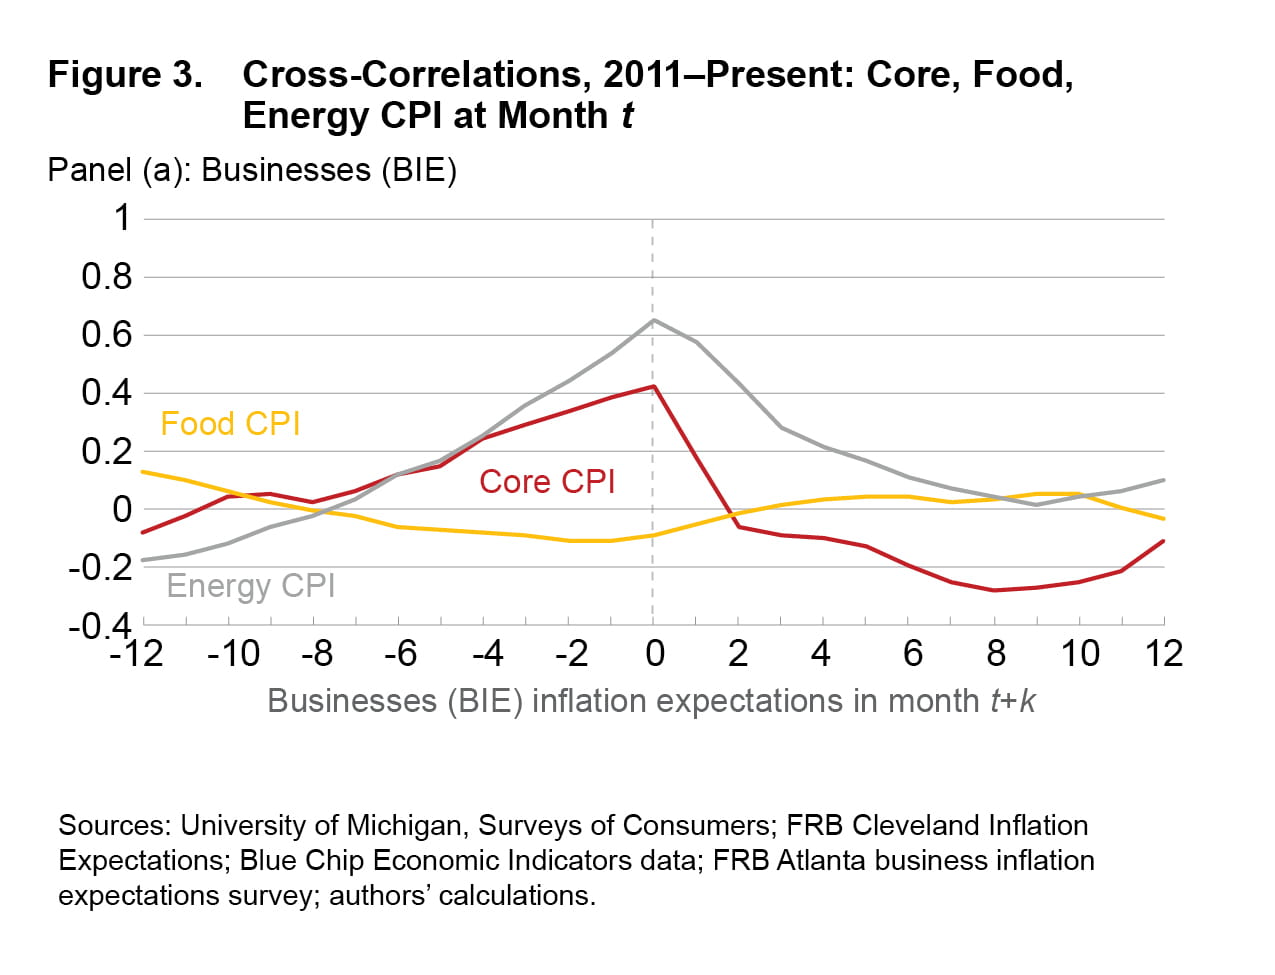
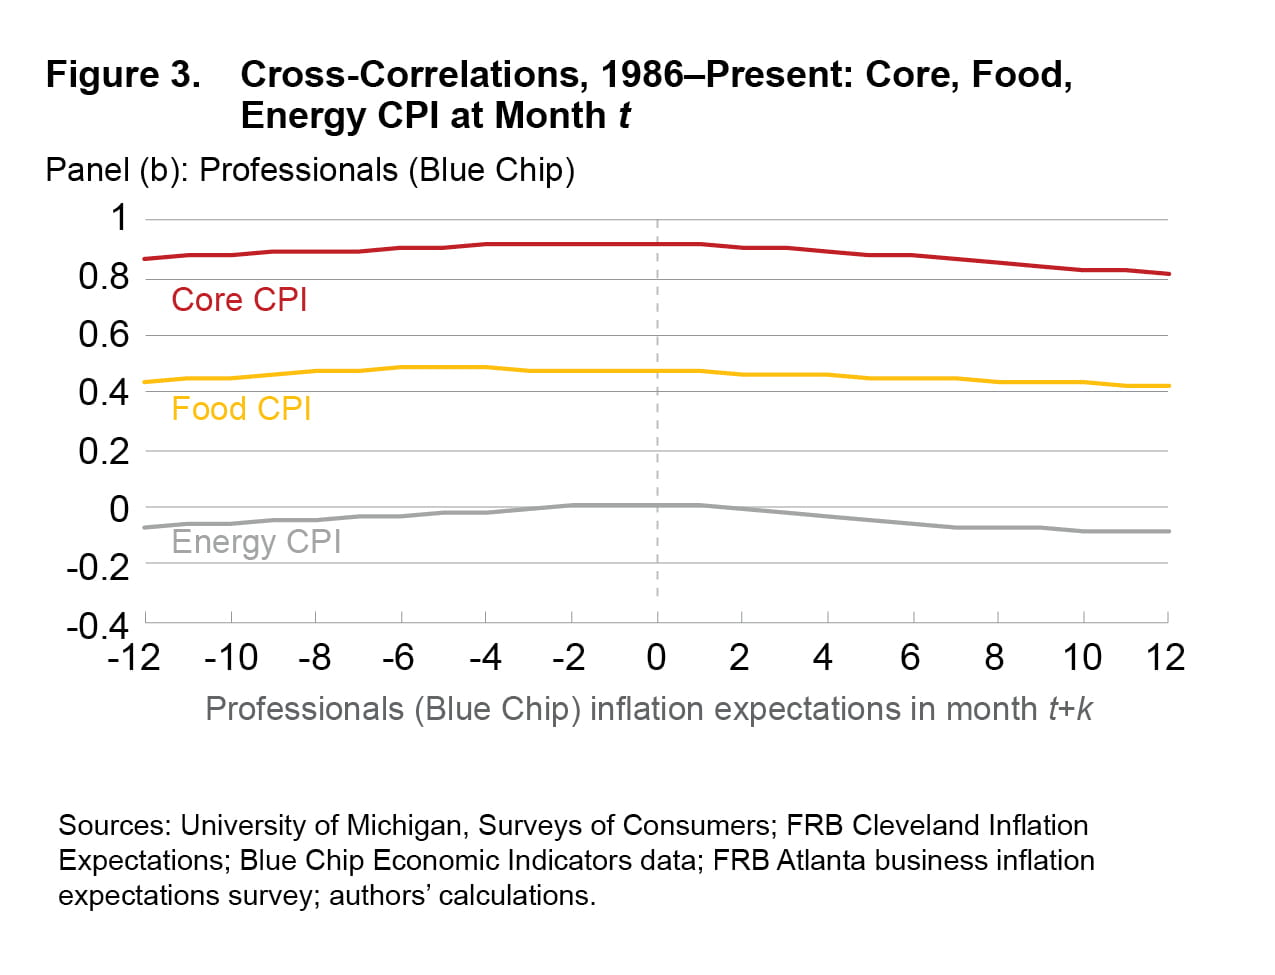
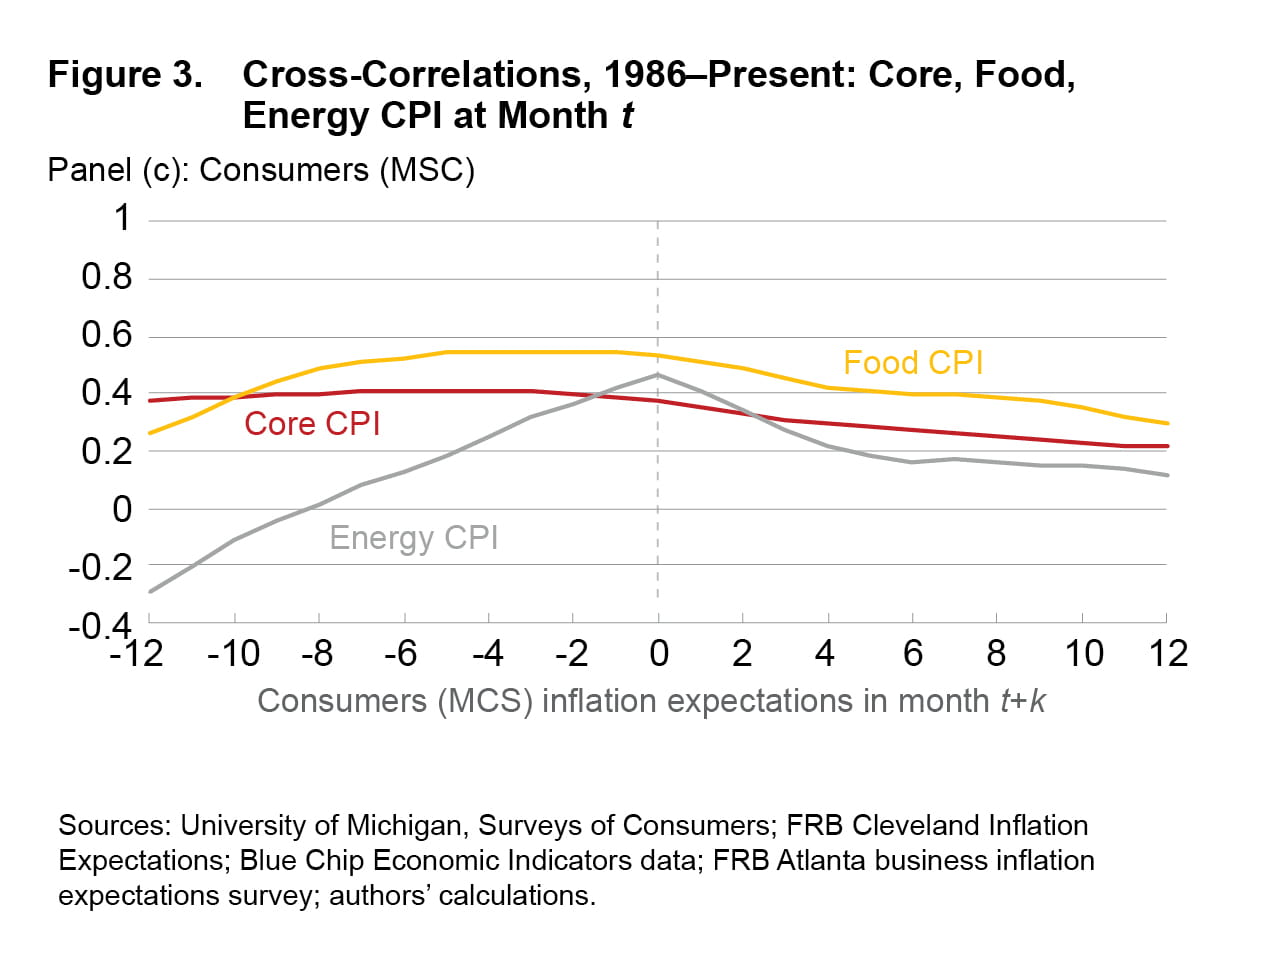
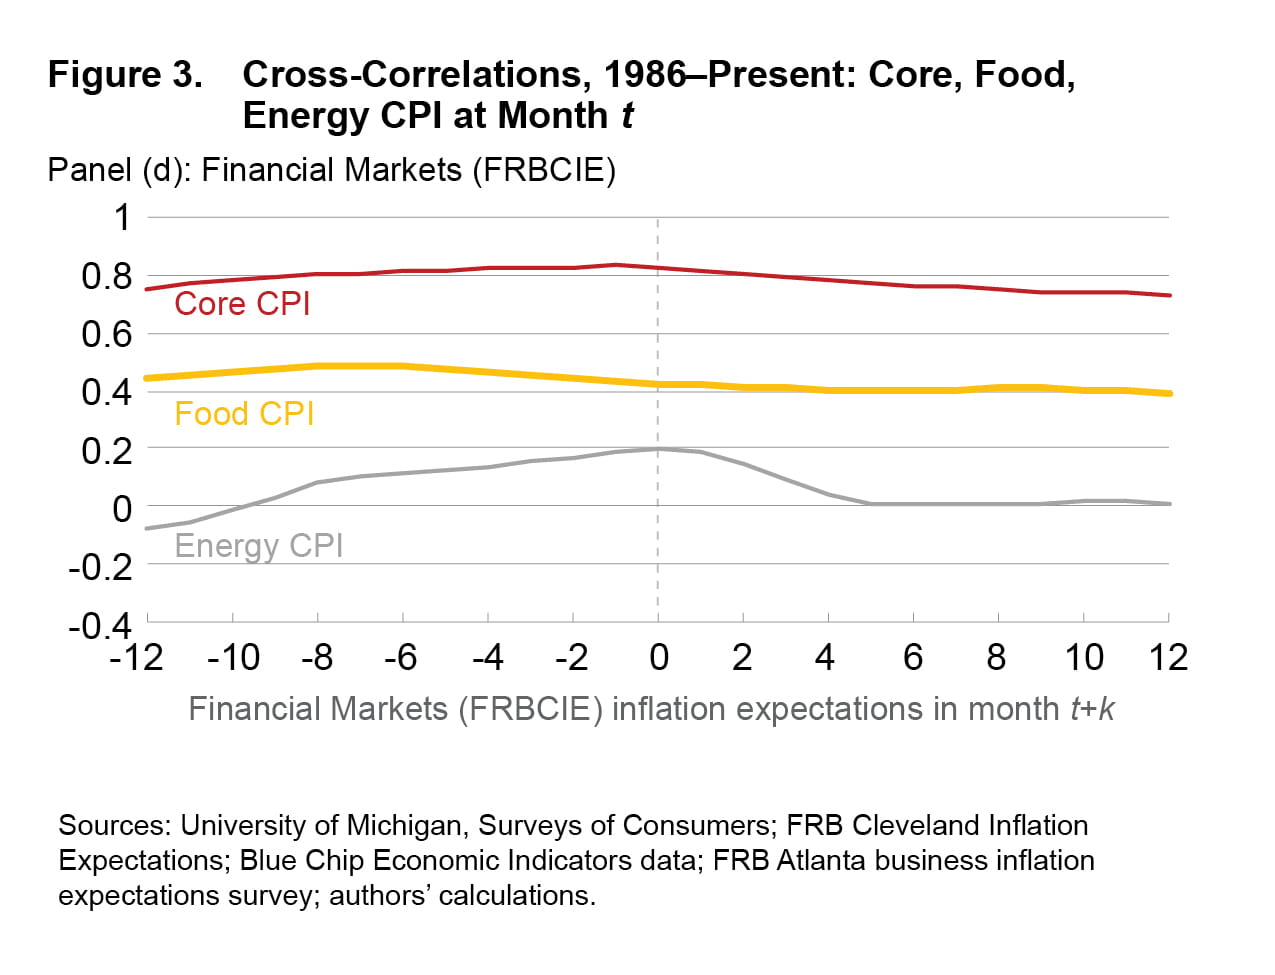
CPI inflation can be influenced by volatility in energy prices, making it difficult to predict. To get a sense of which components of the aggregate CPI inflation may be driving the correlation between CPI inflation and the inflation expectations measures, Figure 3 plots the cross-correlations between the three main inflation components (core CPI, food CPI, and energy CPI) and the expectations measures. Looking across panels, expectations from the Atlanta Fed business survey have the strongest correlation with energy inflation, whereas those from Blue Chip have the lowest. While it is often thought that consumers’ inflation expectations are largely driven by energy, expectations from the Michigan consumer survey’s correlation with energy are not very high. By contrast, expectations from the Blue Chip and the Cleveland Fed model are highly correlated with core CPI inflation. This finding suggests that professional economists and financial markets put a high weight on developments in core CPI inflation when forming their expectations about overall inflation. The evidence that the Atlanta Fed business survey correlates weakly with core CPI inflation and strongly with energy inflation likely reflects the fact that the Atlanta Fed survey is measuring the expectations about the firms’ unit costs, which are highly influenced by movements in gasoline prices.
Examining Predictive Relationships (In-Sample)
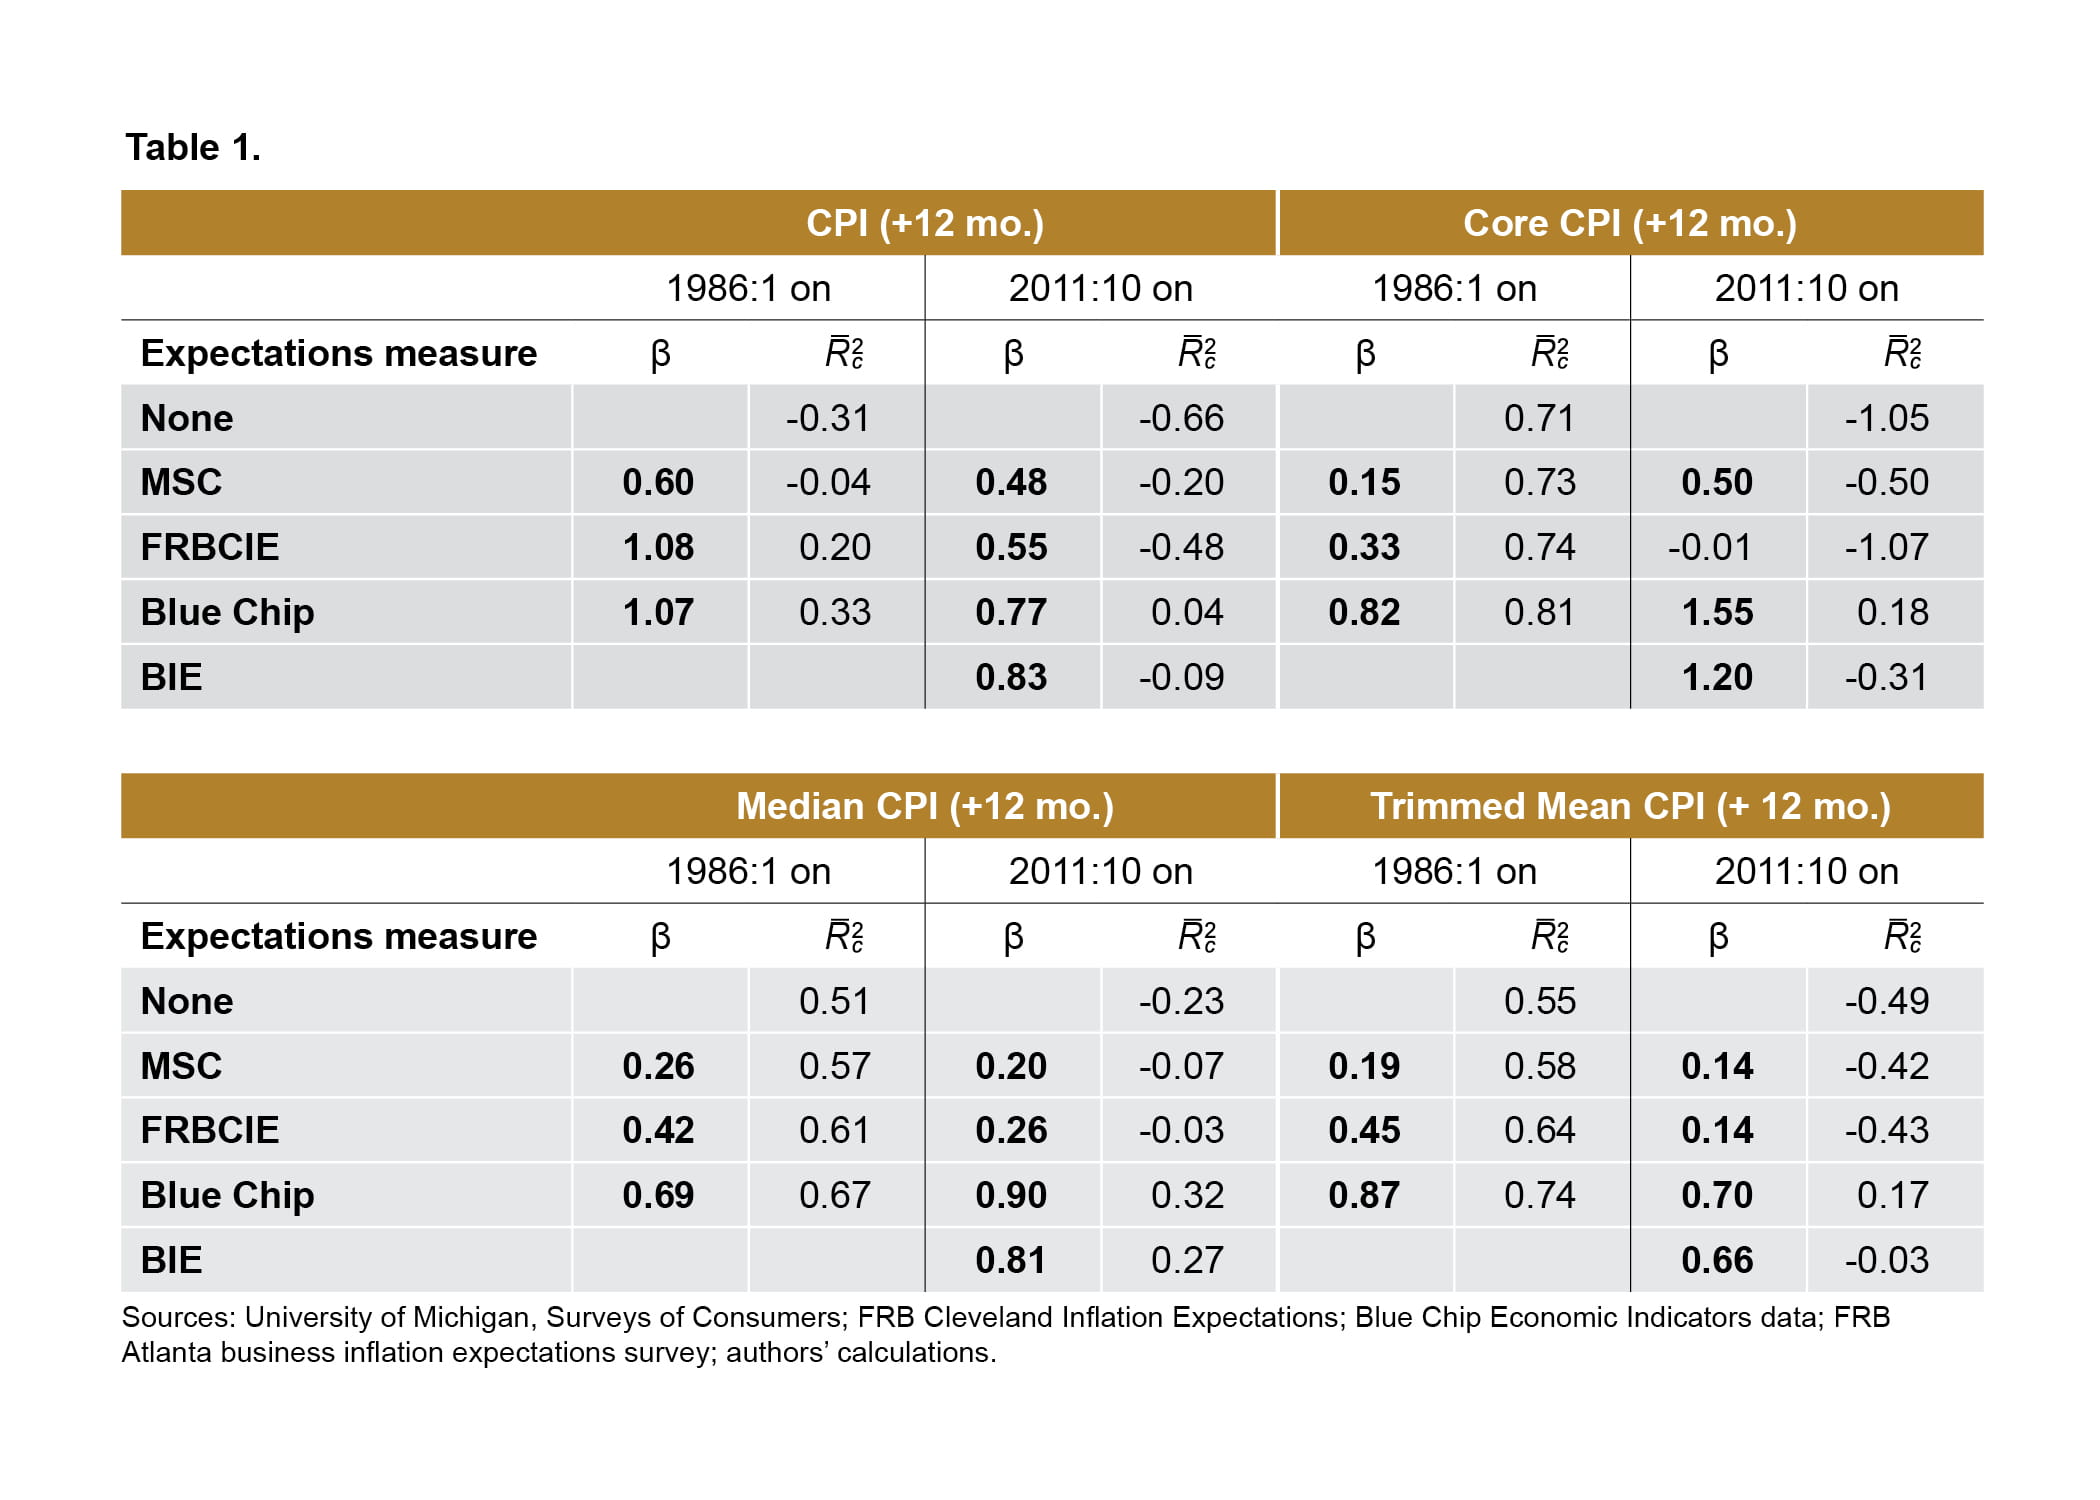
While cross-correlations are instructive, they cannot fully capture complicated dynamics. To assess predictive performance, we first use in-sample (or within-sample) regressions. Predictions based on in-sample estimation uses the entire data sample to estimate the parameters in order to best predict observations within the sample. We focus on the ability of each inflation expectations measure to predict one-year-ahead inflation. The specification we use is
Πt,t+12 = βSt + δΠt-12,t + et,
where Πt,t+12 is the year-over-year inflation rate, based on CPI, median CPI, or core CPI, between time t and time t+12, Πt-12,t is the trailing year-over-year inflation rate, and St represents the inflation expectations measure at time t, either the Michigan survey, the Cleveland Fed model, the Atlanta Fed business survey, or Blue Chip. We estimate our specification over two sample periods: January 1986 through May 2021 and—to accommodate the shorter availability of the Atlanta Fed survey—October 2011 through May 2021. We first report results from a baseline specification that excludes any inflation expectation series. The change in the regression R2 as we move from this baseline specification to one that includes a particular inflation expectation variable tells us how much that variable contributes to improved prediction, that is, how much it reduces the prediction error.4
In Table 1, we report the coefficient estimates for β and the regression R2. Coefficient estimates that appear in bold are statistically significant at the 5 percent level. If expectations are very important for explaining where inflation is headed, then we would expect the β coefficient estimates to be in the neighborhood of +1. If the inflation expectations term in a given regression is a useful predictor, it will increase R2 notably.
The main takeaway from this exercise is that Blue Chip has consistently been the best inflation predictor, featuring the highest R2 and regression coefficients that have often been closest to 1, suggesting a tighter relationship with actual inflation, while the Michigan consumer survey has been the worst predictor. The assessment and ranking of the other two measures are more complicated. The Cleveland Fed model performs well over the full sample period but is a rather poor predictor over the period from 2011 onward. Over this recent period, the Atlanta Fed business survey is usually the second-best predictor, although its performance still leaves much to be desired. On the plus side, the Atlanta Fed survey is roughly as good a predictor of median CPI inflation as is Blue Chip. But on the minus side, for CPI, core CPI, and trimmed-mean CPI, our results suggest that one is better off simply basing one’s prediction on the average of the inflation series.
(Out-of-Sample) Forecasting
Out-of-sample forecasting does not use the entire data sample at once. Instead, for a forecast of 12-month-ahead inflation at date t, it uses information in the sample only up to date t. While the in-sample regressions discussed above suggest that inflation expectations may have some predictive power for inflation over the data sample, out-of-sample forecasting is often a more difficult challenge because forecasts are based only on data available at the time the forecasts are produced, and therefore relatively weak relationships may evolve or simply break down over time. In this vein, we conduct a forecasting exercise in which we treat each inflation expectations estimate at month t as the 12-month-ahead forecast of CPI inflation, and we compare this prediction to the realized or actual inflation reading one year in the future. We also compare the accuracy of these CPI inflation forecasts to a CPI inflation forecast produced using the popular benchmark forecasting model of Stock and Watson (2007) since recent research has documented that such time-series models can produce forecasts that rival those of surveys of professional forecasters.5 Following best practices in the forecasting literature, we augment this model using inflation nowcasts.6 Given the available data, our forecast evaluation sample begins in January 1987 and ends in April 2021; when considering the Atlanta Fed survey data, the forecast evaluation sample begins in October 2012 and ends in April 2021. Our chief interest is in predicting CPI inflation. However, we also evaluate the extent to which these inflation expectations measures forecast future core CPI inflation, median CPI inflation, and trimmed-mean CPI inflation.
Table 2 reports root mean squared errors (RMSEs) when the four inflation expectations measures are used to predict CPI, core CPI, median CPI, or trimmed-mean CPI inflation rates, with lower RMSEs indicating smaller forecast errors and hence more accurate forecasts. We determine whose inflation expectations provide the best signal about the inflation outlook.
In the longer evaluation sample, Blue Chip outperforms the Michigan survey and the Cleveland Fed model for each of our inflation measures at the one-year horizon. In the shorter evaluation sample that includes the Atlanta Fed survey, Blue Chip and the Atlanta Fed survey outperform the other two measures. Across the board, the Michigan survey fares poorly compared with the other inflation expectations, while the Cleveland Fed model is in the middle. That said, in the case of CPI inflation, the differences in forecast accuracy across the Cleveland Fed model, Blue Chip, and the Atlanta Fed business survey are small.
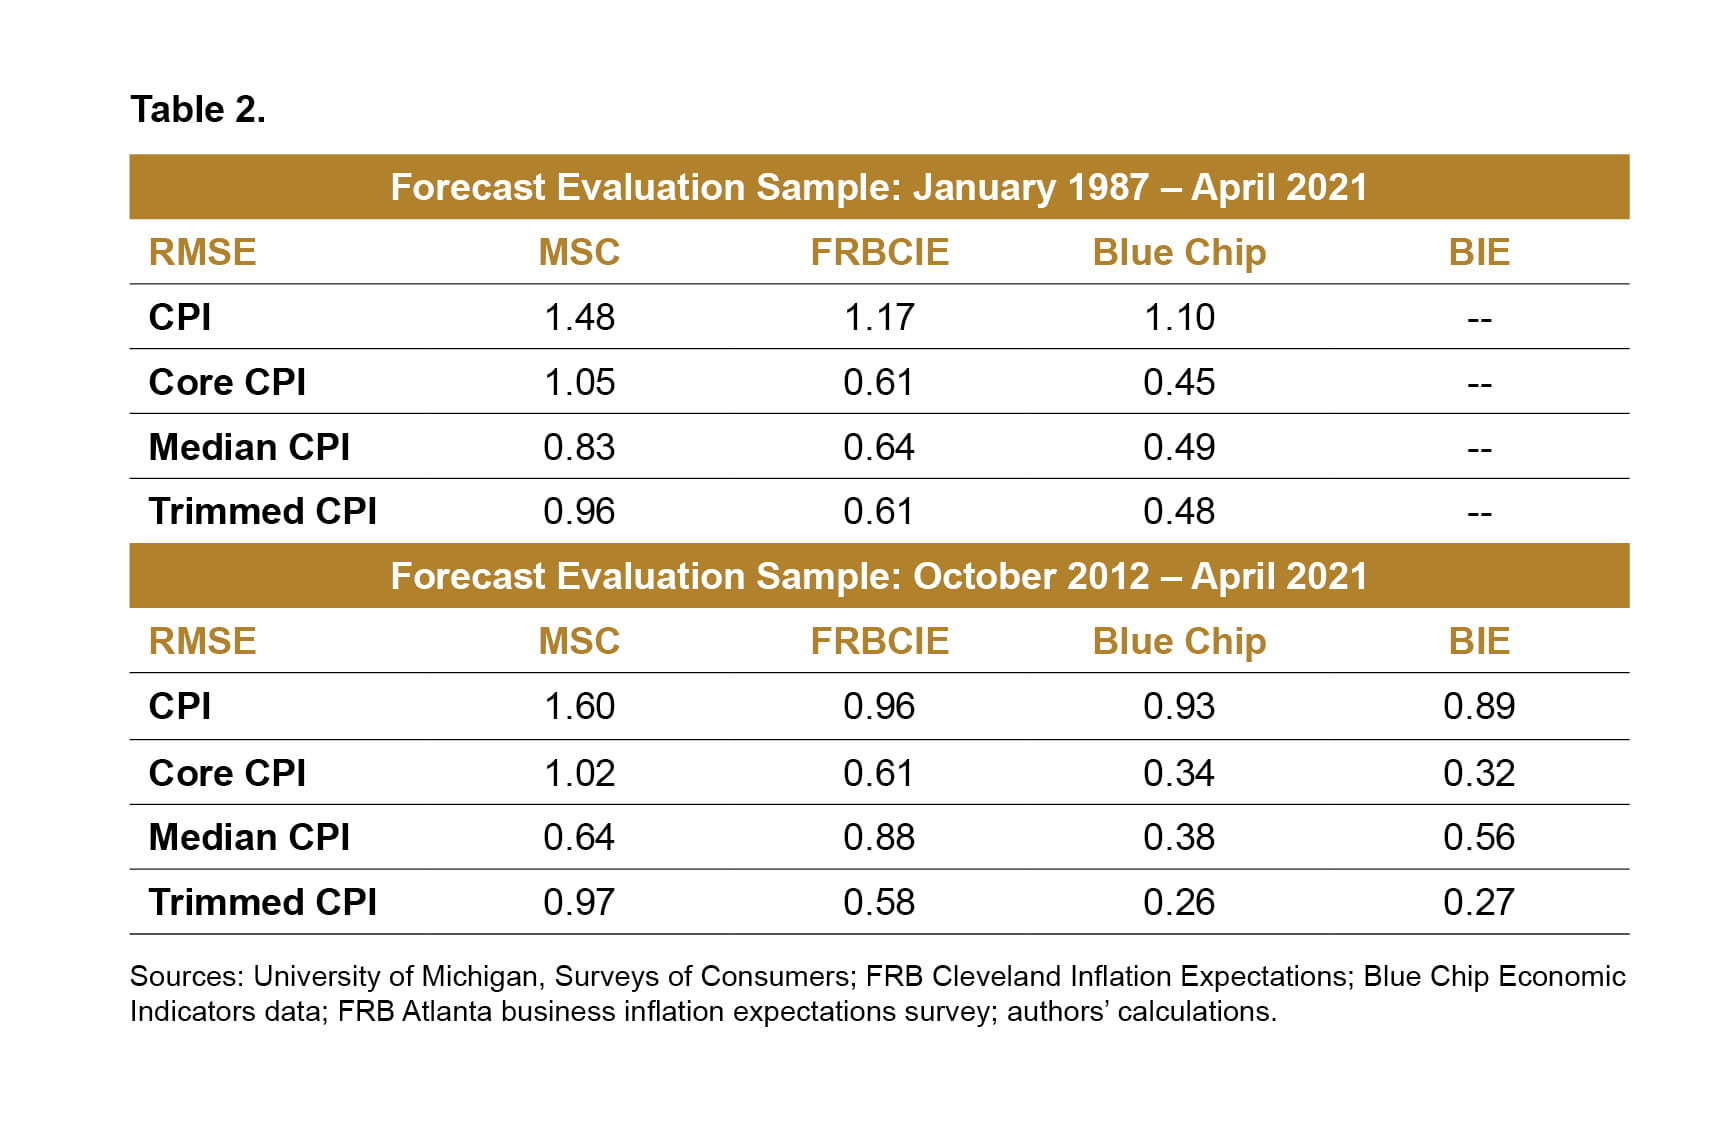
How does the Stock and Watson model-based forecast fare? Over the evaluation window running from October 2012 to April 2021, the RMSE for one-year-ahead CPI inflation forecasts from this model is 1.04 percent compared to 0.89 percent for the Atlanta Fed business survey and 0.93 percent for Blue Chip. Formal statistical tests suggest that all three measures are about equally good at forecasting future inflation.7
Our findings that professional forecasters tend to have more accurate inflation expectations than households are similar to those of Berge (2018), who used expectations from the Survey of Professional Forecasters rather than Blue Chip, and Aruoba (2020). By contrast, they differ from the results in Coibion and Gorodnichenko (2015), who find that expectations from the Michigan consumer survey are a better predictor of inflation than are the one-year-ahead expectations in the Survey of Professional Forecasters.
Conclusion
Recent inflation readings have been very high, and a question on many peoples’ minds is whether this surge will persist into 2022 and beyond. A natural place to look for an answer is inflation expectations. But there are various measures of inflation expectations, and sometimes these measures paint different pictures. In this Commentary, we evaluate whose inflation expectations – those of professionals, businesses, households, or financial markets – have best predicted inflation in the past.
Based on in-sample and out-of-sample predictive exercises, we find that the expectations of professional economists and businesses, as demonstrated by the Blue Chip and Atlanta Fed measures, have provided substantially more accurate predictions of CPI inflation one-year out compared to those of households. The accuracy of the Cleveland Fed inflation expectations model, which could be viewed as reflecting the expectations of the financial markets, is somewhat behind these other two measures. However, the forecasts coming from a relatively simple and popular benchmark inflation forecasting model by Stock and Watson have historically been about as accurate as expectations of businesses and professional economists.
Footnotes
- For more details on the Atlanta Fed’s business survey and its relationship to inflation, see Meyer, Parker, and Sheng (2021). Return to 1
- This model estimates and factors out an inflation risk premium from financial market data, partly on the basis of the inflation expectations of professional economists (i.e., Blue Chip Economic Indicators and the Survey of Professional Forecasters). The removal of this risk premium is crucial; many previous studies (Ang, Bekaert, and Wei, 2007; Bauer and McCarthy, 2015; and Mertens, 2016) find that “raw” market-based inflation forecasts fare poorly in forecast comparisons owing to the presence of this risk premium. Aruoba 2020 characterizes the Cleveland Fed inflation expectations model as providing a “cleaned version” of swap rate data (Aruoba, 2020, p. 551). Return to 2
- We use the recently developed methods of Dalla, Giraitis, and Phillips (2020) to estimate robust cross-correlation estimates. Return to 3
- The regression R2 indicates how much prediction error is reduced as a result of explanatory variables. We report the adjusted centered R2, R̅c2, rather than the conventional R2 because doing so has two benefits. First, it normalizes the R2 so that its score starts at 0 when the prediction accuracy is equivalent to simply using the mean of the series. Second, it “penalizes” the addition of explanatory variables to ensure that the improvement in forecast accuracy from including an additional variable is worth the cost of having to use an additional variable. Thus, this measure can fall if the added explanatory variable is not very useful in prediction and can be negative if the prediction is worse than simply using the mean of the series as the predictor. Return to 4
- Alternative time-series forecasting model options include the model developed by Ashley and Verbrugge (2020), which is based on a frequency-decomposition of the unemployment rate gap and has shown to have generated highly accurate conditional recursive forecasts since the onset of the financial crisis, and the model developed by Tallman and Zaman (2017), which forecasts aggregate CPI inflation using the disaggregated indexes goods CPI inflation and services CPI inflation. Return to 5
- Tallman and Zaman (2020) show that augmenting vector autoregressive (VAR) model forecasts with nowcasts of inflation, as is the typical practice in forecasting (Knotek and Zaman, 2019), leads to forecasts for CPI inflation that are comparably accurate to those of the Survey of Professional Forecasters. Based on these exercises, we augment the Stock and Watson (2007) model with monthly CPI inflation nowcasts from the inflation nowcasting model of Knotek and Zaman (2017). The inflation nowcasts are publicly available and can be downloaded from the Cleveland Fed’s website, www.clevelandfed.org. The history of the real-time inflation nowcasts goes back to August 2013. Hence, in the forecasting runs spanning October 2011 through July 2013, we do not input the nowcasts to the model, likely disadvantaging the time-series model-based forecasts. Return to 6
- That is, the forecast accuracy gain of Blue Chip (or the Atlanta Fed business survey) over the univariate model is not statistically significant at the 5 percent significance level (based on the Diebold-Mariano West test). We also note that had we not included the monthly nowcasts, the model’s inflation forecast accuracy would be slightly inferior (RMSE of 1.05 percent). Return to 7
References
- Aastveit, Knut Are, Andrea Carriero, Todd E. Clark, and Massimiliano Marcellino. 2017. “Have Standard VARS Remained Stable Since the Crisis?” Journal of Applied Econometrics 32 (5): 931–51. https://doi.org/10.1002/jae.2555.
- Ang, Andrew, Geert Bekaert, and Min Wei. 2007. “Do Macro Variables, Asset Markets, or Surveys Forecast Inflation Better?” Journal of Monetary Economics 54 (4): 1163–1212. https://doi.org/10.1016/j.jmoneco.2006.04.006.
- Aruoba, S. Borağan. 2020. “Term Structures of Inflation Expectations and Real Interest Rates.” Journal of Business & Economic Statistics 38 (3): 542–53. https://doi.org/10.1080/07350015.2018.1529599.
- Ashley, Richard, and Randal J. Verbrugge. 2020. “Finding a Stable Phillips Curve Relationship: A Persistence-Dependent Regression Model.” Working paper 19-09R. Federal Reserve Bank of Cleveland. https://doi.org/10.26509/frbc-wp-201909r.
- Bauer, Michael D., and Erin McCarthy. 2015. “Can We Rely on Market-Based Inflation Forecasts?” FRBSF Economic Letter 2015 (30). https://ideas.repec.org/a/fip/fedfel/00070.html.
- Berge, Travis J. 2018. “Understanding Survey-Based Inflation Expectations.” International Journal of Forecasting 34 (4): 788–801. https://doi.org/10.1016/j.ijforecast.2018.07.003.
- Binder, Carola Conces, Wesley Janson, and Randal J. Verbrugge. 2019. “Thinking Outside the Box: Do SPF Respondents Have Anchored Inflation Expectations?” Working paper 19–15. Federal Reserve Bank of Cleveland. https://doi.org/10.26509/frbc-wp-201915.
- Coibion, Olivier, and Yuriy Gorodnichenko. 2015. “Is the Phillips Curve Alive and Well after All? Inflation Expectations and the Missing Disinflation.” American Economic Journal: Macroeconomics 7 (1): 197–232. https://doi.org/10.1257/mac.20130306.
- Dalla, Violetta, Liudas Giraitis, and Peter C. B. Phillips. 2020b. “Robust Tests for White Noise and Cross-Correlation.” Econometric Theory, September, 1–29. https://doi.org/10.1017/S0266466620000341.
- Haubrich, Joseph G. 2009. “A New Approach to Gauging Inflation Expectations.” Economic Commentary (Federal Reserve Bank of Cleveland), August, 1–4. https://doi.org/10.26509/frbc-ec-200908.
- Haubrich, Joseph, George Pennacchi, and Peter Ritchken. 2012. “Inflation Expectations, Real Rates, and Risk Premia: Evidence from Inflation Swaps.” Review of Financial Studies 25 (5): 1588–1629. https://doi.org/10.1093/rfs/hhs003.
- Knotek, Edward S., and Saeed Zaman. 2017. “Nowcasting U.S. Headline and Core Inflation: Money, Credit and Banking.” Journal of Money, Credit and Banking 49 (5): 931–68. https://doi.org/10.1111/jmcb.12401.
- Knotek, Edward S., and Saeed Zaman. 2019. “Financial Nowcasts and Their Usefulness in Macroeconomic Forecasting.” International Journal of Forecasting 35 (4): 1708–24. https://doi.org/10.1016/j.ijforecast.2018.10.012.
- Mertens, Elmar. 2016. “Measuring the Level and Uncertainty of Trend Inflation.” Review of Economics and Statistics 98 (5): 950–67. https://doi.org/10.1162/REST_a_00549.
- Meyer, Brent H., Guhan Venkatu, and Saeed Zaman. 2013. “Forecasting Inflation? Target the Middle.” Economic Commentary (Federal Reserve Bank of Cleveland), April, 1–4. https://doi.org/10.26509/frbc-ec-201305.
- Meyer, Brent, Nicholas B. Parker, and Xuguang Sheng. 2021. “Unit Cost Expectations and Uncertainty: Firms’ Perspectives on Inflation.” Working paper 2021–12. Federal Reserve Bank of Atlanta.
- Meyer, Brent, and Saeed Zaman. 2019. “The Usefulness of the Median CPI in Bayesian VARs Used for Macroeconomic Forecasting and Policy.” Empirical Economics 57 (2): 603–30. https://doi.org/10.1007/s00181-018-1472-1.
- Stock, James H., and Mark W. Watson. 2007. “Why Has U.S. Inflation Become Harder to Forecast?” Journal of Money, Credit and Banking 39 (January): 3–33. https://doi.org/10.1111/j.1538-4616.2007.00014.x.
- Tallman, Ellis W., and Saeed Zaman. 2017. “Forecasting Inflation: Phillips Curve Effects on Services Price Measures.” International Journal of Forecasting 33 (2): 442–57. https://doi.org/10.1016/j.ijforecast.2016.10.004.
- Tallman, Ellis W., and Saeed Zaman. 2020. “Combining Survey Long-Run Forecasts and Nowcasts with BVAR Forecasts Using Relative Entropy.” International Journal of Forecasting 36 (2): 373–98. https://doi.org/10.1016/j.ijforecast.2019.04.024.
Suggested Citation
Verbrugge, Randal J., and Saeed Zaman. 2021. “Whose Inflation Expectations Best Predict Inflation?” Federal Reserve Bank of Cleveland, Economic Commentary 2021-19. https://doi.org/10.26509/frbc-ec-202119
This work by Federal Reserve Bank of Cleveland is licensed under Creative Commons Attribution-NonCommercial 4.0 International

