

- Share
Custom Comparison Groups in the Integrated Postsecondary Education Data System
This Economic Commentary studies the behavior of colleges when they are asked to list a set of comparison group colleges in annual data reporting for the US Department of Education but are given little direction on how to do so. I find that, relative to themselves, colleges tend to list for comparison colleges that are more selective, are larger, and have better resources. One possible interpretation of these findings is that colleges overestimate where they stand relative to others, although an alternative interpretation is that colleges have accurate views but list comparison institutions based on aspirations.
The views authors express in Economic Commentary are theirs and not necessarily those of the Federal Reserve Bank of Cleveland or the Board of Governors of the Federal Reserve System. The series editor is Tasia Hane. This paper and its data are subject to revision; please visit clevelandfed.org for updates.
The market for higher education is similar to other markets in many ways, but there are also important differences. As one example, the firms in most markets are profit-seeking, but the objectives of the colleges and universities that supply higher education are not as clear.1 Although the for-profit sector has been growing in prominence in recent years, most institutions of higher education are not-for-profits. These institutions might be pursuing a variety of goals, including improving societal welfare, maximizing their own prestige, or providing satisfaction to their employees. These goals can sometimes conflict with one another, and, when that happens, it is not clear which one takes precedence.
This Economic Commentary attempts to shed light on the behavior of colleges in one specific setting by studying the institutions to which colleges compare themselves when given an opportunity to make such comparisons. As part of the US Department of Education’s Integrated Postsecondary Education Data System (IPEDS) data collection effort, colleges are asked to list a group of institutions that they will be compared to in a Data Feedback Report. The Data Feedback Report includes information on admissions, enrollment, graduation rates, and finances. Colleges are given little direction on how to form their comparison groups, and they thus have broad discretion to list whichever comparison institutions they choose.
Who do colleges compare themselves to in this situation? Do they compare themselves to peers, to institutions they aspire to be like, or to institutions to which they compare favorably? Does geographical proximity play a role? Do the answers to these questions differ between public colleges, private colleges, and for-profit colleges?2 I investigate these questions and, in doing so, shed light on which institutions colleges are paying attention to and might be using as a reference group. This may provide insight into how colleges view themselves, which may ultimately add to our understanding of their goals and objectives.
An additional purpose of this exercise is to study whether the custom comparison groups colleges list might be useful when conducting research about colleges. A control group is necessary when estimating the effects of policies and programs that cover specific colleges. A case could be made that colleges themselves have the best information about the colleges to which they are most comparable, and they might list these colleges as comparison institutions in IPEDS. As it turns out, though, it appears that colleges list institutions for comparison that are quantifiably different from themselves, a strategy which limits the usefulness of these data for research purposes.
IPEDS Data Feedback Reports
IPEDS is conducted every academic year and is roughly a census of higher education institutions in the United States. The National Center for Education Statistics (NCES) in the US Department of Education surveys these institutions about enrollment, finances, staffing, graduation rates, and other institutional characteristics.
Since 2004, the NCES has annually sent Data Feedback Reports to college presidents and the staff members responsible for submitting IPEDS data.3 These reports use a variety of variables (e.g., the average amount of financial aid received by undergraduate students or the number of full-time-equivalent staff broken down by occupational category) to compare each institution to the median value of a set of comparison institutions. Since 2005, institutions have been able to submit their own custom comparison groups.4 As noted earlier, colleges have broad discretion over which institutions to list as comparison institutions.
Interestingly, the data used for the Data Feedback Reports are available to the public online, and thus the institutions or any interested person could create something akin to a Data Feedback Report themselves. Despite this, a fairly large share of institutions submit a custom comparison group, thereby making public both the identities of the institutions they selected for comparison as well as how they compare to those institutions.
Analysis Sample and General Facts
I study four-year institutions in the 50 states and the District of Columbia. There are 3,105 such institutions in the IPEDS data for the 2017–2018 academic year, of which 1,668 submitted a custom comparison group. The total number of instances in which an institution was listed by another institution for inclusion in a comparison group was 30,897 for the 2018 Data Feedback Report. For the 2017 report, 29,635 instances were exactly the same. Moreover, 1,526 of the 1,668 institutions in the sample listed the exact same set of comparison institutions for 2017 and 2018. Because the custom comparison groups change so little over time, I limit subsequent analysis to the year 2018 for simplicity. The 2018 Data Feedback Reports use data collected during the 2017–2018 academic year.
As shown in figure 1, the sizes of the custom comparison groups created by the 1,668 institutions in the sample range from 2 to 100. The mean size of a comparison group is 18.5, and the median is 15. Many institutions select either 10 or 15 institutions for their comparison group, while a small number of institutions select a relatively large comparison group.
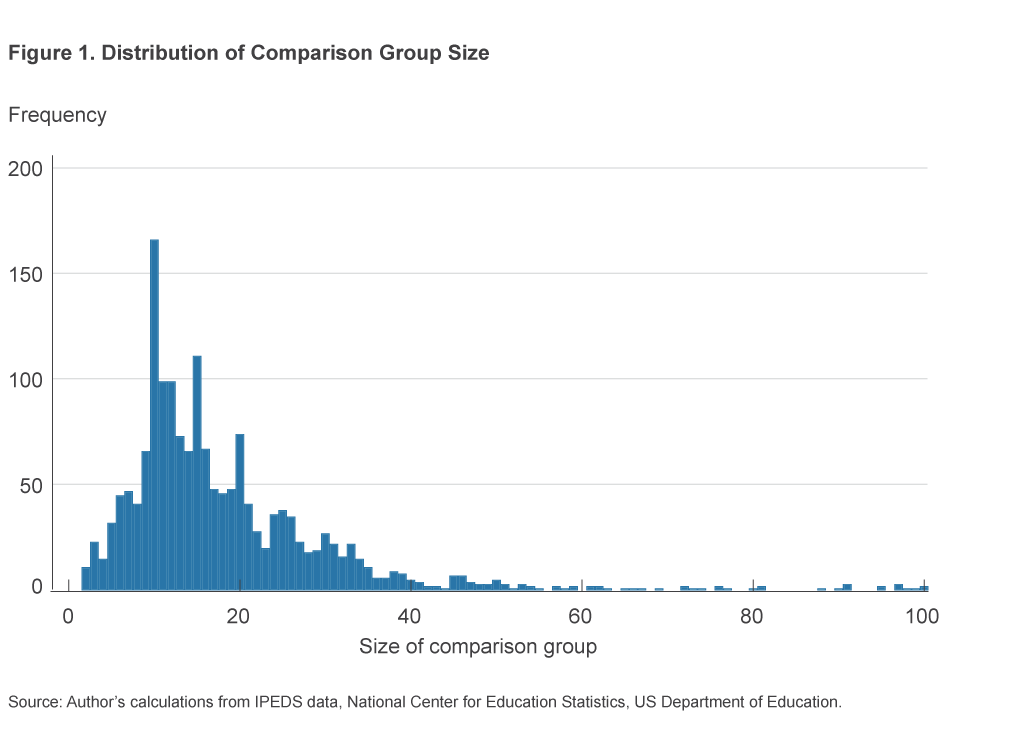
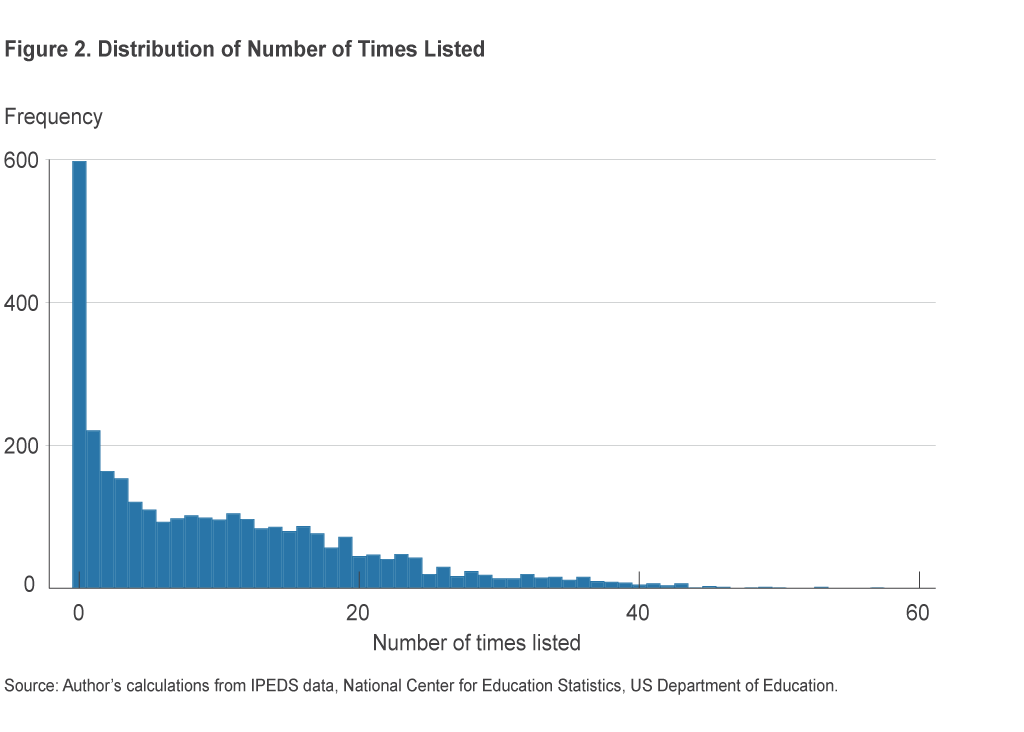
Figure 2 shows the distribution of the number of times an institution is listed by others. The most commonly listed institution is Carleton College, which is listed by 57 other institutions. Next are Kenyon College and Oberlin College, which are each listed 53 times. But there are nearly 600 institutions that are not listed by any other college, and most institutions are listed only a small number of times. Comparing these results from figure 2 to the results of figure 1 provides indirect evidence that there is asymmetry in being listed.
To consider this asymmetry more directly, of the 30,897 comparison group listings, in 6,692 cases the listed institution did not specify its own custom comparison group. Of the remaining 24,205 cases, in only 5,209 cases did the institution reciprocally list the institution that had listed it.5As one specific example, Harvard University lists three comparison institutions: Princeton University, Stanford University, and Yale University. Stanford and Yale reciprocate by listing Harvard, whereas Princeton does not list a custom comparison group. But in addition to Stanford and Yale, there are 25 other institutions that list Harvard in their comparison groups. As alluded to earlier, it is not clear whether these 25 institutions consider Harvard to be an equal peer or an aspirational benchmark. But whatever the case may be, one college’s listing another clearly does not imply being listed by that institution in return.
Characteristics of Comparison Groups
The results in table 1 make it clear that, relative to themselves, colleges tend to list for comparison colleges that are more selective, are larger, and have better resources.6 For example, comparison institutions have an average acceptance rate of 64.0 percent, relative to 66.3 percent at listing institutions. Comparison institutions pay instructional staff nine-month salaries of $74,707 on average, relative to $69,968 at listing institutions. Comparison institutions enroll 8,551 students on average, relative to 6,660 students at listing institutions. And the six-year graduation rate at comparison institutions is 58.4 percent, relative to 53.0 percent at listing institutions. One interpretation of these findings is that colleges overestimate where they stand relative to others, although an alternative interpretation is that colleges have accurate self-assessments but list comparison institutions based on aspirations. In any event, the fact that colleges do not appear to be listing institutions that are equal peers limits the utility of the data for researchers looking for suitable control groups to use when conducting empirical analyses of higher education policies and programs.
| Characteristic | Comparison | Own | Difference |
|---|---|---|---|
| Acceptance rate | 64.0% | 66.3% | −2.4 pp |
| SAT score | 1163 | 1132 | 31 |
| ACT score | 24.4 | 23.6 | 0.8 |
| In-state tuition and fees | $24,363 | $22,494 | $1,869 |
| Nine-month salary for | |||
| Full professors | $98,564 | $91,332 | $7,232 |
| All instructional staff | $74,707 | $69,968 | $4,739 |
| Student-to-faculty ratio | 14.2 | 14.1 | 0.1 |
| Total enrollment | 8,551 | 6,660 | 1,890 |
| Total number of employees | 2,009 | 1,407 | 601 |
| Number of instructional staff | 688 | 516 | 172 |
| Six-year graduation rate | 58.4% | 53.0% | 5.4 pp |
Notes. The table shows means weighted by the reciprocal of the number of institutions listed by the listing institution. The SAT score is the average of the 25th and 75th percentiles on the math section, added to the average 25th and 75th percentiles on the verbal section. The abbreviation “pp” stands for “percentage points.” Due to rounding, numbers in the “Difference” column may not equal the differences between the “Comparison” and “Own” columns.
Source: Author’s calculations from IPEDS data, National Center for Education Statistics, US Department of Education.
Notably, geographical proximity does not seem to be a dominant factor in forming a comparison group. Table 2 shows that only about 28.3 percent of the listed comparison institutions are in the same state as the listing institution. For those cases in which the listing institution is located in either a metropolitan statistical area or a micropolitan statistical area, only 13.6 percent of the comparison institutions are in the same primary statistical area and only 10.1 percent are in the same core-based statistical area.7 These percentages are higher than they would be if colleges were picking comparison groups completely at random from the set of all colleges across the United States, but they do not suggest a situation in which comparison groups are highly geographically concentrated.
| Comparison institution is in... | Percentage of comparison institutions |
|---|---|
| Same state as listing institution | 28.3 |
| Same PSA as listing institution | 13.6 |
| Same CBSA as listing institution | 10.1 |
Notes. The table shows percentages weighted by the reciprocal of the number of institutions listed by the listing institution. “PSA” stands for “primary statistical area,” and “CBSA” stands for “core-based statistical area.” “Same PSA” and “Same CBSA” are calculated only for listing institutions in a metropolitan or micropolitan statistical area.
Source: Author’s calculations from IPEDS data, National Center for Education Statistics, US Department of Education.
Table 3 reveals an interesting result about for-profit institutions: While public colleges generally list other public colleges and private colleges generally list other private colleges, for-profits more evenly list all three types of institutions. Although it is difficult to know exactly what to make of this, it is noteworthy that for-profit colleges apparently do not consider themselves to be isolated from other types of colleges. Rather, they look to public and private colleges as a source of comparison.
| Listing institution is | Percentage of listed institutions that are | ||
|---|---|---|---|
| Public | Private | For-profit | |
| Public | 94.7 | 5.0 | 0.3 |
| Private | 4.6 | 93.6 | 1.9 |
| For-profit | 22.0 | 34.0 | 44.1 |
Note. The table shows percentages weighted by the reciprocal of the number of institutions listed by the listing institution.
Source: Author’s calculations from IPEDS data, National Center for Education Statistics, US Department of Education.
Although not shown here, I find that the general result that colleges list for comparison colleges that are more selective, are larger, and have better resources is the same for public, private, and for-profit institutions. However, for-profit institutions tend to have smaller comparison groups, are listed less often by other institutions, and have a larger gap between their own characteristics and comparison group characteristics.
Conclusion
The comparison institutions listed for the IPEDS Data Feedback Reports offer an opportunity to gain insight into the behavior and decisionmaking of colleges in the United States. I find that, relative to themselves, colleges tend to list for comparison colleges that are more selective, are larger, and have better resources. One interpretation of these findings is that colleges overestimate where they stand relative to others, although an alternative interpretation is that colleges have accurate views but list comparison institutions based on aspirations.
Footnotes
- Hereafter I use the term “colleges” to refer to both colleges and universities. Return to 1
- Despite the fact that for-profit colleges are technically private colleges as well, I use the term “private colleges” to refer only to not-for-profit private colleges. Return to 2
- The Data Feedback Reports from 2005 on are available at https://nces.ed.gov/ipeds/use-the-data. Click on “Data Feedback Report” and enter the name of an institution. Return to 3
- If an institution does not submit a custom comparison group, the National Center for Education Statistics chooses the comparison group. Return to 4
- It may seem that the number of reciprocal listings should be an even number because each case in counted twice. But in this situation, it happens to be an odd number because in some cases a comparison group institution is not a four-year institution within the 50 states or the District of Columbia. I do not include such cases in the sample of 3,105 institutions but do study their characteristics as a comparison institution if they are listed as a comparison institution by one of the 3,105 institutions in the sample. Return to 5
- The results shown here weight each observation (i.e., combination of a listing institution and listed institution) by the reciprocal of the number of institutions listed by the listing institution so as to weight the listing institutions equally. The reason for this is to avoid giving extra weight to an institution simply because it has listed a large number of comparison institutions. However, the results are generally qualitatively similar when giving all observations equal weight. The one exception is that the student-to-faculty ratio at comparison institutions is slightly higher than at the listing institutions when weighting all observations equally. Return to 6
- A “core-based statistical area” is either a metropolitan statistical area or a micropolitan statistical area, while a “primary statistical area” is a combined statistical area (i.e., a combination of core-based statistical areas) or a core-based statistical area that is not part of a combined statistical area. Return to 7
Suggested Citation
Hinrichs, Peter L. 2019. “Custom Comparison Groups in the Integrated Postsecondary Education Data System.” Federal Reserve Bank of Cleveland, Economic Commentary 2019-04. https://doi.org/10.26509/frbc-ec-201904
This work by Federal Reserve Bank of Cleveland is licensed under Creative Commons Attribution-NonCommercial 4.0 International

