Wage Growth after the Great Recession
Nominal wage growth since the Great Recession has been sluggish. We show that the sluggishness is due mostly to weak growth in labor productivity, as well as lower-than-expected inflation. We also find that wage growth since late 2014 has actually been above what would be consistent with realized labor-productivity growth and inflation, and this trend in wages reflects an increase in labor’s share of income. We show evidence that this increase in the labor share may be due to a reversal of the trend to replace labor with capital.
The views authors express in Economic Commentary are theirs and not necessarily those of the Federal Reserve Bank of Cleveland or the Board of Governors of the Federal Reserve System. The series editor is Tasia Hane. This paper and its data are subject to revision; please visit clevelandfed.org for updates.
Many commentators have noted that nominal wage growth has been lower than expected since the end of the Great Recession (see, for example, Danninger 2016). In particular, nominal wage growth was below trend from late 2009 to early 2015—the period covered by most studies—despite a decrease in unemployment. Most studies would project nominal wage growth to be around 3.5 percent in this period (see Barrow and Faberman 2015 and Dolega 2016, for example), but according to Bureau of Labor Statistics (BLS) data, realized year-over-year growth in hourly compensation was just 2.1 percent. If we consider the entire post-Great Recession period (from 2009:Q3 to 2016:Q2), average growth in hourly compensation has been 2.2 percent.
We investigate how far realized nominal wage growth has been from what would be consistent with its “fundamentals”—realized productivity growth and inflation. We find that fundamentals explain most of the sluggishness in wage growth since the Great Recession: Labor productivity growth has been lower than projected, and inflation has been lower than expected. We also find that since late 2014, the situation has reversed, and wage growth has been above what would be consistent with realized labor productivity growth and inflation. We show that this overperformance of wages is due to an increase in labor’s share of income, and that the increase in labor’s share is likely due to a reversal in the trend to replace labor with capital.
Actual and Estimated Wage Growth
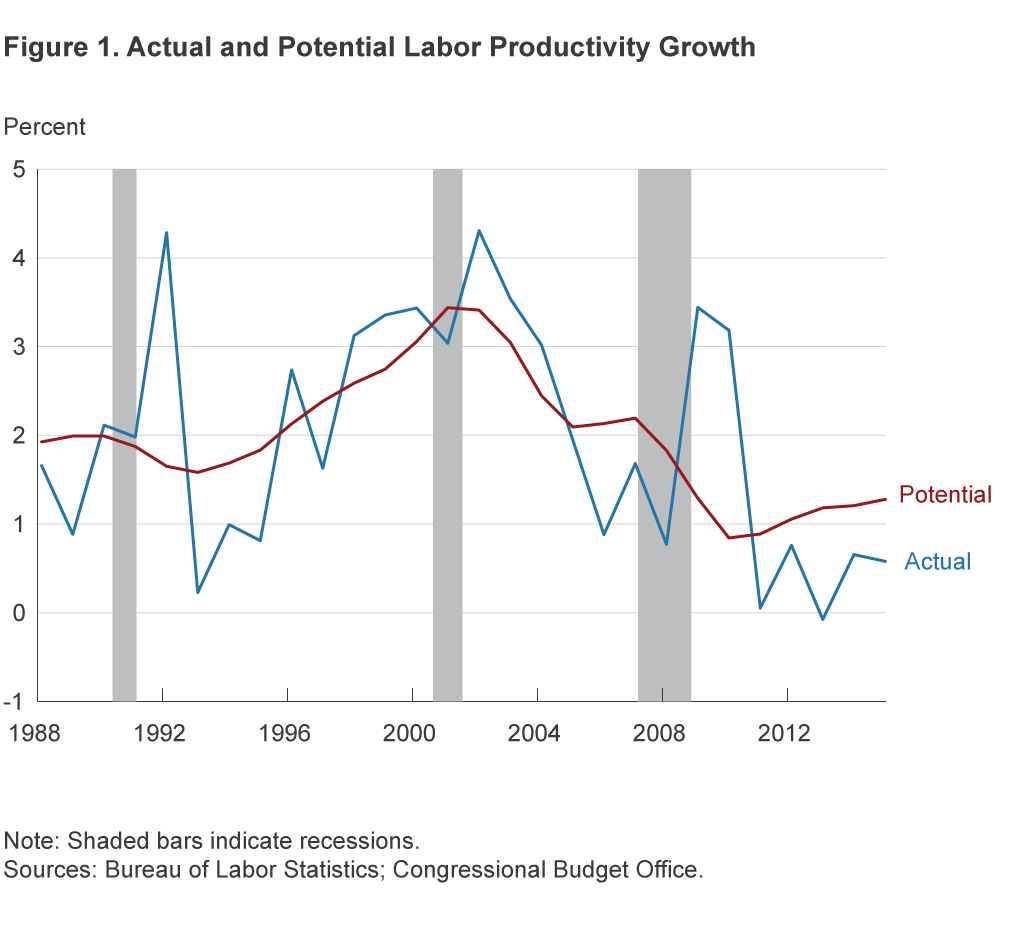
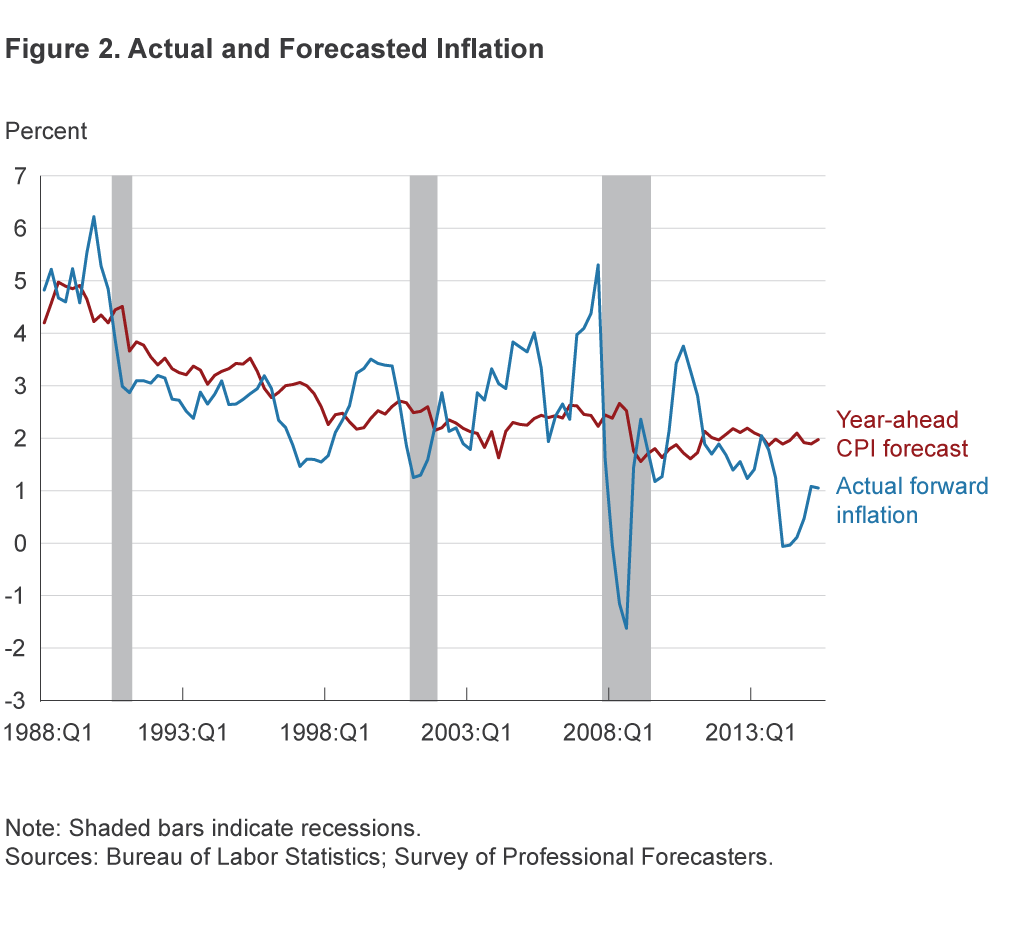
Wage growth is a function of labor productivity and inflation, and both of these have been lower than forecasters expected in recent years. Actual productivity growth (real output per hour) has been significantly below the Congressional Budget Office’s (CBO) estimates of potential labor productivity growth since 2011 (figure 1). Meanwhile, CPI inflation has been consistently below the inflation forecast of the Survey of Professional Forecasters (SPF) since 2011 (figure 2).
Can the poor performance of labor productivity growth and lower-than-expected inflation explain low realized wage growth? In order to answer this question, we consider a very simple economic model in which there is a competitive market with identical firms that produce a single good and use labor as their only input. Firms take both product and input prices as given. Based on this model, we obtain:1
Nominal wage growth ≈ inflation + labor productivity growth.
The model allows us to compare the nominal wage growth that would be consistent with realized inflation and productivity growth to actual nominal wage growth (figure 3). To calculate the inflation rate, we use the CPI; to calculate wage growth and productivity, we use compensation per hour and the labor productivity series from the BLS’s Major Sector Productivity and Costs database because they are consistently measured and consequently comparable. Although we use the CPI for inflation, our results are robust to alternative measures (PCE, core PCE, and core CPI, for example).
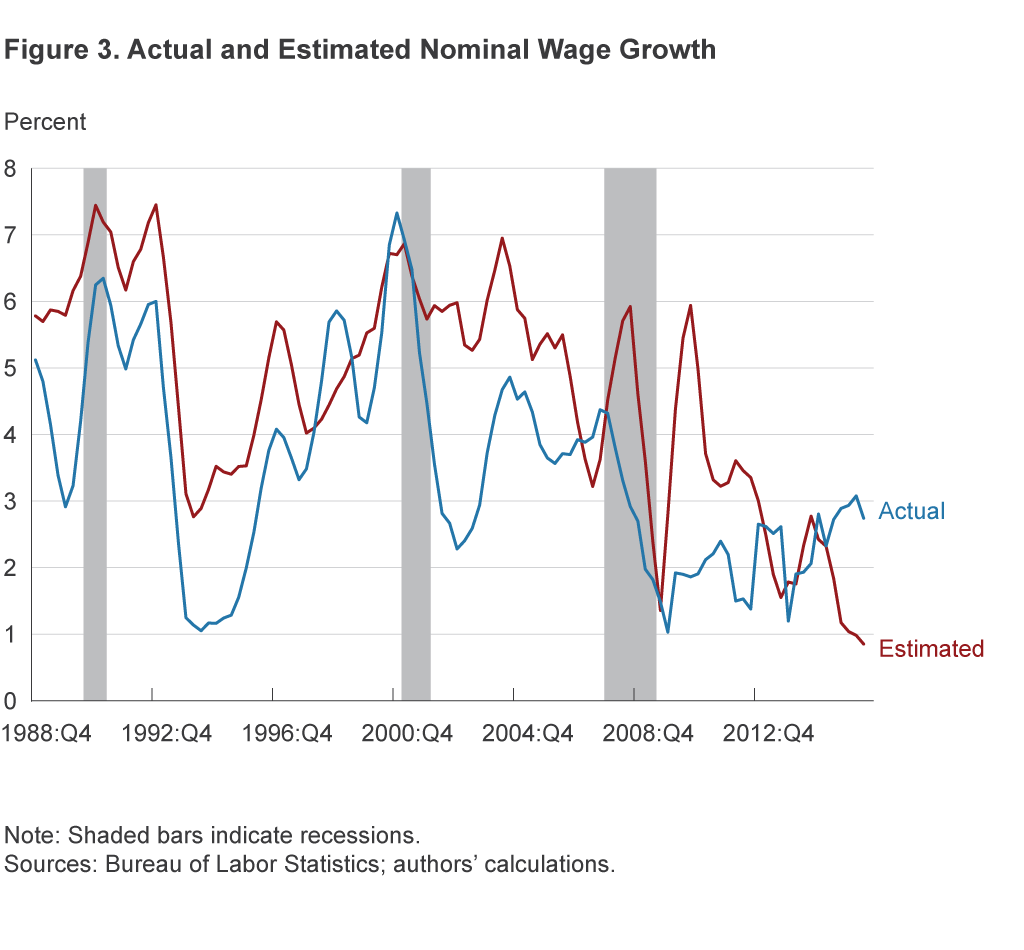
Notice that actual nominal wage growth is usually below what would be consistent with realized inflation and productivity growth, a fact that has been highlighted by Fleck, Glaser, and Sprague (2011), among others. Interestingly, this pattern has recently reversed. Since 2014:Q4, actual wage growth has been consistently above what would be expected given realized inflation and productivity growth.
While we would expect short-term deviations between compensation and labor productivity, the long-run gap has attracted economists’ attention. There are two leading explanations for the gap. The first attributes the gap to the fact that two different deflators are used to adjust the data for each series. The GDP deflator is used to adjust labor productivity, and the CPI is used for the wage-growth-consistent measure. The second explanation attributes the difference between the two series to changes in labor’s share of income over time. Elsby, Hobijn, and Sahin (2013) point out that the labor share stayed nearly constant between the 1950s and the mid-1980s, but it has fallen consistently in the past 25 years. Moreover, evidence shows that the decline has sped up since 2000. According to Fleck, Glaser, and Sprague (2011), the decrease in labor’s share is responsible for the bulk of the compensation–productivity gap seen in 2000 through 2009.
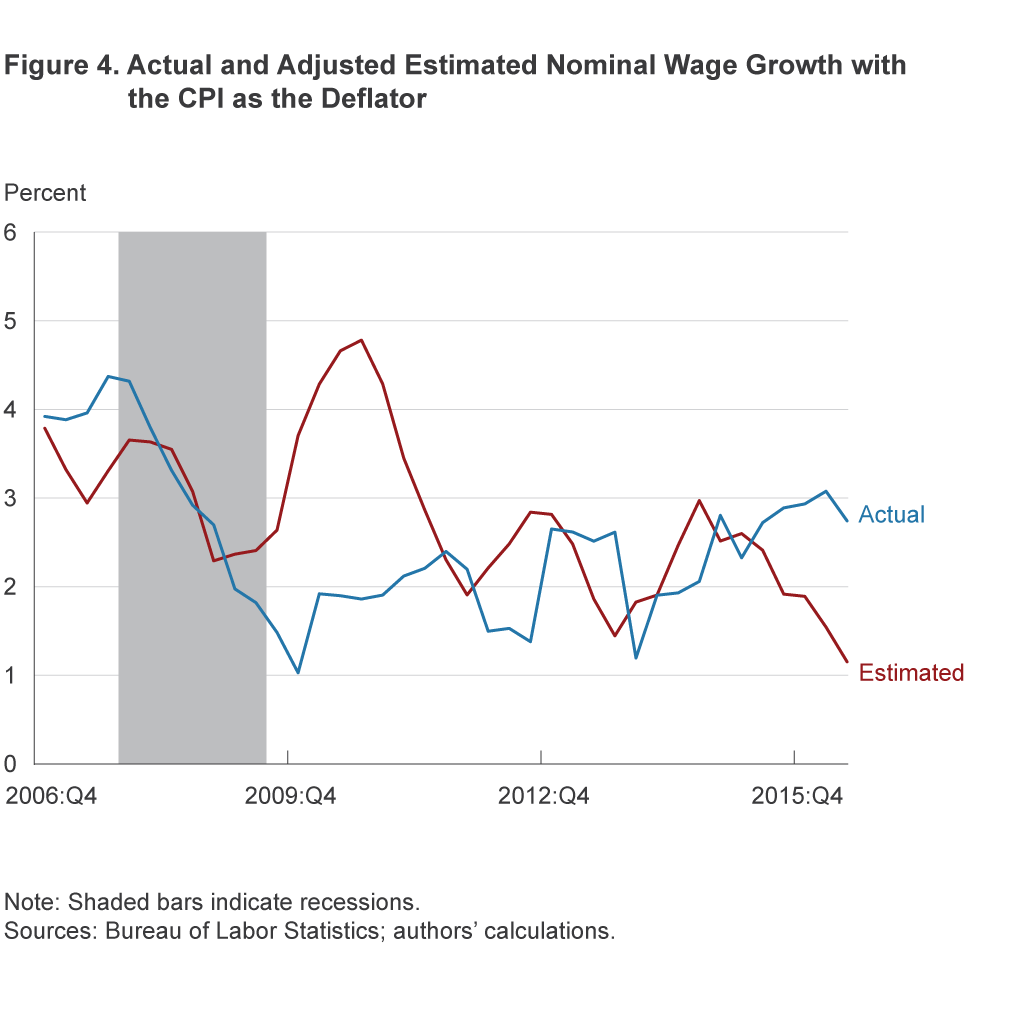
We investigate the evidence for both explanations. First, we adjust the labor productivity-growth series using the CPI as the deflator and recreate figure 3 with the resulting series (figure 4). While figures 3 and 4 are not identical, the qualitative results are the same. Consequently, while the differences in deflators may be important, they can’t explain the difference between predicted and actual wage growth after 2006.
Next, we take a closer look at the labor share explanation. As we can see in figure 5, the labor share has increased consistently since 2015:Q1, while it was flat or decreasing for most of the period from 2001 to 2015.
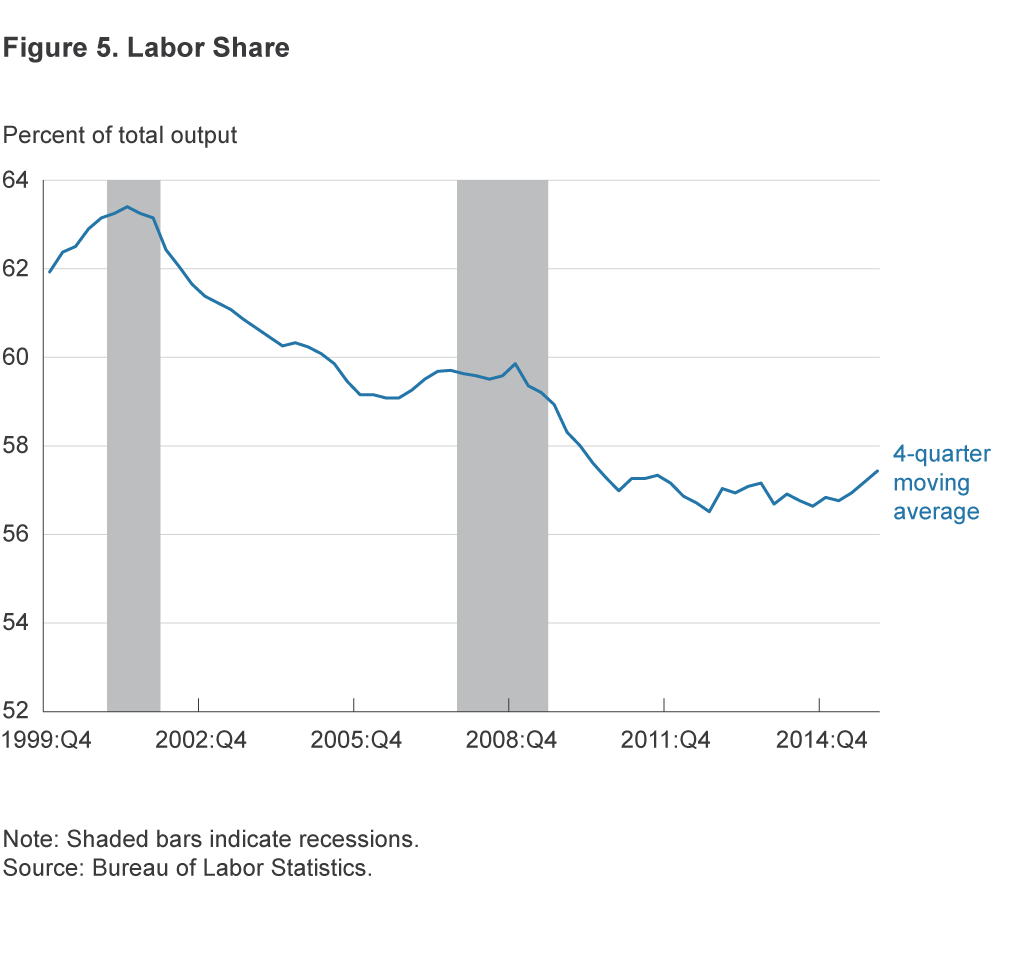
This change in the labor share may suggest that companies are replacing workers who perform routine jobs by automating or offshoring those jobs (Acemoglu and Autor 2011). By displacing a portion of a firm’s labor force, the automation process reduces the firm’s total wage costs and consequently the share of the total output that goes to labor. Moreover, the threat of further automation reduces workers’ bargaining power, depressing wage growth. Finally, the replacement process tends to occur at the middle of the wage distribution, inducing not only an increase in wage inequality, but also usually depressing average wages, as the number of workers negatively affected by automation (mid-skill workers) is significantly larger than the number of workers who may benefit from it (high-skill workers). A similar argument can be made for the offshoring process.
In terms of the timing of this substitution of capital for labor in the business cycle, Jaimovich and Siu (2015) show that the process is concentrated around recessions and jobless recoveries. Their explanation is supported by Sprague (2014)’s observation that hours dropped significantly more than output during the Great Recession. In addition, output recovered at a much faster pace than hours after the end of the Great Recession, generating rapid productivity growth in 2009 through 2010. By contrast, the later period of low productivity growth (2011 on) is one in which we observe output and hours moving in lockstep. This pattern suggests that the replacement of workers through automation may have run its course, with current job growth being concentrated in areas in which automation is not economically profitable (jobs that demand either abstract or hard-to-automate manual skills).
In order to investigate the evidence of a change in the trend to substitute capital for labor, we must extend our initial model for the case in which capital is also a productive input, and firms must choose which combination of capital and labor they will use in production. This generalization implies that we must adjust the BLS’s labor productivity measure—output per hour—by subtracting the contribution of capital to production, which we do with the BLS’s Capital Intensity series:
Labor productivity = output per hour − capital intensity.
Consequently, we must adjust our measure of labor productivity for the presence of capital (machines, equipment, buildings, etc.) using the data available in the BLS’s Major Sector Multifactor Productivity series. Unfortunately, the time series on capital intensity ends in 2014. Figure 6 shows our results for the available data.
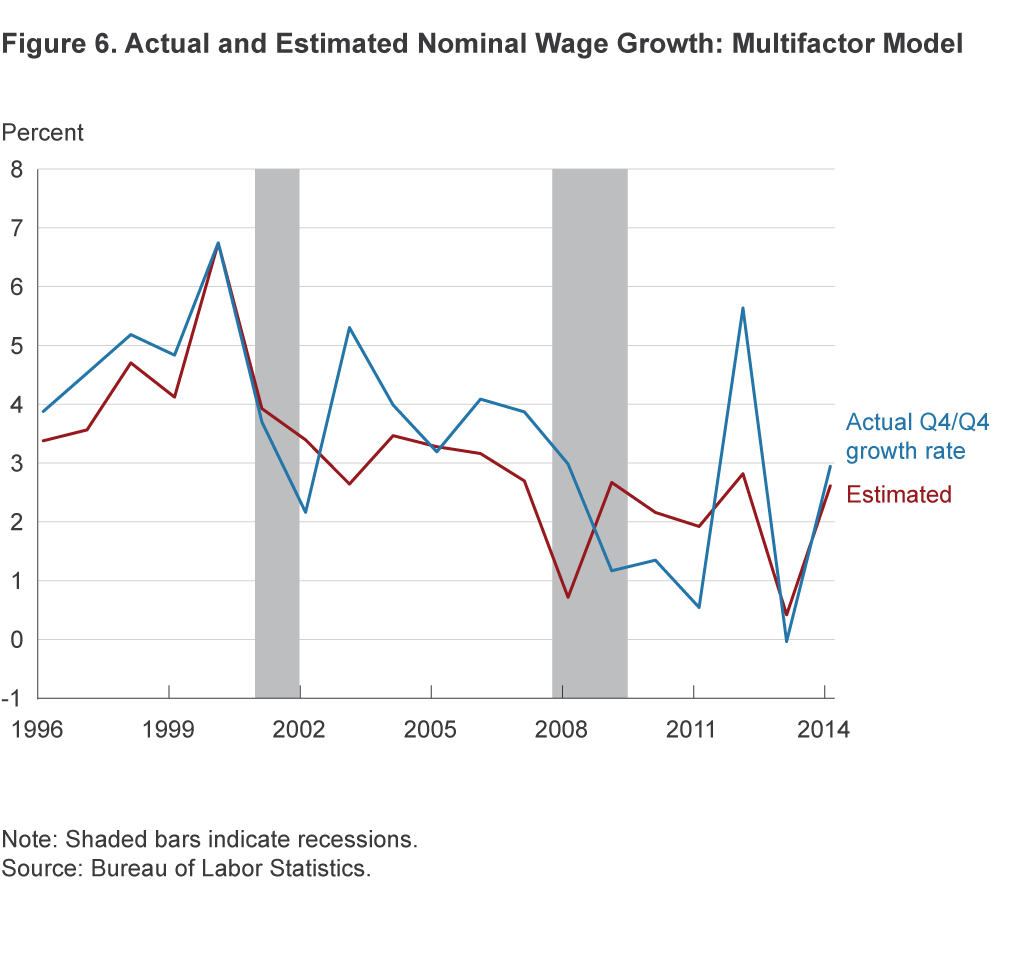
Once we adjust for the possible change in substitutability across inputs, the observed wage growth is in line with fundamentals from 2013 on. Moreover, the gap between the wage growth consistent with fundamentals and actual wage growth shrinks significantly. In addition, notice that the jump in productivity around 2010 observed in figures 3 and 4 does not appear in the estimated wage growth series once we adjust for capital intensity. In summary, the expected gain in output per hour in figures 3 and 4 can be traced back to an increase in capital intensity that boosted output. Once we control for changes in capital intensity, the expected wage growth is significantly reduced.
The results depicted in figure 6 provide evidence that not only has the gap between actual wage growth and the wage growth consistent with fundamentals narrowed since late 2013, it has actually reversed, with realized wage growth being above “consistent” wage growth since late 2014. Moreover, most of the reversal is due to a rise in the labor share in the last year and a half, given the reversal of the capital-for-labor substitution pattern observed during the previous years.
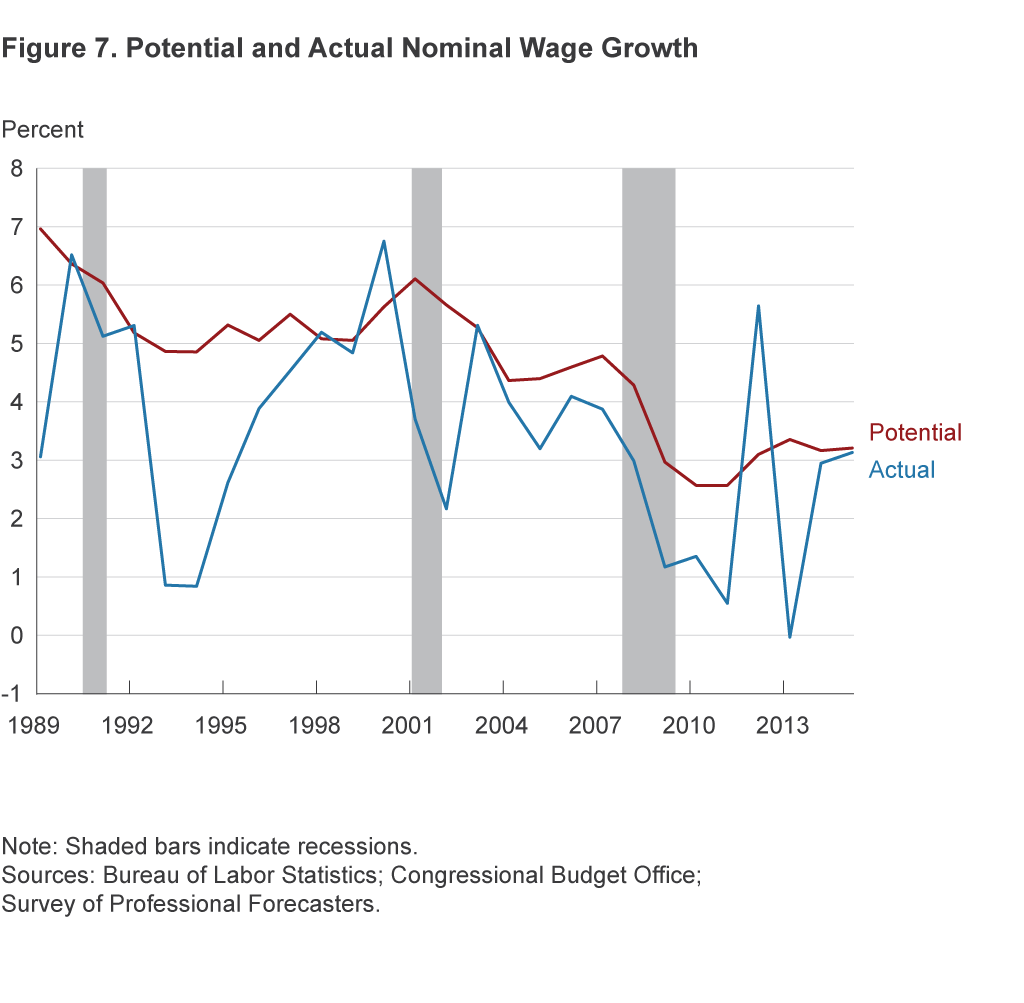
We end our discussion by comparing actual wage growth with potential wage growth, where potential is based onthe CBO’s estimates of potential labor productivity and the SPF’s inflation forecast (figure 7). While actual wage growth is consistently below potential even in the pre-recession period, the gap has narrowed considerably in the last two years for which we have complete information (2014 and 2015). Overall, the gap in the later years has narrowed due to both a decrease in expectations about future inflation and productivity growth and a reduction in the substitution of capital for labor, with an increase in the labor share. The future behavior of the gap between actual and expected wage growth will likely depend on how labor productivity evolves over time compared to the expected trend.
Conclusion
We have shown that wage growth has been low in the post-recession period mostly because labor productivity growth has been slow and inflation has been below expectations. In fact, nominal wage growth has surpassed what should be expected based on these fundamental determinants—realized labor productivity growth and inflation—since late 2014. Consequently, our analysis indicates that potential solutions to low wage growth must involve a boost in productivity growth. Policies that induce investment in innovation through increased entrepreneurship and market competition seem a natural starting point toward this goal.
Footnotes
- Calculations are based on log changes. Return to 1
References
- Acemoglu, Daron, and David Autor, 2011. “Skills, Tasks, and Technologies: Implications for Employment and Earnings,” in Handbook of Labor Economics, vol. 4B, 1043–1278.
- Barrow, Lisa, and Jason Faberman, 2015. “Wage Growth, Inflation, and the Labor Share,” Federal Reserve Bank of Chicago, Chicago Fed Letter, No. 349.
- Danninger, Stephan, 2016. “What’s Up with US Wage Growth and Job Mobility?” International Monetary Fund, Working Paper No. 16/122.
- Dolega, Michael, 2016. “American Workers Due for Pay Raise: In Defense of the Phillips Curve,” TD Economics, Special Report, June 22.
- Elsby, Michael W.L., Bart Hobijn, and Aysegul Sahin, 2013. “The Decline of the US Labor Share,” Brookings Papers on Economic Activity, Fall: 1–52.
- Fleck, Susan, John Glaser, and Shawn Sprague, 2011. “The Compensation–Productivity Gap: A Visual Essay,” Monthly Labor Review, January: 57–69.
- Jaimovich, Nir, and Henry E. Siu, 2015. “Job Polarization and Jobless Recoveries,” unpublished manuscript.
- Sprague, Shawn, 2014. “What Can Labor Productivity Tell Us about the US Economy?” Bureau of Labor Statistics, Beyond the Numbers, 3(12).
Suggested Citation
Pinheiro, Roberto B., and Meifeng Yang. 2017. “Wage Growth after the Great Recession.” Federal Reserve Bank of Cleveland, Economic Commentary 2017-04. https://doi.org/10.26509/frbc-ec-201704
This work by Federal Reserve Bank of Cleveland is licensed under Creative Commons Attribution-NonCommercial 4.0 International
- Share


