- Share
Geographic Mobility and Consumer Financial Health: Evidence from Oil Production Boom Towns
One way a household might handle financial distress is to relocate to another area that offers greater income opportunities. This article examines the impact of geographic mobility on consumer finances by focusing on the residents of “boom town?” —areas that saw a surge of growth in oil-drilling activity around 2010 and a bust thereafter. We find that residents who move after the bust experience stronger consumer financial health than residents who stay put.
The views authors express in Economic Commentary are theirs and not necessarily those of the Federal Reserve Bank of Cleveland or the Board of Governors of the Federal Reserve System. The series editor is Tasia Hane. This paper and its data are subject to revision; please visit clevelandfed.org for updates.
Why and how some households maintain sound financial health and others do not is a subject that is attracting growing interest among academics and policymakers. Consumer finances have first-order effects on household welfare (Brown, Cookson, and Heimer, 2016), and spillover impacts on entrepreneurship, asset price fluctuations, and business cycle dynamics (Corradin and Popov, 2015; Mian and Sufi, 2011; Iacoviello and Pavan, 2013). Yet despite the interest in the topic, the factors that determine household financial health are still not well understood. Some have considered individual factors such as financial literacy (Lusardi and Mitchell, 2011) or deviations from classical economic decision making (Karlan and Zinman, 2010). Others consider differences in the supply of financial services to households (e.g., Celerier and Matray, 2015). Yet there is substantial room for further explanation.
One way households might temper financial distress is to relocate to areas that offer more income opportunities if they are able or willing to move. Geographic mobility thus has the potential to mitigate declines in consumer financial health following a negative income shock. We investigate the effect of geographic mobility on consumer financial health by focusing on communities impacted by the recent boom and bust of oil drilling in the United States.
We find that geographic mobility following the bust is associated with stronger consumer financial health. As these boom towns start to experience a decline in production, residents who are able to relocate have lower credit utilization, lower past-due balances, and fewer delinquent accounts, all while having more new originations and higher credit limits in the period after the boom.
Oil Rig Activity in Boom Towns
Our analysis focuses on the residents of “boom towns”—areas that experienced a marked increase in oil-drilling activity starting in 2010 and a bust sometime thereafter. These areas contain both long-term residents who are less geographically mobile and temporary workers who are highly mobile and move with the boom-and-bust cycle. By comparing the effects of the decline in oil drilling on the financial health of permanent residents and the transitory workers, we estimate the effect of geographic mobility on consumer financial health.
We consider the installation of oil drilling rigs as shocks to the economic activity in a given area that have quickly dissipated. We focus on the number of rigs as an indicator of the boom because drilling rigs are the most labor-intensive part of the oil well production process (Jacobsen and Parker, 2014). Despite sharp differences in mobility, both population groups temporarily benefit economically from the boom in oil drilling. We then use the New York Fed–Consumer Credit Panel (FRBNY–CCP) to track consumers who live in these communities, comparing those who are geographically mobile following the decline in oil production and those who are not.
Active rig counts on land in the United States skyrocketed from 823 in mid-June 2009 to 1,974 by the beginning of November 2011, an increase of 140 percent (figure 1). The active rig count remained high until the beginning of December 2014, when there was a sharp decline from 1,848 rigs to 397 by the end of June 2016, reaching a low we have not seen since 1999.
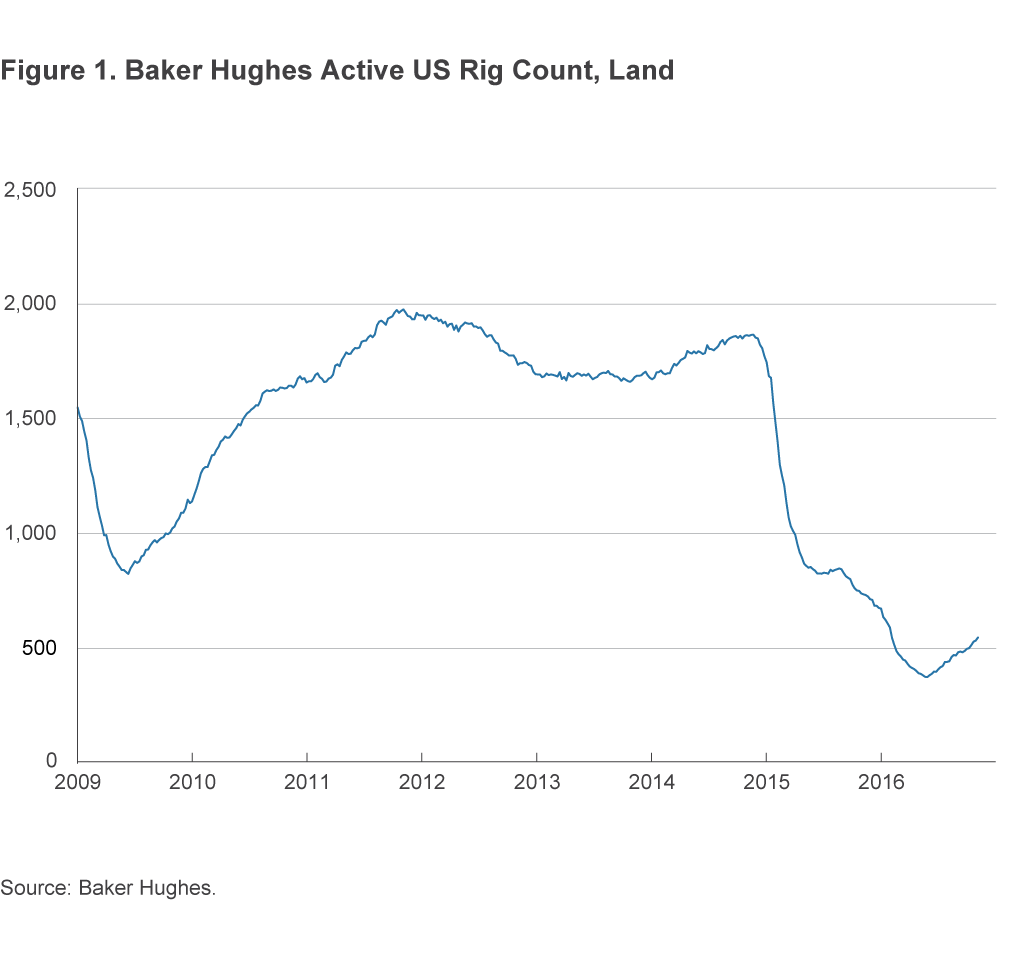
The decline in active oil rigs coincides with a sharp drop in the price of crude oil. In July 2014, the cost of West Texas Intermediate crude oil was about $104 per barrel, but by December 2014 it had plunged to $59 per barrel. The price of oil has continued to decline, and in September 2016 it was $45 per barrel.
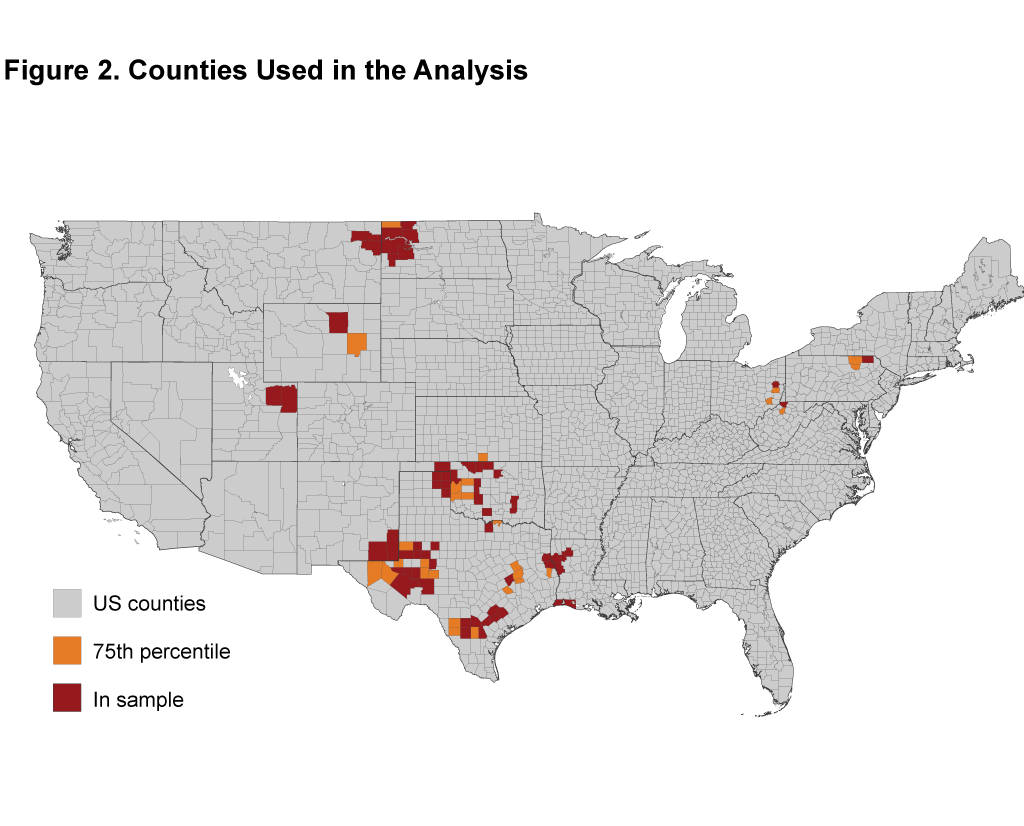
We use county-level oil rig counts from Baker Hughes, available beginning in mid-2011, scaled by population, as an indicator for how much oil-drilling activity is happening in a local area. The effects of this rapid upsurge and decline in oil rig counts were concentrated in a few areas of the United States. To identify counties where employment would be most affected by this boom–bust cycle, we first selected counties where rig counts per person were particularly high—within the 75th percentile for all counties with active rigs. We then looked at those counties where the active oil-rig count declined dramatically during the past few years. Specifically, we looked at counties in which the rig count fell by at least 50 percent over a one-year period. This left us with observations in 14 states (figure 2).1 We also dropped some counties that did not have a large enough sample of individuals in the FRBNY–CCP who would be considered geographically mobile, leaving us with those counties marked as “in sample” in figure 2.
Consumer Financial Activity
To consider how consumer financial activity evolves in conjunction with the boom and bust activity in these communities, we develop a panel of FRBNY–CCP accounts, which we standardize across time relative to the peak of rig activity in a given county.2 For example, the peak of active rig activity occurred in 2011:Q2 for Wheeler County, Texas, and in 2014:Q1 for Johnson County, Wyoming, and for both cases we set these dates as period zero. We then examine consumer financial activity before and after this peak. We focus on revolving credit utilization, the number of derogatory accounts, the total amount of dollars past due, the total number of open accounts, and total high credit amounts. The first three indicators were chosen as measures of financial distress for the individual, while the latter two are factors that measure the demand for consumer financial products.
Figure 3 shows that the peak in rig activity occurred in different quarters across different counties in our sample. Because of this, we have some confidence that any trends we observe in the consumer financial data are not just capturing aggregate effects across the US economy more broadly.
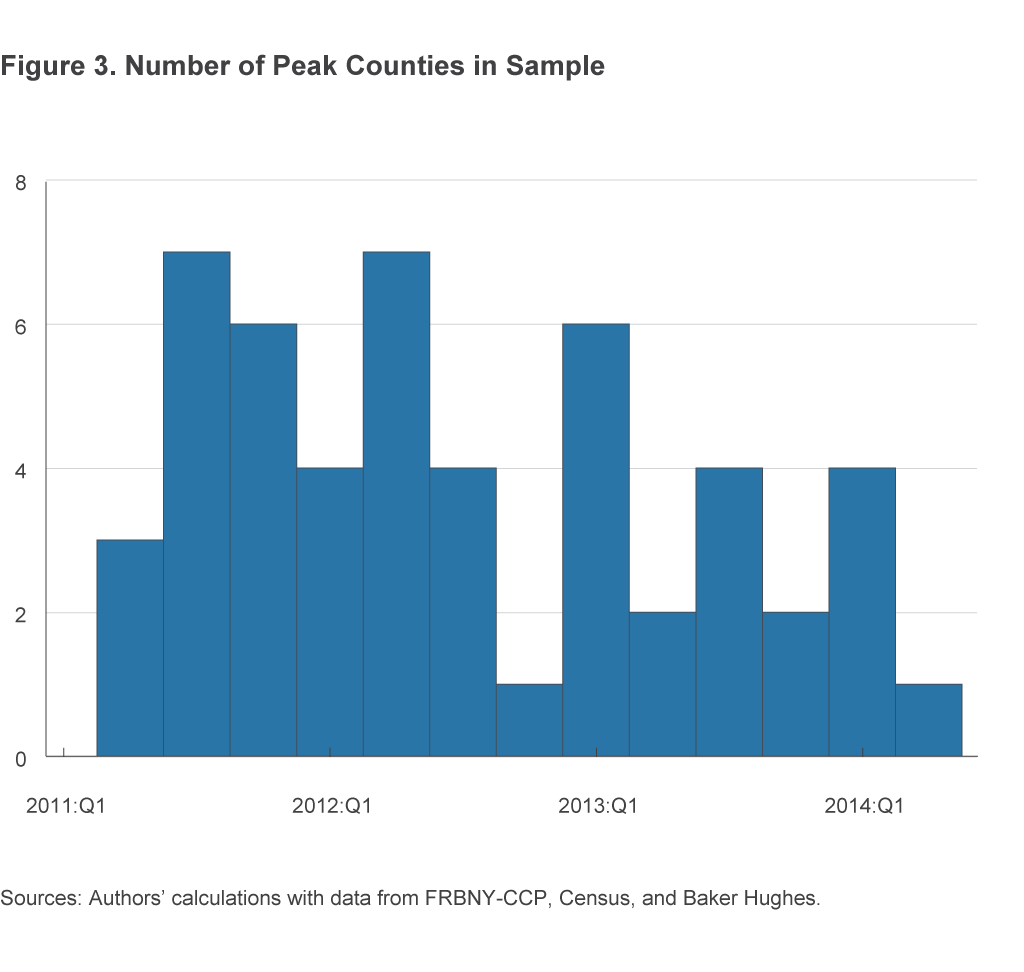
Figure 4 shows the evolution of consumer financial health for those who leave and those who stay in these boom towns following the peak in oil rig activity.
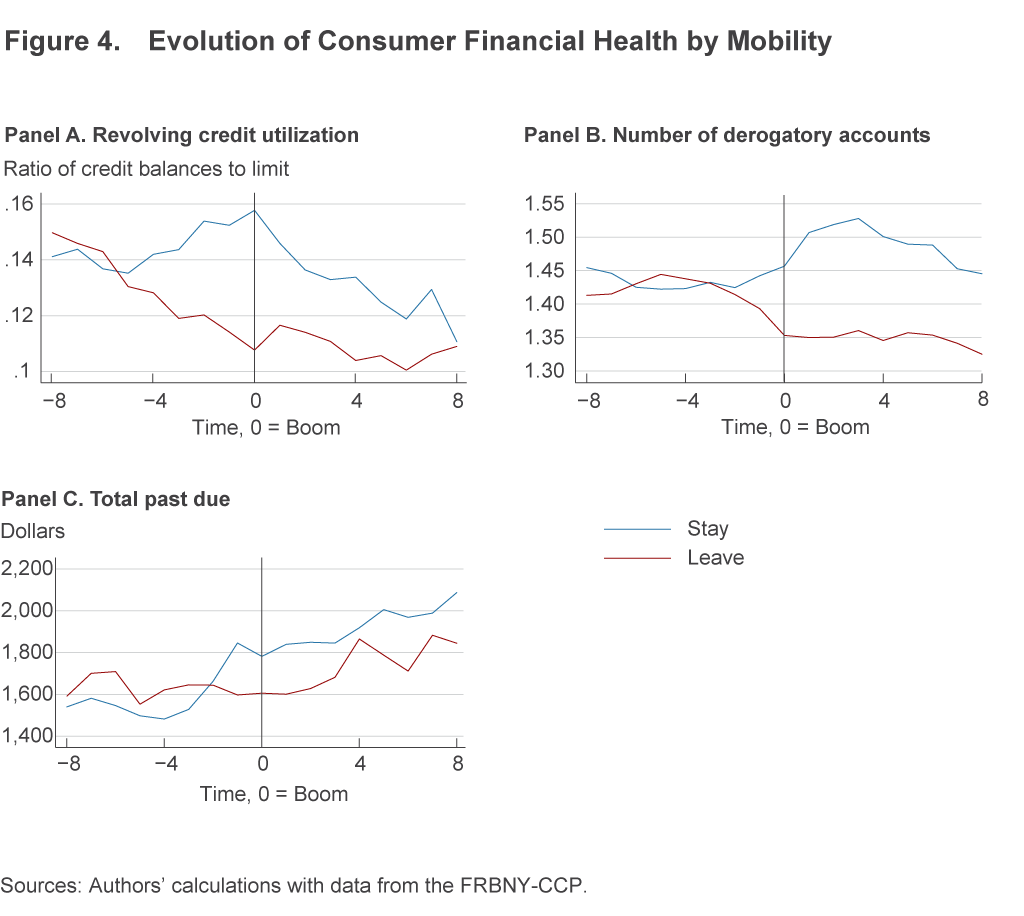
Panel A plots revolving credit utilization, which measures financial health because a balance nearing the consumer’s credit limit suggests the potential for subsequent delinquencies. Five quarters prior to the peak of rig activity, credit utilization rates are about equal for those who stay and those who leave (14 percent). Then, for consumers who leave, the utilization rate falls and stays persistently below the utilization rate of the portion of the sample that does not leave by about 2 to 3 percentage points. Panel B shows the number of consumers with derogatory accounts (serious delinquencies or late payments). The two groups have roughly equal numbers of such accounts (1.45) until about two quarters prior to peak rig activity. These samples then diverge, with those who stay in boom towns seeing about a 0.05 increase in the number of derogatory accounts, while those who leave see about a 0.1 reduction.
Similar effects are found in past due balances (panel C). After the peak in rig activity, those who stay in these boom town have about $200 more in past due balances.
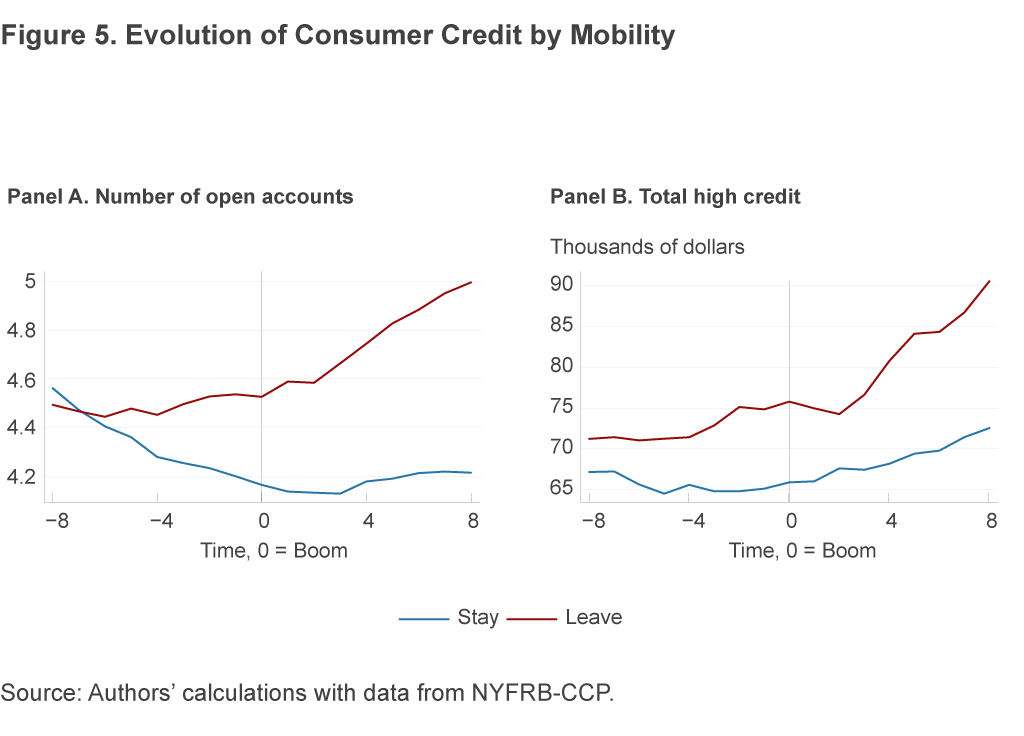
In addition, individuals who leave boom towns when oil-rig activity declines subsequently use more credit (figure 5). The number of open credit accounts for those who leave boom towns rises from about 4.5 to 5 on average, but for those who stay that number declines from about 4.5 to 4.2 (panel A). High credit, the maximum amount of all loans an individual can have outstanding at one time, increases from around $75,000 to $90,000 for those who leave boom towns, while increasing less so—from $65,000 to $73,000—for those who stay.
Conclusion
Understanding the sources of variation in household financial health is important because it can give us a better sense of what policies can be most effective. If poor financial literacy leads to long-term worsening of household financial health, then implementing financial education initiatives in secondary schools, for example, may be a cost-effective way of improving welfare. On the other hand, if differences in household financial health are caused by variation in the supply of financial services, then it is important to consider policies that give financial institutions incentives to reach underserved populations.
Our analysis implies that geographic mobility could have quantifiable benefits for consumer financial health.3 However, it is important to recognize that many individuals could have limited opportunity to relocate when local economic activity declines. Some family or personal circumstances can make relocation infeasible. Yet when the opportunity for relocation is plausible, there are tangible economic benefits that policymakers can consider when concerned with consumer financial health.
Footnotes
- These states include Arkansas, Colorado, Kansas, Louisiana, Montana, North Dakota, New Mexico, Ohio, Oklahoma, Pennsylvania, Texas, Utah, West Virginia, and Wyoming. Return to 1
- We also alter our sample by a matching process so that the county-level consumer-risk-score distributions are similar across the samples of those who leave and those who stay at the end of the boom. Return to 2
- Our analysis cannot address whether the individuals who move are fundamentally different from those who do not move, and how these differences might affect financial conditions over time. Indeed, in our sample, older individuals are less likely to move, while consumers with more open accounts are more likely to move. Return to 3
References
- Brown, J.R., J.A. Cookson, and R. Heimer, 2016. “Growing up without Finance,” unpublished manuscript.
- Celerier, C., and A. Matray, 2015. “Unbanked Households: Evidence of Supply-Side Factors,” unpublished manuscript.
- Corradin, S., and A. Popov, 2015. “House Prices, Home Equity Borrowing, and Entrepreneurship,” Review of Financial Studies.
- Iacoviello, M., and M. Pavan, 2013. “Housing and Debt over the Life Cycle and Over the Business Cycle,” Journal of Monetary Economics,” no. 2: 221–238.
- Jacobsen, G., and D. Parker, 2014. “The Economic Aftermath of Resource Booms: Evidence from Boomtowns in the American West,” The Economic Journal.
- Karlan, D., and J. Zinman, 2010. “Expanding Microenterprise Credit Access: Using Randomized Supply Decisions to Estimate the Impact in Manila,” Innovations for Poverty Action Working Paper.
- Lusardi, A. and Mitchell, O.S., 2011. “Financial Literacy around the World: An Overview,” Journal of Pension Economics and Finance, 10:497–508.
- Mian, A. , and A. Sufi, 2011. “House Prices, Home Equity-Based Borrowing, and the US Household Leverage Crisis,” The American Economic Review, no. 101: 2132–2156.
Suggested Citation
Heimer, Rawley Z., Timothy Stehulak, and Caitlin Treanor. 2016. “Geographic Mobility and Consumer Financial Health: Evidence from Oil Production Boom Towns.” Federal Reserve Bank of Cleveland, Economic Commentary 2016-13. https://doi.org/10.26509/frbc-ec-201613
This work by Federal Reserve Bank of Cleveland is licensed under Creative Commons Attribution-NonCommercial 4.0 International


