

- Share
Is a Nonseasonally Adjusted Median CPI a Useful Signal of Trend Inflation?
We construct a nonseasonally adjusted version of the Cleveland Fed’s median CPI (“NSA-median”) and compare its performance as a measure of trend inflation to the median CPI and the core CPI. We investigate a month-over-month form of both median measures as well as forms with varying amounts of time aggregation. We find that both the median CPI and the NSA-median are considerably better at tracking trend inflation than the core CPI. We also find that a mere three months of time averaging is sufficient to achieve lower volatility and acceptable tracking of trend inflation. We conclude that the NSA-median is a useful signal of trend inflation and a promising candidate for further study.

The views authors express in Economic Commentary are theirs and not necessarily those of the Federal Reserve Bank of Cleveland or the Board of Governors of the Federal Reserve System. The series editor is Tasia Hane. This paper and its data are subject to revision; please visit clevelandfed.org for updates.
Since controlling inflation is a central monetary policy goal, monetary policymakers focus intently on inflation signals. But they face a major difficulty: inflation data contain a lot of transitory shocks. The presence of the transitory “noise” in inflation data makes it difficult to detect early warnings of sustained movements. Responding to these transitory shocks would be a bad idea, because doing so would translate into policy swings and reversals and introduce uncertainty and volatility into the economy. Instead, policymakers attempt to respond to the sustained movements in inflation—that is, to underlying trend inflation. Discerning the underlying trend in the midst of the noisy inflation data is a challenging task.
Numerous approaches to this important problem have been proposed. Perhaps the most well-known trend inflation measure is the so-called “core” Consumer Price Index (CPI). It is a CPI variant that attempts to estimate trend inflation by simply excluding the prices of food and energy items. While this index does appear to be somewhat useful in tracking trend inflation, it lacks any theoretical justification. An alternative approach first proposed in the early 1990s—one which does possess a theoretical justification—has arguably proven to be superior in practice: the median CPI. This measure was introduced in Bryan and Cecchetti (1993) and is produced by the Federal Reserve Bank of Cleveland.
While the median CPI has proven useful in many contexts, it has an inherent drawback: its history is subject to revision about once a year, when the BLS releases its updated seasonal adjustment factors for the CPI. Conversely, a nonseasonally adjusted median CPI would rarely be subject to revision.
In this Commentary, we introduce a nonseasonally adjusted version of the median CPI (hereafter, the NSA-median). This index differs from the median CPI primarily in that it is built exclusively using nonseasonally adjusted data (see Higgins and Verbrugge 2015 for details). While the NSA-median will rarely be revised, one drawback is that, in many applications, a user will need to perform seasonal adjustment prior to subsequent analysis. We show that our new NSA-median measure is slightly superior to the median CPI in tracking trend inflation. But in keeping with prior research, we find that both of the median series clearly dominate the core CPI for discerning inflation trends.
We also investigate the usefulness of time aggregation, by comparing how well various inflation measures track trend inflation once they have been time aggregated by two months or more. We find that time aggregation is generally helpful. Of the variants investigated here, the most helpful form of time aggregation overall involves declining weights, using a formula proposed by Cogley (2002).
Trend Inflation
Most of the research on the median CPI has focused upon its forecasting ability. Results for the United States and for other countries have been overwhelmingly positive (see Bryan and Cecchetti 1994 and 1999; Bryan, Cecchetti, and Wiggins 1997; Aucremanne 2000; Clark 2001; Cogley 2002; Smith 2004; Rich and Steindel 2007; Meyer and Zaman 2012; Meyer, Venkatu, and Zaman 2013; and Meyer and Venkatu 2014). In various forecasting contexts, these studies have demonstrated that the median CPI usually outperforms the core CPI and leads to improved forecasts.1
We focus on a different desirable feature: the ability to capture the current trend in inflation.2 A chief purpose of the core CPI and the median CPI is to give an accurate reading on trend movements in the CPI. This is the same thing as saying that these measures should remove transitory influences from the CPI. Unfortunately, there is no universal definition for trend inflation and transitory influences.
Previous research has mostly used a centered 36-month moving average as a measure of the inflation trend (see, e.g., Bryan, Cecchetti, and Wiggins 1997). However, there are at least two drawbacks to this measure. First, a centered 36-month moving average explicitly includes inflation that is 18 months in the future; but we view 18 months in the future as a little too far away. Why? Because, according to most economists, monetary policy influences inflation at this horizon. As a result, a 36-month “trend inflation” signal will sometimes also implicitly contain the monetary policy reaction to the trend inflation signal, when what may be wanted by a policymaker is a measure of trend inflation that will inform a monetary policy reaction. Second, we believe that an ordinary 36-month moving average allows too much high-frequency noise to enter the trend (see Higgins and Verbrugge 2015).3
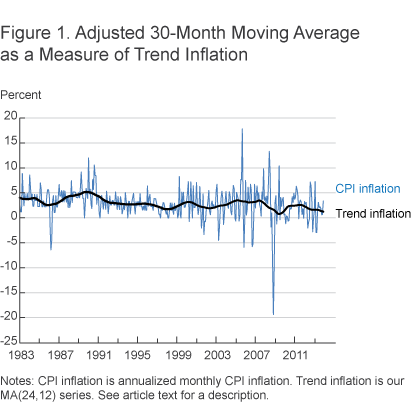
While we start with a centered 30-month moving average (MA(30)), we improve upon it by using a multiple-passmoving average. We first construct a centered 24-month moving average series and then apply a centered 12-month moving average to generate a final series. This “MA(24,12)” series is similar to an MA(30), but it is much better at removing high-frequency noise in the signal.4 We think that our filter strikes the right balance between the amount of information incorporated and the amount of transitory noise allowed. It does not include information from too far ahead—in which case, the signal does not just include the natural dynamics of inflation, but also includes the response of inflation to monetary policy—and it does not allow in too much transitory noise, which would lead to an unreliable “trend” estimate.5 Thus, we believe that our filter well captures the low-frequency part of inflation that past research has attempted to isolate, while avoiding distortion of the signal arising from monetary policy response.6
We plot our measure in figure 1, along with annualized monthly CPI inflation. It appears to be a reasonable estimate of trend inflation.
Volatility and Ability to Track Trend
We compare the ability of the NSA-median to track trend inflation against the CPI, the core CPI, and the median CPI. We focus on these inflation measures because they are widely used and are easily understood by the public and policymakers. As a result, they could potentially play a role in communicating monetary policy decisions to the public.
We first examine the month-over-month inflation rates in our four measures. We consider two measures of performance. The first is the variance of changes in the four inflation measures from one month to the next, which captures the volatility of each inflation reading. The second is the mean squared error (MSE), which captures the historical deviation between a given inflation measure and our estimate of trend inflation; a series with a smaller MSE has better tracked trend inflation in the past. We deseasonalize the NSA-median CPI when looking at month-over-month inflation rates. Our MA(24,12) series for trend inflation ends in September 2013, so we compute performance statistics from 1984 until that date.
Statistics pertaining to month-over-month inflation rates from the four measures are recorded in rows 2-5 of table 1. Regarding the volatility comparison, we see that the CPI is highly volatile. The other alternatives remove a substantial amount of volatility from the CPI. The core CPI is one-fifth as volatile than the CPI; but this measure is still more than twice as volatile as the median CPI. The deseasonalized NSA-median is somewhat less volatile than the median CPI. Regarding the ability to track trend inflation based on MSEs, we see that the CPI does a poor job; this is not surprising, since it is precisely this failing that is the main motivation for developing alternative CPI measures that better track trend inflation. While the core CPI is much better at tracking trend inflation than the CPI, it is markedly worse than either median CPI series. Of the two, the deseasonalized NSA-median is somewhat better than the median CPI at tracking trend inflation.
| Inflation measure | Variance of monthly changes | MSE vs. MA(24,12) |
|---|---|---|
| Trend: MA(24,12) | 0.005 | — |
| Monthly CPI | 11.60 | 8.67 |
| Monthly core CPI | 2.36 | 1.56 |
| Monthly median CPI | 0.93 | 0.80 |
| Monthly NSA-median (deseasonalized) | 0.76 | 0.67 |
Source: Authors’ calculations.
Time Aggregation
We next consider the potential benefits of time aggregation. Table 2 presents statistics pertaining to various levels of aggregation of inflation rates from the four measures. In general, time aggregation greatly diminishes the volatility of each measure, and it improves the ability of each measure to track trend inflation.
| Variance of monthly changes | MSE | |||||||
|---|---|---|---|---|---|---|---|---|
| Level of aggregation | CPI | Core CPI | Median | NSA-median | CPI | Core CPI | Median | NSA-median |
| One month | 11.60 | 2.36 | 0.93 | 0.76 | 8.67 | 1.56 | 0.80 | 0.67 |
| Two months | 4.75 | 0.58 | 0.22 | 0.20 | 5.94 | 0.95 | 0.61 | 0.53 |
| Three months | 2.23 | 0.25 | 0.11 | 0.09 | 4.17 | 0.76 | 0.55 | 0.48 |
| Four months | 1.20 | 0.15 | 0.06 | 0.05 | 3.07 | 0.69 | 0.52 | 0.46 |
| Six months | 0.54 | 0.06 | 0.03 | 0.02 | 1.85 | 0.67 | 0.51 | 0.46 |
| Nine months | 0.23 | 0.03 | 0.01 | 0.01 | 0.96 | 0.64 | 0.50 | 0.45 |
| Twelve months | 0.15 | 0.02 | 0.01 | 0.01 | 0.68 | 0.65 | 0.52 | 0.47 |
| Twelve months (exponential) | 0.25 | 0.03 | 0.01 | 0.01 | 0.81 | 0.63 | 0.49 | 0.44 |
Source: Authors’ calculations.
First we look at the four inflation measures at the 12-month level of aggregation, since the use of year-over-year measures is common. Note that in the case of the NSA-median it is not necessary to deseasonalize the 12-month inflation rates. (In any case, results are virtually identical whether or not they are deseasonalized.)
The 12-month CPI is not very volatile compared to the monthly measures, but it is still far more volatile than the other 12-month measures. The 12-month core CPI, while far less volatile than the 12 month CPI, is still twice as volatile as either 12-month median CPI. Regarding the ability of different 12-month measures to track trend inflation as captured in MSEs, we see that the 12-month CPI is roughly comparable to the 12-month core CPI, and both of these 12-month measures track trend inflation on average as well as the month-over-month medians. But both 12-month median measures markedly outperform the 12-month core CPI at tracking trend inflation. These measures are roughly comparable in their ability to track trend inflation, with a slight edge going to the 12-month NSA-median.
While combining 12 months of data improves the ability of each measure to track trend inflation, this amount of time aggregation need not be optimal; a smaller amount of time aggregation could still be useful in capturing trend inflation. So next we look at shorter windows of aggregation. For tracking trend inflation, most of the gains from aggregation are achieved with a mere three months of aggregation for both of the median measures. (The core CPI requires at least four months of aggregation before further gains become minor, while the CPI requires a full 12 months.) Furthermore, at some point—around nine months—more time aggregation appears to worsen the ability of the core CPI and the median measures to track trend inflation.
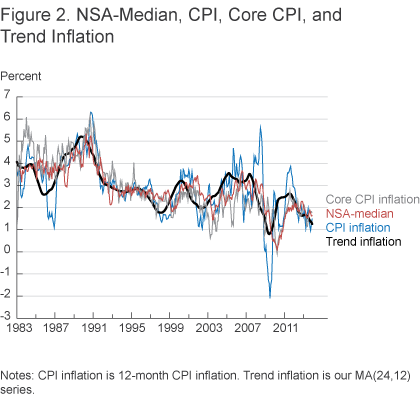
Figure 2 graphs trend inflation, along with the 12-month CPI and the 4-month versions of the core CPI and the (deseasonalized) NSA-median. (To avoid unduly cluttering the figure, we do not plot the 4-month version of the median CPI.) The NSA-median is a useful signal of trend inflation, and clearly dominates the core CPI in this regard.
Finally, we look at statistics for the core inflation measure developed by Cogley (2002), an alternative 12-month “exponential” weighting scheme, which puts higher weight on more recent observations, and which should therefore better capture turning points in trend inflation. For the CPI, the core CPI, and the median, exponentially weighting 12 months of data results in the best overall performance, though it is roughly equivalent to weighting nine months of data equally.
Conclusion
For decades, the median CPI has proven its worth as a forecasting tool. But another key purpose of inflation measures like the core CPI and the median CPI is to offer an accurate signal of trend inflation—to filter out noise from the incoming inflation signals.
In this study, we constructed a nonseasonally-adjusted version of the Cleveland Fed’s median CPI, and we used a variant of a 30-month moving average of inflation as our estimate of trend inflation. We investigated the performance of our NSA-median (in seasonally adjusted form) compared with that of the median CPI and the core CPI, in both month-over-month form and also upon applying varying amounts of time aggregation.
We draw three main conclusions from this study. First, the median CPI and the NSA median are less volatile than the core CPI and they hold considerable advantages over the core CPI for tracking trend inflation. Second, for these two median indexes, using only three months of time averaging reaps large rewards both in terms of volatility and in terms of tracking trend inflation. Additional time averaging is only moderately helpful. Third, the NSA-median is a useful signal of trend inflation, and is a promising candidate for further study.
Footnotes
- One prominent exception is Crone et al. (2013), a study which found that when using 12-month changes as the predictor, the core CPI slightly outperforms the median CPI at close horizons. Meyer and Pasaogullari (2010) also used 12-month changes in core inflation measures as a predictor, and—depending upon the time period examined—obtained some results that are similar in character. Taken as a whole, the results in these studies were generally quite supportive of the usefulness of the median CPI for forecasting purposes. Return to 1
- An analogy is seasonal adjustment; the goal of seasonal adjustment is to remove movements from an index that are, in a statistical sense, unrelated to trend movements, so as to better expose that trend. Detmeister (2011) is a related study that focuses on the PCE price index and comes to similar conclusions. Return to 2
- Brischetto and Richards (2007) also emphasize these points. See also Giannone and Matheson (2007). Return to 3
- The superiority can be seen graphically: our MA(24,12) series is much smoother than an MA(30). But we also demonstrate this advantage formally, using advanced time series methods, in Higgins and Verbrugge (2015). These methods also indicate that, aside from the transitory noise distinction, the filters are otherwise very similar. Return to 4
- While the MA(24,12) series admittedly uses information from 18 months ahead (rather than the 15 months ahead in MA(30)), this information receives little weight. Conversely, more weight is placed on information closer to the current month. Return to 5
- Giannone and Matheson (2007) characterize their estimation target as a centered 24-month moving average of annual inflation; Bryan and Cecchetti (2001) used a centered 24-month moving average as their target in the Brazilian context, as do Brischetto and Richards (2007) in their multicountry study. Return to 6
References
- Aucremanne, Luc (2000). “The Use of Robust Estimators as Measures of Core Inflation,” National Bank of Belgium, Working Paper No 2.
- Brischetto, Andrea, and Anthony J. Richards (2006). “The Performance of Trimmed Mean Measures of Underlying Inflation.” Reserve Bank of Australia, Research Discussion Paper 2006-10.
- Bryan, Michael F., and Christopher J. Pike (1991). “Median Price Changes: An Alternative Approach to Measuring Current Monetary Inflation,” Federal Reserve Bank of Cleveland, Economic Commentary.
- Bryan, Michael F., and Stephen G. Cecchetti (1993). “The Consumer Price Index as a Measure of Inflation,” Federal Reserve Bank of Cleveland, Economic Review, Quarter 4, 15-24.
- Bryan, Michael F., and Stephen G. Cecchetti (1994). “Measuring Core Inflation,” in Monetary Policy, N. Gregory Mankiw, ed., University of Chicago Press, 195-215.
- Bryan, Michael F., and Stephen G. Cecchetti (1995). “The Seasonality of Consumer Prices,” Federal Reserve Bank of Cleveland, Economic Review, Quarter 2, 12-23.
- Bryan, Michael F., Stephen G. Cecchetti, and Rodney L. Wiggins II (1997). “Efficient Inflation Estimation,” NBER Working Paper No. 6183.
- Cecchetti, Stephen G. (1997) “Measuring Short-Run Inflation for Central Bankers,” Federal Reserve Bank of St. Louis, Economic Review, 79, 143-156 (NBER Working Paper No. 5786).
- Clark, Todd E. (2001). “Comparing Measures of Core Inflation.” Federal Reserve Bank of Kansas City, Economic Review, 86:2, 5-31.
- Cogley, Timothy (2002). “A Simple Adaptive Measure of Core Inflation,” Journal of Money, Credit, and Banking, 34:1, 94-113.
- Crone, Theodore M., N. Neil K. Khettry, Loretta J. Mester, and Jason A. Novak (2013). “Core Measures of Inflation as Predictors of Total Inflation.” Journal of Money, Credit, and Banking, 45:2-3, 505-519.
- Detmeister, Alan K. (2011). “The Usefulness of Core PCE Inflation Measures,” Federal Reserve Board: Finance and Economics Discussion Series No. 2011-56.
- Giannone, Domenico, and Troy D. Matheson (2007). “A New Core Inflation Indicator for New Zealand,” International Journal of Central Banking, December, 145-180.
- Higgins, Amy, and Randal Verbrugge (2015). “Tracking Trend Inflation: Nonseasonally Adjusted Variants of the Median and Trimmed-Mean CPI,” Federal Reserve Bank of Cleveland, Working Paper 15-27.
- Meyer, Brent, and Mehmet Pasaogullari (2010). “Simple Ways to Forecast Inflation: What Works Best?” Federal Reserve Bank of Cleveland, Economic Commentary, 2010-17.
- Meyer, Brent, and Guhan Venkatu (2012). “Trimmed-Mean Inflation Statistics: Just Hit the One in the Middle,” Federal Reserve Bank of Cleveland, Working Paper 12-17.
- Meyer, Brent, Guhan Venkatu, and Saeed Zaman (2013). “Forecasting inflation? Target the Middle,” Federal Reserve Bank of Cleveland, Economic Commentary, 2013-05.
- Rich, Robert, and Charles Steindel (2007). “A Comparison of Measures of Core Inflation,” Federal Reserve Bank of New York, Economic Policy Review, December, 19-38.
- Smith, Julie K. (2004). “Weighted Median Inflation: Is This Core Inflation?” Journal of Money, Credit, and Banking, 36:2, 253-263.
- Verbrugge, Randal (1999). “Cross-Sectional Inflation Asymmetries and Core Inflation: A Comment on Bryan and Cecchetti,” The Review of Economics and Statistics, 81:2, 199-202.
- Wynne, Mark (1999). “Core Inflation: A Review of Some Conceptual Issues,” Federal Reserve Bank of Dallas, Working Paper 9903.
Suggested Citation
Higgins, Amy, and Randal J. Verbrugge. 2015. “Is a Nonseasonally Adjusted Median CPI a Useful Signal of Trend Inflation?” Federal Reserve Bank of Cleveland, Economic Commentary 2015-13. https://doi.org/10.26509/frbc-ec-201513
This work by Federal Reserve Bank of Cleveland is licensed under Creative Commons Attribution-NonCommercial 4.0 International

