

- Share
Interest Rate Forecasts in Conventional and Unconventional Monetary Policy Periods
Monetary policy has been conducted with a different set of tools since the financial crisis, and we investigate whether the change has affected the accuracy of professionals’ interest-rate forecasts. We analyze the accuracy of federal funds rate and nominal Treasury yield forecasts in the periods before and after the introduction of new policy tools and find that, in general, forecast accuracy improved in the latter policy period.
The views authors express in Economic Commentary are theirs and not necessarily those of the Federal Reserve Bank of Cleveland or the Board of Governors of the Federal Reserve System. The series editor is Tasia Hane. This paper and its data are subject to revision; please visit clevelandfed.org for updates.
We analyze the accuracy of professional forecasts of the federal funds rate and nominal Treasury yields across different periods. Since interest rates are inherently forward-looking and based on future expectations, they are an important source of information for policymakers. Forecasts add an additional source of information. Furthermore, the effectiveness of monetary policy depends on managing the expectations of market participants and effectively communicating future objectives.
The way monetary policy is conducted changed markedly with the financial crisis. Before the crisis, the Federal Open Market Committee (FOMC) used the federal funds rate as its main policy tool. Since the crisis, the FOMC has used a number of other tools such as forward guidance and long-term asset purchases. Has this change affected the accuracy of professionals’ interest-rate forecasts? To answer this question, we compare forecast performance across these two periods, the first of which we call the conventional monetary policy period and the second of which we call the unconventional.
We find that forecast accuracy in the near term (a one-quarter forecast horizon) is better across the whole spectrum of the term structure in the unconventional policy period (figure 1). In the medium term (a four-quarter forecast horizon), forecasts were also better in the unconventional period for the short-end of the term structure, but the improvement narrowed at longer horizons. Forecast accuracy of the medium-term yields (5-year) was similar in both policy periods, while accuracy of the long-term yield (10-year) was slightly worse in the unconventional policy period.
Data and Methods
Our source for forecasts is Blue Chip Financial Forecasts, a monthly survey of business economists conducted since 1976. We focus on forecasts of the quarterly average level of 7 different interest rates: the federal funds rate and the nominal yields of Treasury securities at 6 different maturities between 3 months and 10 years.1 We look at the professional forecasters’ forecasts for each of these rates at two horizons: one and four quarters ahead. We consider the quarterly performance of the mean (labeled consensus in the Blue Chip survey) interest rate forecasts. Our whole sample period covers 1990:Q1 to 2014:Q4, with the conventional monetary policy period spanning 1990:Q1 to 2008:Q4, and the unconventional monetary policy period spanning 2009:Q1 to 2014:Q4.2
Realized values for interest rates are obtained from the H.15 release produced by the Board of Governors of the Federal Reserve System.3 The H.15 data are daily, from which we compute a quarterly average. For assessing forecast accuracy, we use a standard measure, the root mean squared-error (RMSE). The RMSE is the average squared forecast error (the difference between the actual and the forecast value) over the forecast sample. A lower RMSE reflects a better forecast performance. We also use a rolling RMSE, which shows the evolution of forecast performance over time.
Within any given quarter, forecasters submit three estimates, one each month, for each horizon and all of the interest rates. We use forecasts from only the first month of the quarter in our analysis since these do not use any data from the current period.4
Forecast Performance
Our results show that forecasts in the unconventional monetary policy period have lower RMSEs on average than do the forecasts in the conventional monetary policy period (figure 1). Only the four-quarter forecast for the 10-year yield performed worse in the later period than in the earlier period.
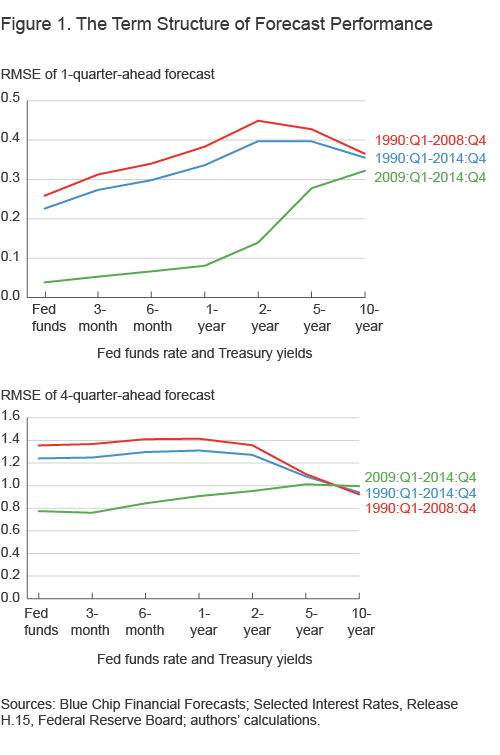
To a large extent, these lower forecast errors in the unconventional policy period, especially for the short end of the term structure, result from the FOMC’s commitment to hold the federal funds rate low for an extended period. Since the longer-term yields include a term for the average of future short-term rates, this commitment may also have led long-term yields to remain low as well, causing a decline in the forecast error for them. However, this relationship ignores term premiums and the policies directly aimed at lowering long-term yields in the unconventional policy period.5 The variability of the term premiums for long-term bonds, which may also be affected by such programs, probably has played a bigger role in the long end of the term structure during the unconventional policy period.
We see that the improvement in forecast performance in the unconventional period relative to the earlier period declines as the maturity increases, for both forecast horizons. In addition, the performance also worsens the longer the forecast horizon in the unconventional policy period. This result seems likely since the commitment to the low fed funds rate creates a credible anchor for the near term, but forecastability becomes relatively harder as the forecast horizon or the maturity increases.
Another interesting fact is that the four-quarter RMSEs for the whole sample and the conventional policy period are lower for the long-term yields than for the short-term yields. One explanation for this difference is that the short rate can be what is called “mean-reverting,” i.e., high short rates today tend to be followed by lower rates in the near future, and low short rates tend to be followed by higher rates. Since long-term interest rates are a function of short-term interest rates, one would expect the shocks affecting short rates to be reflected in long-term yields, though with a smaller magnitude. That effect would imply that the uncertainty concerning short rates over a long period (such as a four-quarter forecast horizon) will be higher than that of long-term yields.
However, we do not see such a decline in the RMSEs of the longer-term yields for the four-quarter forecasts in the unconventional policy period. This probably reflects the difficulties forecasters had in predicting how the FOMC would react to the shocks hitting the economy in the unconventional period, as well as uncertainty about the timing of the exit from such policies. A case in point is June 2013, when news of the possibility of tapering the Fed’s security purchases within the third round of the Large-Scale Asset Purchase Program (also known as QE3) led to sharp changes in long-term yields. Between June 18, 2013 (the day before the FOMC statement and related press conference), and June 25, 2013, the 5- and 10-year yields rose by about 0.4 percentage points.
Still, we believe the FOMC’s commitment to hold the fed funds rate low as well as forward guidance helped improve forecastability. Even though the unconventional period was one of great financial distress and associated uncertainties, the near-term forecastability of all yields improved, as did the medium-term forecastability of short- and medium-term yields. Only the forecastabilty of longer yields suffered to some extent.
The conventional policy period we have analyzed thus far includes data from 2007 and 2008. However, including data from the financial crisis of 2007–08 may not be fair since this was a period of high financial-market distress. To that end, we compute the RMSEs for periods excluding these years: The first is 1990:Q1 through 2007:Q4 and the second is 1990:Q1 through 2006:Q4. The results are shown in figure 2, which demonstrates that excluding 2007 alone or 2007 and 2006 together from the conventional policy period does not change the results qualitatively and has a limited quantitative effect.
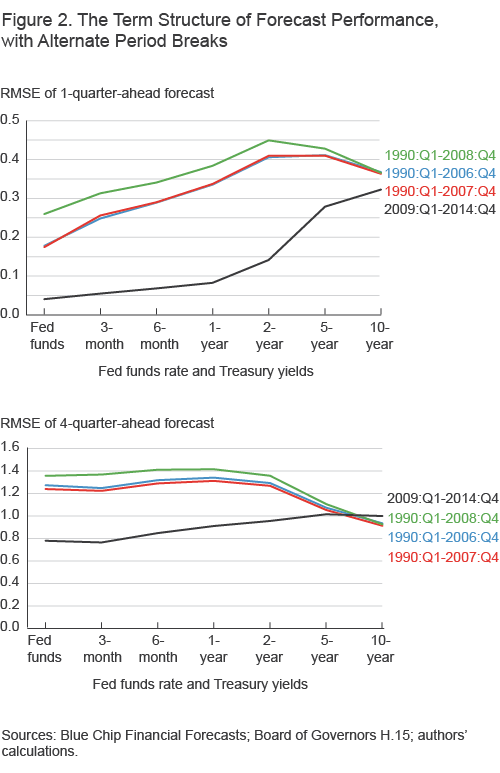
Sources: Blue Chip Financial Forecasts; Selected Interest Rates, Release H. 15, Federal Reserve Board; authors' calculations.
Up till now we have compared forecast accuracy across different nonoverlapping periods. Next we look at the entire sample without chopping it up into arbitrary blocks, using a rolling RMSE. This method smoothes out forecast errors by setting a window around the current observation and applying symmetric weights to past and future observations and a higher weight to the current observation. Our rolling RMSE estimates are calculated with seven quarters of observations before and after the current quarter.
Figure 3 shows the rolling RMSE of one- and four-quarter forecast horizons over the entire sample period and provides a closer look since 2006:Q1. We can see that coming into the crisis, the sharp interest rate declines were highly unexpected, and many forecasters erred markedly. 6 After the initial wave of surprise, forecast performance improved. As of 2013:Q1, our last point for the rolling RMSE (because we use seven forward observations), this improvement is the case for all the interest rates at the one-quarter forecast horizon, which has the lowest level of forecast errors in the whole sample. For the four-quarter horizon, the short-term rates still enjoy better forecastability, whereas the longer-term rates (the 5- and 10-year yields) are at elevated levels. As mentioned earlier, this may be related to the uncertainty of the shocks over the medium term in the unconventional policy period as well as the difficulty of forecasting the FOMC’s response to these shocks.
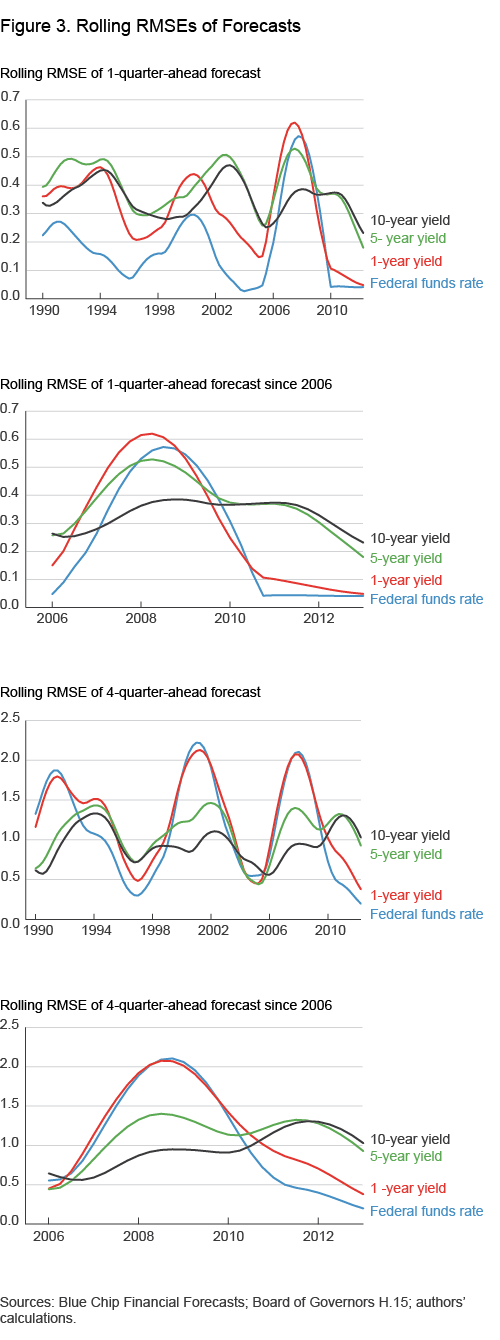
Sources: Blue Chip Financial Corecasts; Board of Governors H. 15; authors' calculations.
Conclusion
Our analysis compares the accuracy of Blue Chip Financial Forecasts in the conventional and unconventional monetary policy periods. Overall, the yields were better forecast in the unconventional monetary policy period than in the conventional monetary policy period. After the initial shock of the financial crisis, the forecast performance of interest rates, especially in the near term, has improved greatly. With forward guidance and the short-term interest rate near zero, forecast accuracy has improved in the near term. Meanwhile, the medium-term forecastability of longer yields during the unconventional policy period has suffered to some extent, most probably because of difficulties in predicting how monetary policy would react to the shocks hitting the economy.
Footnotes
- We exclude other surveyed rates such as the prime rate, 1-month commercial paper rate, AAA-corporate bond yield, and home-mortgage rate because we want to focus on the Treasury term structure. We have to limit the long end of the term structure to 10 years because the 30-year yield, which is surveyed currently, was replaced between March 2002 and April 2006 by the 20-year yield and a long-term average yield. In addition, we do not use the 3-year and 7-year yields, as these series are discontinued. Return to 1
- The FOMC cut the federal funds rate target to a range between 0 and 0.25 percent on December 16, 2008. Since the forecasts are for the quarterly averages and not the end-of-period values, we decided to use 2009:Q1 as the start date for the unconventional monetary policy period. Return to 2
- Blue Chip Financial Forecasts uses the H.15 data as the historical data in its releases, so it is logical to assume this is the benchmark used by participants. H.15 data can be found at http://www.federalreserve.gov/releases/h15/data.htm. Return to 3
- Our findings, though not reported here, show that the forecast accuracy increases from the first to the second and from the second to the third months of the quarter for every forecast horizon and every financial variable. In addition, as expected, forecast accuracy diminishes the farther into the future one predicts. Return to 4
- These policies include the Large-Scale Asset Purchase (LSAP) programs commonly referred to as “quantitative easing” programs, or QE, as well as the Maturity Extension Program, commonly referred to as “Operation Twist.” Return to 5
- The FOMC cut the target range of the federal funds rate to 0 to 0.25 percent on December 16, 2008. In October 2008, the fourth-quarter funds rate forecast was 2 percent. Even the fourth-quarter forecasts made in December were relatively high at 0.9 percent, considering the daily average for the quarter was 0.53 percent. Return to 6
Suggested Citation
Oliver, Nelson, and Mehmet Pasaogullari. 2015. “Interest Rate Forecasts in Conventional and Unconventional Monetary Policy Periods.” Federal Reserve Bank of Cleveland, Economic Commentary 2015-05. https://doi.org/10.26509/frbc-ec-201505
This work by Federal Reserve Bank of Cleveland is licensed under Creative Commons Attribution-NonCommercial 4.0 International

