

- Share
The Importance of Trend Inflation in the Search for Missing Disinflation
Some inflation-forecasting models based on the Phillips curve suggest that there should have been more disinflation since the Great Recession than has shown up in core PCE or core CPI data. One way researchers have found to make the disinflation disappear is to remove the long-term unemployed from the overall unemployment measure that is typically used in the models. This analysis shows that the disinflation arises in such models because of the way they account for the long-term trend in inflation. Under a different measurement of trend inflation, which historical forecast accuracy suggests should be preferable, the recent path of inflation can be reasonably well explained by an inflation-forecasting model that incorporates the overall unemployment rate.

The views authors express in Economic Commentary are theirs and not necessarily those of the Federal Reserve Bank of Cleveland or the Board of Governors of the Federal Reserve System. The series editor is Tasia Hane. This paper and its data are subject to revision; please visit clevelandfed.org for updates.
Some common inflation-forecasting models, known as Phillips curve models, relate inflation to the unemployment rate. Normally, the unemployment rate in such models is the overall rate, which includes all unemployed workers. The idea is that the overall unemployment rate effectively summarizes the utilization of labor resources and the broader state of the economy, which help to determine the rates of increases in firms’ production costs and, in turn, prices.
Some common versions of the Phillips curve imply that, in the face of the long period of elevated (overall) unemployment that has followed the onset of the Great Recession, inflation should have fallen much lower than it has. That is, some disinflation (fall in inflation) called for by the models is missing in the sense that it hasn’t occurred.
To better explain the actual path of inflation, some analysts have argued for replacing the overall unemployment rate in the Phillips curve with a rate of unemployment that excludes the long-term unemployed—the short-term unemployment rate (see, for example, Gordon (2013) and Macroeconomic Advisers (2014)).1 In the past few years, the overall unemployment rate has declined but remained well above the historical norm, while the short-term unemployment rate has fallen more sharply, to a level closer to the historical norm. In versions of the Phillips curve favored by advocates of the short-term unemployment rate, replacing the overall rate with the short-term rate largely eliminates the missing disinflation. In addition, looking ahead, these same models incorporating the short-term unemployment rate tend to project a higher path of inflation than do models based on the overall rate.
Based on analysis presented below, the case for a missing disinflation that can be solved by using the short-term unemployment rate to predict inflation is less compelling than some commentators have suggested. The evidence in favor of missing disinflation and the usefulness of the short-term unemployment rate depends in part on a questionable assumption about trend inflation. Other treatments of trend inflation have performed better in historical inflation forecasting. The analysis below shows that, under one of the best-performing, state-of-the-art treatments of trend inflation, the recent evolution of inflation is consistent with a Phillips curve model based on the overall unemployment rate. In addition, for the forecasted path of inflation over the next few years, there is little difference in versions of the model that use the short-term unemployment rate rather than the overall rate.
Trend Inflation
So why can the treatment of trend inflation matter in Phillips curve modeling? At root is the historical evolution of inflation, which trended sharply higher from the mid-1960s through the early 1980s and trended lower for about the next 10 years (figure 1). By now, there is broad agreement among economists that these long-term trends in inflation were driven by broad shifts in the conduct of monetary policy. Basically, over time, the average level of inflation has shifted around a lot. If these shifts are simply ignored, they can distort estimates of the relationship between inflation and its drivers, such as the state of the business cycle as measured by the unemployment rate.
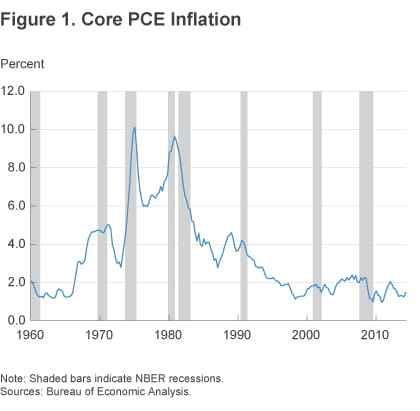
Note: Shaded bars indicate NBER recessions.
Source: Bureau of Economic Analysis.
As a result, in Phillips curve modeling, it is common to remove some measure of the inflation trend from inflation—that is, to relate inflation minus its trend to the unemployment rate, rather than to relate inflation directly to unemployment. Some studies couch things in terms of inflation expectations rather than trend inflation; these studies describe the Phillips curve as relating inflation to expected future inflation and the unemployment rate. But the trend inflation and inflation-expectations approaches are essentially equivalent in simple models used for inflation forecasting. The basic idea is that there is some normal level of inflation—either the measured rate of expected inflation or trend inflation—to which inflation will eventually return (when unemployment is at normal levels).
One common approach is to measure the inflation trend with the recent (past) level of inflation. In this case, inflation minus its trend inflation is simply the change in inflation (in the analysis below, the change in inflation from last quarter to this quarter). The Phillips curve is defined to relate the change in inflation to past changes in inflation and to the unemployment rate.
In this version of the Phillips curve, trend inflation moves quickly with actual inflation, so it need not be the case that trend inflation helps to stabilize or anchor actual inflation. As a result, inflation can become unanchored in response to persistently high or persistently low unemployment. To see how, suppose that inflation is close to 2 percent when a recession hits and pushes unemployment up significantly. In these circumstances, the model implies a fall in inflation in response to the rise in unemployment. Over time, if high unemployment persists, low inflation persists. Before long, a pattern of low inflation pushes down the model’s implied measure of trend inflation. That change in trend in turn pushes the model’s prediction of inflation down even further. Because trend inflation is not necessarily anchored in this version of the Phillips curve, trend inflation can drift ever lower. In the face of a long period of elevated unemployment, that feature pushes the model’s projected inflation rate down to extremely low levels.
An alternative approach is to measure trend inflation with a long-run forecast of inflation from a survey of professional forecasters. The rationale is that professional forecasters are able to consider a range of information on monetary policy—some outside the scope of simple models—to assess the long-term trend of inflation.
Their long-run (10-year average) forecasts give a more or less direct estimate of this trend assessment. Recent research has shown that, compared to some other definitions of trend inflation, including the first one described above, the survey-based trend performs relatively well in historical inflation forecasting (Clark and Doh (2014), Faust and Wright (2013), and Zaman (2013)). Under this approach to capturing trend inflation, the Phillips curve is defined to relate inflation minus the survey-based trend to past values of inflation minus trend and to the unemployment rate. In this model specification, inflation is anchored around the survey-based trend. The model implies that inflation can move above or below trend for some period of time, but in the longer term, inflation will return to trend as defined by the survey’s long-run forecast.
Missing Disinflation and the Short-Term Unemployment Rate
Throughout this article’s analysis, I rely on a general type of forecasting model (a Bayesian vector autoregression) that is very common in macroeconomics. The model consists of equations relating the current value of (detrended) inflation and unemployment to past values of both variables. Applied to inflation and unemployment, this model generalizes the Phillips curve model of inflation. For simplicity, I refer to the model as a Phillips curve.
To abstract from some of the temporary variation in inflation that can arise due to noisy food and energy prices, inflation is measured as core inflation. Although this article focuses on results for core PCE inflation, using core CPI as the measure of inflation yields very similar findings.
I begin the analysis with the version of the Phillips curve in which trend inflation is defined as just past inflation—the version consistent with models underlying some other researchers’ evidence of missing disinflation.2 To examine how well the model can account for the recent path of inflation, I use the model to forecast inflation from 2008 (right after the Great Recession began) through mid-2014, and I compare the actual path of inflation to the point forecast and a confidence band around it. In forming the inflation forecast, I rely on the actual path of unemployment from the 2008 through mid-2014 period, rather than a forecasted path of unemployment.3 Using the actual path of unemployment means any failure of the model to track the path of inflation won’t be driven by a failure to forecast the unemployment rate. For this analysis, the model is estimated with data from 1985 through 2007.4
As figure 2 shows, this version of the Phillips curve implies that, over the last few years, inflation should have fallen to zero (or less) and stayed there. In fact, while inflation fell during the recession and for a time afterward, it has not fallen to near-zero levels. Rather, after falling to 1 percent in 2010, core PCE inflation rose to 1.9 percent in 2011 and then declined, hitting 1.3 percent in 2013. As some observers have suggested, this version of the Phillips curve indeed implies there has been some missing disinflation, in the sense that actual inflation has not fallen as much as the model calls for.
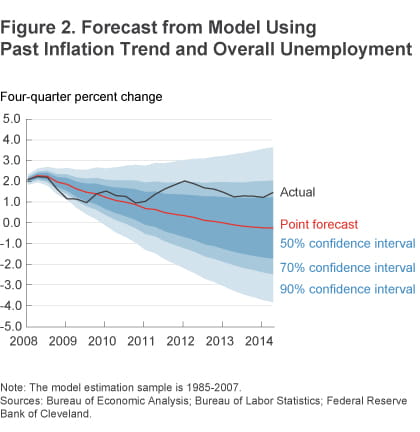
Note: The model estimation sample is 1985-2007.
Source: Bureau of Economic Analysis; Bureau of Labor Statistics; Federal Reserve Bank of Cleveland.
However, the sharp falloff in inflation predicted by this version of the Phillips curve reflects not just persistently elevated unemployment. It also reflects the model’s assumption that trend inflation is just recent inflation, for the reasons described above. This aspect of the model drives the difficulty of accounting for recent inflation with the overall unemployment rate.
Admittedly, though, the uncertainty surrounding the model’s projections is huge, reflected in extremely wide confidence bands. The forecast from this kind of Phillips curve is especially uncertain because inflation is not very well anchored. As noted above, in this model, when inflation falls due to high unemployment and stays down, the model’s trend rate of inflation is pushed down, which puts further downward pressure on inflation. This behavior opens the door to wide swings in inflation, which leads to high uncertainty around the forecast.
To correct the model’s difficulty in producing a forecast that matches the actual path of inflation, one option is to consider a measure of unemployment that hasn’t stayed as high as the overall unemployment rate. The rate of unemployment covering just those unemployed 26 weeks or less—the short-term unemployment rate—is one such measure (figure 3). Historically, the short-term unemployment rate has moved pretty closely with the overall unemployment rate. The last several years have been unusual in that the overall unemployment rate has been much higher than the short-term rate. This unusually large gap in the rates reflects the surge in long-term unemployment that occurred during the recession and the ensuing very slow recovery of long-term unemployment.
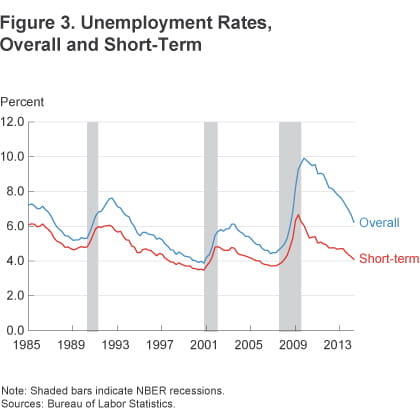
Note: Shaded bars indicate NBER recessions.
Source: Bureau of Economic Analysis.
To see how much the measure of unemployment matters for this Phillips curve’s ability to account for recent inflation, I modify the model to include the short-term unemployment rate rather than the overall rate and re-estimate this modified model. As figure 4 shows, using short-term rather than overall unemployment in the Phillips curve eliminates the missing disinflation of the baseline model. The forecast of inflation based on short-term unemployment more or less tracks the path of actual inflation. The reason is that short-term unemployment has declined sharply over the last few years, reducing downward pressure on inflation. Without so much downward pressure on inflation coming from unemployment, the model’s implied trend inflation remains more stable, also reducing downward pressure on inflation. Based on evidence like this, some observers have suggested that the short-term unemployment rate should be preferred to the overall rate for explaining recent inflation and forecasting inflation in the period ahead.
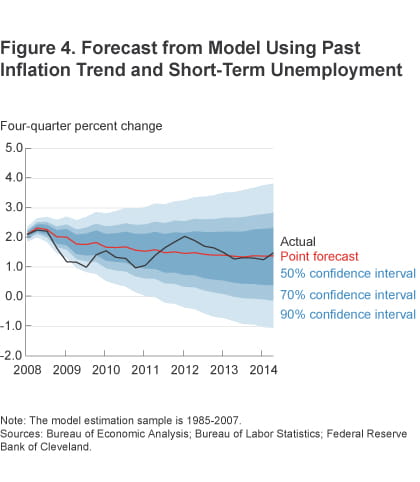
Note: The model estimation sample in 1985-2007.
Sources: Bureau of Economic Analysis; Bureau of Labor Statistics; Federal Reserve Bank of Cleveland.
Another Look Based on a Better Measure of Trend Inflation
I now re-examine the recent path of inflation with a version of the Phillips curve in which trend inflation is defined as the survey-based long-run forecast. Specifically, I use the model to forecast core inflation from 2008 through mid-2014, based on the actual path of overall unemployment over the period. I compare the actual path of inflation to the point forecast and a confidence band around it. The model is estimated with data from 1985 through 2007.
As figure 5 shows, this version of the Phillips curve does a reasonably solid job of tracking the path of actual inflation. There is no missing disinflation over the last few years. If anything, there is a puzzle as to why inflation fell so fast during the recession (the same puzzle applies in the model above based on the change in inflation and the short-term unemployment rate, but the extremely wide forecast confidence bands obscure it). However, that is common with Phillips curve models such as these, which have trouble fully capturing the effects of recessions on inflation. In addition, this simple formulation of the Phillips curve omits food and energy prices, which plummeted during the global recession and likely helped to pull down core consumer price inflation.
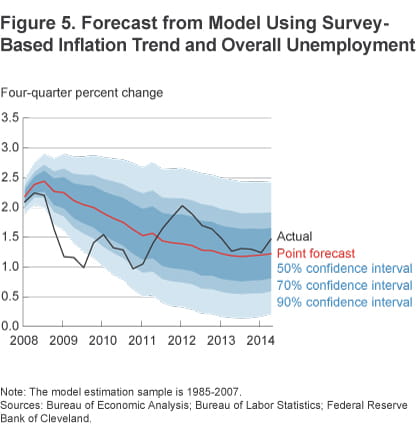
Note: The model estimation sample is 1985-2007.
Sources: Bureau of Economic Analysis; Bureau of Labor Statistics; Federal Reserve Bank of Cleveland
One other noteworthy feature of this model of the Phillips curve is that it produces much narrower forecast confidence bands than does the model with short-term unemployment. That narrowing of uncertainty is the result of the anchoring of trend inflation in the model.
Conclusions
The case for a missing disinflation that can be solved by using the short-term unemployment rate to predict inflation is less compelling than some commentators have suggested. The evidence that seems to support a large missing disinflation and using the short-term unemployment rate rests in part on a questionable measurement of trend inflation. Under a different measurement of trend inflation, which historical forecast accuracy suggests should be preferable, the recent path of inflation can be reasonably well explained by an inflation-forecasting model that incorporates the overall unemployment rate.
What does this preferable model say about the near-term outlook for inflation? It projects a gradual upward drift in core inflation from mid-2014 through 2016 (red line in figure 6). In fact, with this model’s treatment of trend inflation as anchored, the choice of the overall unemployment rate over the short-term rate has little effect on the forecast. When the model is modified to use the short-term rate instead of the overall unemployment rate, the forecast of core inflation is very little changed (gray line in figure 6).
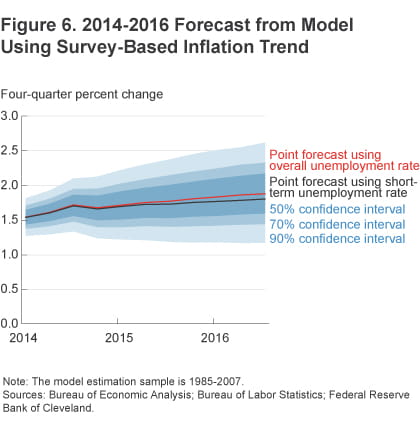
Note: The model estimation sample is 1985-2007.
Sources: Bureau of Economic Analysis; Bureau of Labor Statistics; Federal Reserve Bank of Cleveland
Footnotes
- There are a range of possible explanations for the path of inflation over the last few years, in the context of an alleged breakdown in a Phillips curve based on the overall unemployment rate and the change in inflation. These explanations include the following: (1) a series of big shocks to inflation, (2) a shift in the parameters of the Phillips curve, and (3) stable parameters but a shift in the appropriate measure of unemployment. For example, the recent behavior of inflation can be explained by allowing the coefficients of a model in the change in inflation and the overall unemployment rate to have shifted sometime after 2007. However, in this analysis, I follow some other researchers in trying to account for the behavior of inflation without resorting to post-Great Recession shifts in model coefficients. Return
- More specifically, Gordon (2013) specifies a model in the level of inflation, but imposes a unit root restriction, which makes the model equivalent to one in the change in inflation. Macroeconomic Advisers (2014) specifies a model in the change in inflation, with a relatively weak (weak in the estimates) error correction term that ties the level of inflation to long-run inflation expectations. Return
- In technical parlance, the inflation forecasts reported are formed as conditional forecasts—conditional on the actual path of the unemployment rate. Return
- The estimation sample begins in 1985 in light of other evidence of significant breaks in inflation dynamics that occurred in the early 1980s (e.g., Watson 2014). Return
References
- Clark, Todd E., and Taeyoung Doh, 2014. “Evaluating Alternative Models of Trend Inflation,” International Journal of Forecasting, July-September.
- Faust, Jon, and Jonathan H. Wright, 2013. “Forecasting Inflation,” in Handbook of Economic Forecasting, volume 2 (North Holland).
- Gordon, Robert J., 2013. “The Phillips Curve Is Alive and Well: Inflation and the NAIRU during the Slow Recovery,” NBER working paper no. 19390.
- Macroeconomic Advisers, 2014. “Long-Term Unemployment and the Outlook for Inflation,” presentation at Federal Reserve Bank of Cleveland conference, Inflation, Monetary Policy, and the Public, May 2014.
- Watson, Mark W., 2014. “What’s Natural? Key Macroeconomic Parameters after the Great Recession,” American Economic Review, May.
Suggested Citation
Clark, Todd E. 2014. “The Importance of Trend Inflation in the Search for Missing Disinflation.” Federal Reserve Bank of Cleveland, Economic Commentary 2014-16. https://doi.org/10.26509/frbc-ec-201416
This work by Federal Reserve Bank of Cleveland is licensed under Creative Commons Attribution-NonCommercial 4.0 International

