

- Share
Keeping the House or Moving for a Job
Some reports have suggested that employers can’t fill job openings in some places because they can’t entice workers to move. Workers won’t move, so the story goes, when doing so will mean losing money on their homes, and this is the case for many homeowners since the housing crash. But new research shows that homeowners will move when they have a better job offer, even if they will lose money on their home when they sell it.
The views authors express in Economic Commentary are theirs and not necessarily those of the Federal Reserve Bank of Cleveland or the Board of Governors of the Federal Reserve System. The series editor is Tasia Hane. This paper and its data are subject to revision; please visit clevelandfed.org for updates.
If you owe more on your house than it’s worth, are you less likely to take a job when it means having to move and sell your home? During the recession and early recovery, some news outlets were reporting that many people who were facing that choice were deciding to stay put—so many that employers in some areas of the country can’t fill all of the job openings they have. If that is true, it could mean the aggregate U.S. unemployment rate is high not because there are not enough jobs, but because people can’t get to where the jobs are.
Many homeowners lost equity in their homes during the Great Recession. Some lost so much that their equity fell negative, leaving them “underwater.” An underwater borrower owes more than the home is worth, which makes it unattractive to sell the house. To sell an underwater home, a borrower must pay the difference between the amount still owed on the mortgage and the value of the home, if he or she wants to avoid foreclosure. So it seems entirely plausible that underwater borrowers would decide to turn down job offers instead of selling their homes at a loss.
But our research, which uses a much larger data set than previous studies, shows that the equity in a home is not a crucial part of most unemployed people’s decision to relocate for a job. If a job is available, the economic benefit of accepting it outweighs the potential costs of disposing of the home.
Mortgages, Mobility, and Unemployment
According to CoreLogic, about 29 percent of households had either negative or near-negative equity in their homes shortly after the end of the recession, in the fourth quarter of 2009. At that time, even though negative equity was a problem in all 50 states, it was concentrated in five— Michigan (with 40 percent of mortgages underwater), and four “sand states”—Nevada (70 percent), Arizona (51 percent), Florida (48 percent), and California (35 percent). The problem still persists: At the end of the second quarter of 2012, 27 percent of homeowners across the country were either underwater or nearly underwater.
Subprime mortgages, which are widely blamed for fueling the recent financial crisis, are probably the type of mortgage most likely to have gone underwater. Considering a sample of mortgages that are mostly subprime, figure 1 shows how the extent and the distribution of negative equity evolved during the crisis across the United States. In 2007, only six states had more than 5 percent of homes underwater. By 2008, the majority of states had more than 5 percent of homes underwater, and five states, including Ohio, had more than 20 percent of homes that fit the definition, while Michigan had over 40 percent. In 2009, nearly every state had more than 5 percent of homes underwater. Among them, 17 states had more than 20 percent, and a staggering 12 states had more than 40 percent.
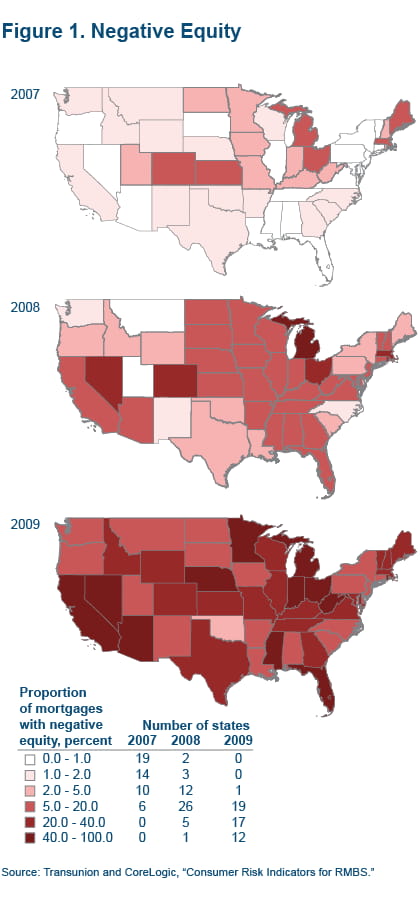
Source: Transunion and CoreLogic, "Consumer Risk Indicators for RMBS."
During the same time, as shown in figure 2, the number of homeowners who relocated from one state to another declined after the crisis broke in 2007. Specifically, between 2006 and 2007, 37 states had more than 1 percent of homeowners move to a different state. Between 2008 and 2009, the number decreased to 23. In the states with a significant fraction of underwater homeowners, mobility was declining. For example, in Arizona the mobility rate declined from 1.7 percent in 2007 to 1.4 percent in 2009, and in California, the rate decreased from 0.8 to 0.6 percent.
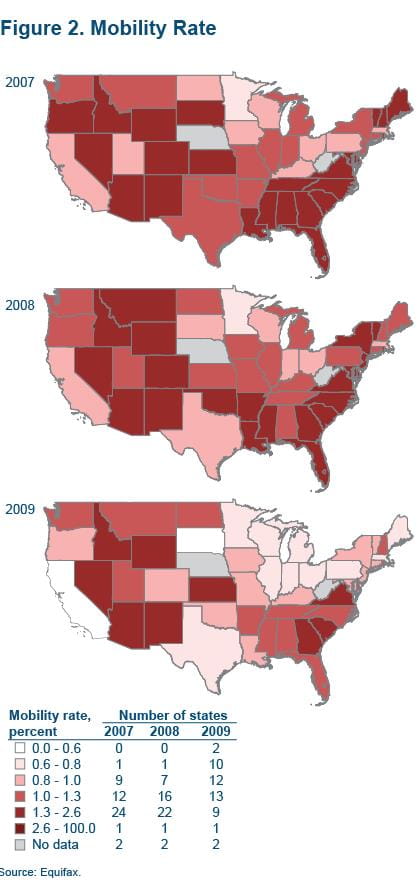
Source: Equifax.
Could it be that the decline in mobility rates was caused by homeowners being locked into their underwater homes? The decline in mobility could in turn be contributing to higher unemployment rates—even if jobs are available in other states. After all, unemployment rates have been increasing, as shown in figure 3, at the same time as shares of negative equity have been increasing and mobility has been declining.
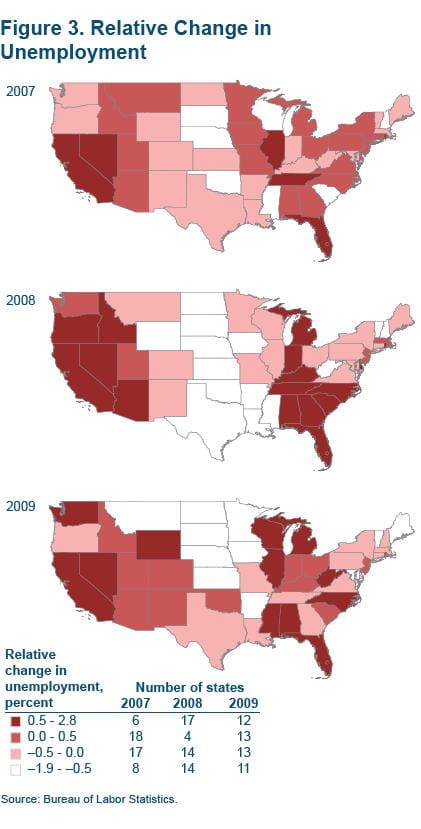
Source: Bureau of Labor Statistics.
Numerous researchers have analyzed this issue, but so far no consensus has been reached. There hasn’t been enough data to answer the question—until recently.
Better Data, Different Answers
Studies that have investigated the connection between mortgage debt and mobility have had to make due with data sources that fall short in one way or another. One line of research uses data from the American Community Survey, which provides data aggregated to the level of communities, such as towns or counties. The aggregation makes it impossible to account for differences between individuals.
Another line of research uses data from the American Housing Survey. The survey tracks changes in the occupancy of houses, not the movement of individuals, making it less ideal for studying mobility. A third line of research uses the Panel Study of Income Dynamics—a survey that covers only about 5,000 individuals and gathers limited information about their assets and liabilities. A fourth line of research uses data from the U.S. Census to obtain more substantial coverage of U.S. regions. However, the Census does not provide any information about individuals’ liabilities, making it impossible to study whether mortgage debt relates to mobility.
Our research uses much larger individual-level data sets. Specifically, we use anonymous data from two of the three major credit bureaus in the United States, TransUnion and Equifax. Both data sets provide substantial information about the mortgage debt of tens of millions of individuals.
From TransUnion, we use credit report data on mortgages that are typically originated to borrowers with less-than- perfect creditworthiness (such as subprime) and are securitized by banks and financial companies other than government-sponsored-enterprises, such as Fannie Mae. This data set has been matched with detailed mortgage information from CoreLogic. When we combine these sources, we know if the borrowers’ mortgages are underwater, if they are likely to be unemployed, and if they relocate.
From Equifax, we use data for a random sample of the entire population of homeowners in the United States. (The Equifax data are available to us through the Federal Reserve Bank of New York’s Consumer Credit Panel data set.) For those homeowners, we also know how likely they are to be unemployed and if they relocate, but we do not observe equity in their homes. We approximate the changes in their equity by changes in home prices in the ZIP codes where they live. We use the Equifax data in addition to the TransUnion data, even if it has less information about equity, in order to verify if our results hold up in the more representative data set.
Finally, to the data from the credit bureaus we add labor market data from the Bureau of Economic Analysis. With these data we can determine if areas where people live have experienced relatively unfavorable employment shocks. From this we can infer how likely individuals who live in a given area are to become unemployed.
To help better interpret our findings on the combined data, we construct a theoretical model of individuals who decide whether to rent or own a home and whether to move for a (better) job or not. We set the model up so that their decision depends on their employment situation and the equity in their homes. We are confident that our model is a good representation of reality. We used the model to create data for hypothetical individuals who are very similar to those in the real world, and the artificial data it generated resemble the real-world data on numerous dimensions.
In the real data, we do not observe everything about individuals. In particular, we do not observe if a given individual has suffered a job loss. Also, we do not observe the exact costs of selling each home or an individual’s propensity to accept new job offers from other locations. In the model, we know all of the above. The data generated by our model suggests that the benefit of moving and getting a job (and, hence, a higher income) for unemployed homeowners outweighs the cost of relocation and disposing of an underwater home.
Study Details
Using our model and combined data sets, we estimate the likelihood of homeowners moving for a job when they have various levels of equity in their homes. To decide if someone moved for a job, we focus on regions called core based statistical areas (CBSAs). A CBSA is a collective term for both metropolitan and micropolitan areas. A CBSA can be considered the local labor market for most workers because they can change residence within the CBSA without changing jobs, or change jobs within the CBSA without changing residence. If people move to a different CBSA, it is likely they move to a new job.
We allow the moving decision to depend on how much home equity homeowners have, on their credit scores, and on the change in the relative unemployment rate in the area where they live. We account for all differences between individuals that do not vary over time, such as birth year, gender, risk aversion, or just an innate tendency to move more or less often. It is important to do this so our estimations are less likely to capture spurious patterns. For example, some individuals may be inherently less mobile and have a lower propensity to save and accumulate home equity than the average person. When house prices fall, more of these individuals would end up with negative equity than those who prefer to save more. Since they are also less mobile, a researcher could infer a negative causal effect of low home equity on mobility when the true pattern was simply one of certain people systematically accumulating less equity and moving less. Our approach implies that our results are not driven by such patterns.
Our results show that individuals with low equity actually move more than those with high equity (figure 4). Figure 4 shows the results from the TransUnion data for areas where unemployment increases more than average. Specifically, homeowners whose homes are worth less than 80 percent of their mortgage debt are 1 percent more likely to move for a job in a given year than homeowners whose homes are worth more than 120 percent of their mortgage debt (that is, those with more than 20 percent equity). Those with home values between 80 and 100 percent of their mortgage debt are 0.35 percent more likely to move to another CBSA than the homeowners with more than 20 percent equity. Homeowners with small positive equity are nearly as likely to move for a job as those with equity exceeding 20 percent. (Because of the statistical approach we use, our results tell us about how homeowners with different equity levels behave relative to the group of homeowners who have more than 20 percent equity, and they distinguish between homeowners who live in CBSAs with relatively favorable or unfavorable labor market conditions.)
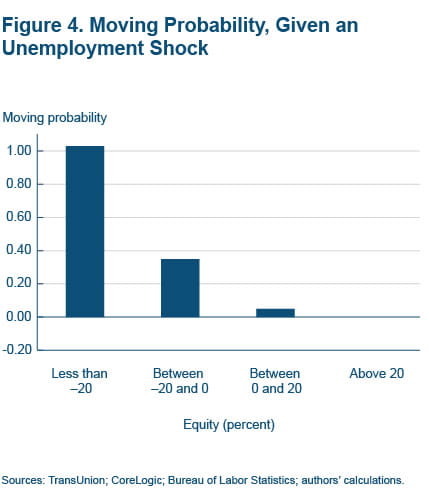
Sources: TransUnion; CoreLogic; Bureau of Labor Statistics; authors' calculations.
Using data from our model, we are able to analyze how patterns of mobility depend on the employment status of individual homeowners, not only changes in the CBSA-level unemployment growth rates. The results show that if an unemployed homeowner with negative equity is able to find a job in another CBSA, he or she is highly likely to accept this job because the net benefit of moving (getting a higher income minus paying the cost of selling the house) outweighs the benefit of staying put, remaining unemployed, and keeping an underwater mortgage.
Given that the TransUnion data available to us represent only a certain subset of the U.S. population, we explore if our results apply to the entire population of homeowners by repeating the analysis using data from Equifax. The Equifax data set is representative of the entire country, as it is a random sample of almost all individuals with a credit report. It, however, does not have direct measures of equity, which we approximate with house-price growth since mortgage origination. Nonetheless, we obtain qualitatively similar results, implying that negative equity is not a barrier to a job-related mobility.
To make sure that our findings do not depend on how we measure unfavorable labor market conditions, we check if different measures produce the same result. For this purpose, we use declines in vacancy rates and declines in employment growth rates instead of increases in unemployment rates as measures of local-area labor market shocks. The results when we use these alternative measures are very similar to those described above.
The results hold even if we consider only homeowners with subprime mortgages, Alt-A mortgages, jumbo prime mortgages, or mortgages originated for financing noninvestment properties only. We conclude that negative equity does not limit job-related mobility and, hence, is not a major reason for elevated aggregate unemployment in the United States.
Related Reading
- “Moving to a Job: The Role of Home Equity, Debt, and Access to Credit,” Yuliya Demyanyk, Dmytro Hryshko, María José Luengo-Prado, and Bent Sørensen, 2013. Federal Reserve Bank of Cleveland, working paper no. 13-05.
Suggested Citation
Demyanyk, Yuliya, Dmytro Hryshko, María José Luengo-Prado, and Bent E. Sørensen. 2013. “Keeping the House or Moving for a Job.” Federal Reserve Bank of Cleveland, Economic Commentary 2013-09. https://doi.org/10.26509/frbc-ec-201309
This work by Federal Reserve Bank of Cleveland is licensed under Creative Commons Attribution-NonCommercial 4.0 International

