- Share
Unemployment, Labor Costs, and Recessions: Implications for the Inflation Outlook
Economists have been arguing about the connection between unemployment and inflation for decades. Critics claim that the connection is unreliable and leads policymakers astray, while others argue that the relationship is useful for forecasting. We examine the more direct connections between elevated unemployment levels and the rate of increase in wage and labor costs, more generally. We find that wage and labor cost growth has declined markedly following recent recessions. It has again declined sharply in the most recent recession. We also find that compensation typically remains subdued during the initial phases of recent recoveries. This is again the case in the current recovery, making labor costs a significant restraining force on inflation going forward.
The views authors express in Economic Commentary are theirs and not necessarily those of the Federal Reserve Bank of Cleveland or the Board of Governors of the Federal Reserve System. The series editor is Tasia Hane. This paper and its data are subject to revision; please visit clevelandfed.org for updates.
It is logical to assume that today’s unemployment rate is high enough to influence the compensation of workers who find themselves competing with millions of other unemployed people for the same jobs. This connection between real economic activity and prices is what economists refer to as a “Phillips curve,” which, despite how reasonable the relationship seems, has been extensively criticized as unreliable.
One criticism concerns the use of the Phillips curve relationship as a basis for monetary policy, since the curve could suggest that a tradeoff between inflation and unemployment exists. The existence of such a tradeoff could mean that causing an increase in inflation will lower unemployment. Two notable critics of that idea, Nobel prizewinners Edmund Phelps and Milton Friedman, first argued in the late 1960s that any tradeoff between inflation and unemployment would exist only in the short run; once the public expected higher inflation in the future, the effect would disappear. Thus, expansionary monetary policy leads to more inflation rather than a decline in the unemployment rate. This critique aptly describes the Fed’s policy errors during the 1970s, which many critics of current monetary policy fear are being repeated.
More technical limitations to the Phillips curve have also been noted. In particular, the forecasting performance of various forms of the Phillips curve has been shown to be unreliable in certain time periods. In the extreme, economists have argued that in recent time periods “. . . Phillips curves are not useful for forecasting inflation.” This is not a mainstream conclusion particularly among economic forecasters, but the instability of the relationship is widely recognized and is a real challenge for central banks.
Conversely, a recent paper by James Stock and Mark Watson argues pretty convincingly that “U.S. recessions are associated with declines in inflation.” In their work, Stock and Watson use a time-scaling technique to compare increases in unemployment and declines in inflation over business cycles. Using the time scaling technique, they are able to compare similar points in time during business cycles of various lengths. Their results point to a more stable relationship between the rise of unemployment in recessions and lower subsequent trend rates of inflation.
In order to focus a little deeper on the underlying response of labor costs to unemployment, we explore the connection between elevated unemployment levels and the rate of increase in labor costs, using Stock and Watson’s technique. We conclude that labor cost growth has already declined markedly, and labor costs are likely to be a significant restraining force on inflation going forward. Furthermore, the patterns of past recessions indicate that most of the decline in labor cost growth may have been already realized.
Ultimately, we will have to look back on the next couple of years of data to see how influential elevated unemployment rates were on the inflation process, but in the meantime, economic projections for inflation have to be guided by something. At the very least, projections must assume an implicit view on the question of what effect unemployment has on compensation growth and inflation.
Recent Compensation Trends
In this analysis, we primarily use the employment cost index or ECI to measure growth trends in labor costs. The ECI comprises two series: wages and salaries, and benefits. Wages and salaries includes all types of salaried and hourly wage rates, but we will refer to the series as wage growth for brevity’s sake. Wages and salaries typically contain the clearest information about firms’ pricing decisions, as changes in benefits can often be out of a firm’s control. But since benefits make up about 30 percent of total compensation (according to the Bureau of Labor Statistics’ Employer Costs for Employee Compensation), we do include them in our analysis. Note that the type of benefits included in the ECI go beyond your traditional health insurance coverage. Overtime pay, vacation days, sick time, pension and other retirement plans, and social security and unemployment insurance are all accounted for under the ECI’s benefits series.
One key factor in choosing to use the ECI data as the source of wages or compensation data is that it is structured as a price index, with a fixed set of occupations designed to be representative of the typical U.S. workforce. This prevents distortions in the data that might occur during recessions as certain employment groups decline. It also helps to avoid the cyclical variability that other pay measures are exposed to.
The ECI data do not go back very far, so results should be interpreted with caution. To check the sensitivity of our results to the limited sample period, we redo the analysis with various other measures of employment costs (compensation per hour, average weekly wages).These measures have longer histories but produce similar results.
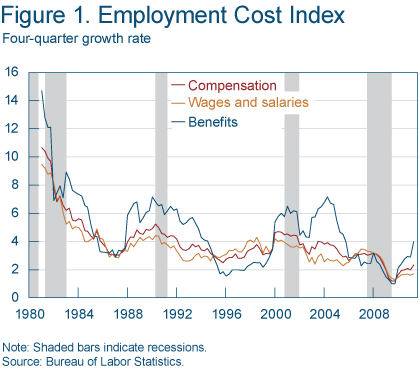
Even though the ECI total compensation series only began to be reported in the early 1980s, it clearly shows that compensation growth has tended to decline during and after recessions (figure 1). It also shows that compensation growth is not recovering like it used to: It has not returned to its prerecession level in any of the recent business cycles. This is despite the fact that benefits costs have at times increased rapidly.

Note: Shaded bars indicate recessions.
Source: Bureau of Labor Statistics
Compensation growth has slowed 2.5 percentage points from its peak in 1990. The latest figures put growth at only 2.5 percent over the past four quarters. The decline reflects both wage and benefit reductions, although in this case, benefits growth fell more sharply, going from 6.5 percent to 1.9 percent. During the 2001 business cycle, compensation growth slowed by 1.9 percentage points, even though strong growth in some benefits such as health insurance supported total compensation growth over the period. The 2007 recession shows a similar pattern, although given what we can tell from past business cycles, the full extent of the slowdown may not yet be known.
Compensation Growth during and after Recessions
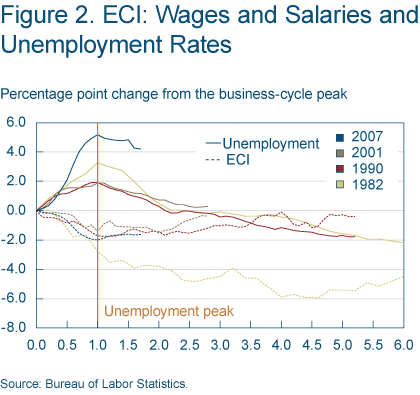
To clarify the relationship between recessions, unemployment, and compensation growth, we modify Stock and Watson’s time-scaling approach and apply it to the ECI data.1
Figure 2 shows wage growth and unemployment data scaled for comparison using this approach. While there are only three complete business cycles, a pattern is evident. Wage growth declines during recessions as the unemployment rate increases. Wage growth then stabilizes at lower levels following the peak in the unemployment rate. In the case of the 1990 recession, wage growth remained 1.5 percentage points lower than it had been at the previous business cycle peak until 1995. Following the 2001 recession and the jobless recovery, wage growth dropped 1.5 percentage points in 2005 and remained 0.5 percentage points lower all the way to the start of the 2007 recession.

Source: Bureau of Labor Statistics
Post-recession declines in unemployment do not seem to have an analogous effect on wage growth. Rather, wage growth appears to remain stable even as unemployment declines. This suggests that increases in unemployment cause a one-time adjustment in wage growth rather than there being a tight ongoing relationship between unemployment and wage growth during and after recessions.
Currently, wage growth is running in line with the two prior cycles’ patterns at about 1.6 percentage points lower than it was before the recession. In one sense, the limited decline in wage growth is surprising given that the increase in the unemployment rate is far larger in this recession. A simple regression model would support the view that the declines in wage growth are far less than expected given the size of that increase in unemployment. A regression model would also tend to anticipate increases in wages going forward rather than the relatively level pattern seen in the ECI in past recoveries. Of course, such an analysis would also point to the limited statistical reliability of the estimates due to the very small number of observations.
Compensation growth is a better overall measure of labor costs than wage growth, because producers have to set their prices to cover both wage and benefits costs. Yet benefits costs are more variable than wage and salary payments (see figure 1). Indeed, anecdotal reports from business contacts suggest that benefits costs are subject to surprises that can make them harder to contain. Still, over time, employers also report adjusting either wages or benefit-program costs in order to hit a given labor cost target.
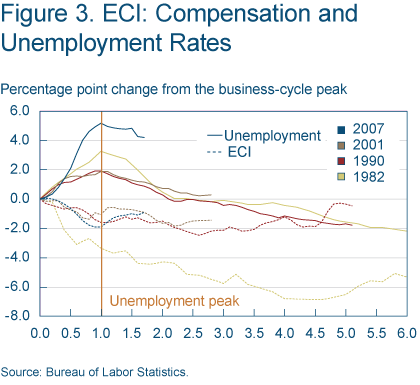
Applying the Stock and Watson approach to compensation data reveals a pattern similar to wage growth (figure 3). Compensation growth declines in recessions as the unemployment rate increases, then stabilizes at lower levels following the peak in the unemployment rate. In the case of the 1990 recession, compensation growth remained roughly 2.2 percentage points lower until 1999. Following the 2001 recession and the jobless recovery, compensation growth remained about 1.5 percentage points lower all the way to the start of the 2007 recession. Currently, compensation growth is running between the two prior cycles’ patterns at 0.9 percentage points lower than it was before the recession. Again, conventional regression methods would indicate that the current declines in compensation are far less than expected given the increases in unemployment.

Source: Bureau of Labor Statistics

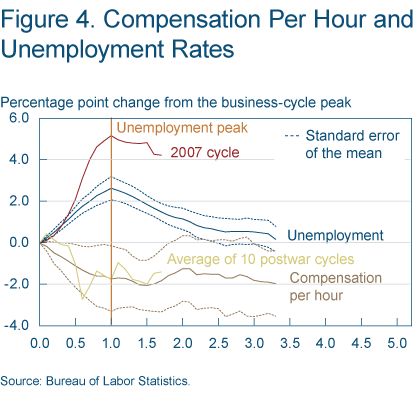
Source: Bureau of Labor Statistics
Applying the Stock and Watson procedure to one of the data series with a longer history yields similar conclusions. Averaged over the ten post-World War II business cycles, compensation per hour decreased as unemployment significantly increased. A period of declining unemployment yet stagnant compensation growth followed (figure 4).
While detailed results on total compensation are inherently limited by data availability, our analysis of recent business cycles reveals three simple observations:
- The increase in unemployment associated with the past three recessions has in each case significantly dampened compensation growth
- Elevated unemployment rates past the peak of the unemployment rate have not tended to lower compensation growth further
- Declines in unemployment rates following the peak in unemployment have not resulted in an immediate acceleration in compensation growth.
While this pattern is very consistent with Stock and Watson’s results for a lower inflation trend following recessions, this pattern is not fully consistent with the most basic Phillips curve. The breakdown lies in the period following the peak in unemployment. The theory states that as the unemployment rate declines, labor costs should increase. In our analysis, we find that labor costs remain subdued following the peak in unemployment.
Subdued Compensation Growth and the Inflation Outlook
Intuitively, it makes sense that subdued labor costs should act as a restraint on future inflation for a number of reasons. Labor compensation is the main input cost companies must consider when setting prices. Labor costs are a substantial share of the total cost of producing and providing services—for example, legal services, medical care, or barber shops—and other services now make up a much larger share of our economy. Notably, they represent about 60 percent of consumer purchases in the CPI basket. Inflation in the service components of the CPI has in fact been highly correlated (0.72) with compensation growth since the early 1980s. Even though none of these results offers evidence of which way the causation might run, they are consistent with a period of restrained price changes in many parts of the consumer market basket.
To add more of a causal interpretation requires an economic model of the price setters’ decision process, which links wage and price setting in a manner consistent with rational inflation expectations. The literature on “New-Keynesian Phillips curves” provides such a framework and addresses many of the early critiques of Phillips curves. For example, Jordi Gali, Mark Gertler, and Argia Sbordone have developed models where firms set their product prices infrequently based on their costs. This implies a tight link between labor costs and inflation, as forward-looking pricing rules respond to cover current and future labor costs.
These models also stress the importance of accounting for productivity growth by considering the cost of a representative unit of output or unit labor costs. We have ignored unit labor costs to this point in the Commentary because volatility in productivity growth across the business cycle tends to hide the compensation growth patterns. Still, for compensation growth to put upward pressure on inflation, it needs to exceed productivity growth and the current rate of inflation. Today that is not the case. With compensation growth at 2.3 percent, it is near the trend rate of productivity growth of about 2.0 percent and well below the sum of productivity growth and inflation. This implies that the labor market is applying no pressure on the pricing of domestic producers.
This lack of labor cost pressures is also being currently confirmed by many businesses. In anecdotal surveys conducted by the Federal Reserve Bank of Cleveland for the Beige Book, contacts have frequently reported that subdued compensation growth has been a critical factor behind limited product price increases even while commodity prices accelerated in the spring of 2011.
While our analysis did not clarify how long subdued compensation growth might be expected to continue, forecasters and policymakers should continue to be watchful for signs of acceleration. However, recent indicators point to minimal expectations of wage increases over the next year. Moreover, evidence from recent business cycles argues that compensation growth has been and is likely to remain rather subdued until the recovery has progressed much further, which is helping to dampen cost pressures for both domestic goods and service producers.
An inflation scare driven by other factors, like consumer inflation expectations or commodity price increases, cannot be ruled out even with high unemployment rates. However, for that inflation to be sustained like it was in the 1970s, we would need to see a sharp turnaround in compensation growth.
Footnote
- The time dimension of each data series has been rescaled so 0 is the start of the recession (as declared by the National Bureau of Economic Research or NBER), while 1.0 occurs at the peak of the unemployment rate. Figures 2-4 plot percentage point changes in the unemployment rate and wage and compensation growth from the NBER-designated business-cycle peak, which helps to account for the previous trend in the data. Return
Recommended Reading
- “Are Phillips Curves Useful for Forecasting Inflation?” by Andrew Atkeson and Lee E. Ohanian, 2001. Federal Reserve Bank of Minneapolis, Quarterly Review, vol. 25, no. 1.
- “The Role of Monetary Policy” by Milton Friedman, 1968. American Economic Review, vol. 58.
- “Inflation Dynamics: A Structural Econometric Analysis,” by Jordi Gali and Mark Gertler. 1999. Journal of Monetary Economics, vol. 44.
- “Modeling Inflation after the Crisis,” by James Stock and Mark W. Watson, 2011. Presented at the 2010 Jackson Hole Symposium, as published in Macroeconomic Challenges: the Decade Ahead, Federal Reserve Bank of Kansas City.
- “Phillips Curves, Expectations of Inflation, and Optimal Unemployment over Time,” by Edmund S. Phelps, 1967. Economica, vol. 34.
- “Prices and Unit Labor Costs: A New Test of Price Stickiness,” by Argia Sbordone, 2002. Journal of Monetary Economics, vol. 49.
Suggested Citation
Fee, Kyle D., and Mark E. Schweitzer. 2011. “Unemployment, Labor Costs, and Recessions: Implications for the Inflation Outlook.” Federal Reserve Bank of Cleveland, Economic Commentary 2011-17. https://doi.org/10.26509/frbc-ec-201117
This work by Federal Reserve Bank of Cleveland is licensed under Creative Commons Attribution-NonCommercial 4.0 International


