

- Share
Buy a Home or Rent: A Better Way to Choose
Knowing whether buying a home is a better financial move for a family than renting requires a consideration of costs and options that people often neglect to factor in. One aspect of the calculation that is almost always overlooked is uncertainty—the fact that no matter how good one’s estimates of the future are, the future can turn out differently than projected. Incorporating uncertainty into the rent-or-buy calculation gives potential homebuyers information that can improve their decisions. While incorporating uncertainty is complicated, it’s made easier with the Cleveland Fed’s online calculator.

The views authors express in Economic Commentary are theirs and not necessarily those of the Federal Reserve Bank of Cleveland or the Board of Governors of the Federal Reserve System. The series editor is Tasia Hane. This paper and its data are subject to revision; please visit clevelandfed.org for updates.
Knowing whether buying a home is a better financial move for a family than renting requires a consideration of costs and options that people often neglect to factor in. One aspect of the calculation that is almost always overlooked is uncertainty—the fact that no matter how good one’s estimates of the future are, the future can turn out differently than projected. Incorporating uncertainty into the rent-or-buy calculation gives potential homebuyers information that can improve their decisions. While incorporating uncertainty is complicated, it’s made easier with the Cleveland Fed’s online calculator.
Buying a home is the largest and most complex financial decision an average family will make in its lifetime. Even with the recent decline in home prices, the share of net worth that a typical U.S. household invests in its home equity—12 percent—is sizeable. Such a large investment requires careful consideration.
What makes the decision complex is the large number of variables that must be taken into account. Of course when buying a home there are choices to make on location, nearby amenities, school systems, and so on, but the financial decision itself involves a host of other variables.
While the basic questions might seem simple—“how much can I afford?” and “will the home be worth more than I paid for it when I sell it?”—the answers depend partly on other choices being made. Do you go for a 15-year mortgage or a 30-year? Do you choose a fixed rate or an adjustable rate? The answers also depend on conditions outside of a homeowner’s control. If you choose an adjustable rate, for example, what is the likely future path of your rate? Will you be able to handle it in 5 or 10 years? How much is the home you might buy likely to appreciate? How will the economy be doing in 5, 10, or 20 years?
So the decision process around buying a home requires making some good guesses about the future. And while most people can come up with guesses for all of these questions, taking the forecasting process one step further could help them improve their results. Even the most sophisticated forecasts can diverge in the end from what actually happens. By taking that uncertainty into account, homebuyers can see what outcomes their choices might lead to if conditions turn out differently than they expect. For example, what would the impact on a family’s wealth be if the actual appreciation rate of their home is lower or higher than anticipated? What would their mortgage payments be if their adjustable rate happens to be lower or higher than the forecast?
Our goal in this Commentary is to show how this uncertainty can affect the decision to buy a home. We describe the ways in which some important factors influence the possible financial outcomes of owning a home, and we introduce a tool for working through the decision.
A Framework for Thinking through the Home-buying Decision
A good way to get a handle on the financial implications of buying a home is to calculate the costs and potential gains of owning a home for some period of time and compare them to those for renting. People typically compare monthly mortgage payments and rents, but many more factors figure into the financial equation. Taking more of those factors into account can give a potential homebuyer a much better idea of which option will really cost less in the end or which will provide greater financial gain.
To illustrate the complexity of the buy versus rent decision, we start by examining the underlying costs and potential gains involved in owning and renting (table 1). Then we consider some of the factors that can affect those costs and gains. On the homeownership side, the key potential gain is the equity the owner extracts from the house when he sells the property. From that equity we subtract the cost of maintenance and property taxes as well as other homeowner expenses such as insurance. The federal tax code allows some homeowners to deduct their mortgage interest and property tax payments from their taxable income, which results in significant tax savings. The tax benefits are added as a plus that reduces the net cost of homeownership.
Table 1. Comparison of Costs
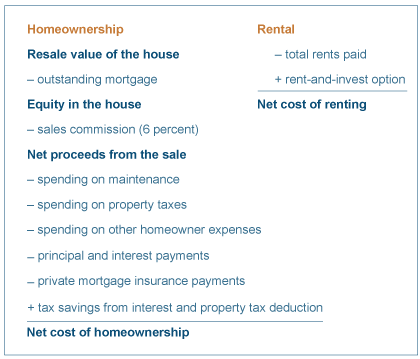
However, the potential tax savings from owning the home depend in part on whether or not you are itemizing your deductions at tax time, your marginal tax rate, and whether or not you are subject to the Alternative Minimum Tax. While mortgage interest and property tax payments can be deducted from taxable income, this deduction does not make sense for everyone. For many moderate-income individuals, the standard deduction is greater than their itemized deductions. Therefore these individuals do not receive the tax-benefit of their housing expenses.
On the rental side, the key cost is the aggregate rent payment. To see the potential gains, consider a renter’s ability to save money and invest. Because people tend to move into larger houses with more amenities when they buy a home relative to the property they have been renting, the mortgage payment plus property taxes and maintenance costs will typically be larger than the rent payment. This means that if a family chooses to remain renters, they could be saving the difference between the rent and the money they would have spent as homeowners, and that savings could be invested and earn income over time. The value of the savings is the potential financial gain of renting, and the difference between it and the total rent expense is the net cost of renting.
Considering all of these costs and gains gives a more accurate estimate of the potential gain (or loss) of owning and renting, and that information can help people decide between the two options. However, while these potential gains and losses can be estimated into the future, they cannot be known for certain. That uncertainty can impact the homeownership decision as well.
To see how uncertainty affects the cost of either option, let us suppose you are considering the purchase of a $100,000 house with a $10,000 down payment and a fixed-rate mortgage. All the details of the purchase are in table 2.
| Home details | |
|---|---|
| Purchase price | $100,000 |
| Estimated annual appreciation | 2% |
| Length of time you will own the home | 15 years |
| Property tax | 1.8% of home value per year |
| Maintenance costs | 2% of home value per year |
| Homeowner’s insurance (HOI) | 0.25% of home value per year |
| Mortgage details | |
| Down payment | $10,000 |
| Closing costs | $2,500 |
| Length of mortgage | 30 years |
| Fixed or adjustable | Fixed |
| Mortgage rate | 5% |
| Points | 0 |
| Rent and anticipated rent inflation | |
| Rent | $700 |
| Renter’s insurance | 4% of monthly rent |
| Rent inflation | 2% |
| Other assumptions | |
| Itemize mortgage interest for tax deductions? | Yes |
| Marginal income tax rate | 25% |
| Savings rate | 50% |
| CPI Inflation | 2% per year |
| Alternative investment yield | 6% |
To calculate the equity that you will extract, we need to estimate the home’s appreciation during the time you own it. Over the last 100 years, with the exception of the boom in the last decade, home prices grew on average at the rate of inflation. So let us assume that home prices will grow, on average, 2 percent per year for the next 15 years, which we will say is the expected duration of ownership in this case. Next, we assume that your marginal tax rate is 25 percent and that you will itemize. Going back to the example in table 2, our calculations suggest that the inflation-adjusted value of your tax savings over 15 years is about $20,000. With these assumptions, your house will be worth almost $135,000 15 years from now.
Let us suppose now that your anticipated appreciation rate turns out to be off by 0.1 percent, which we would consider a minor error. If the actual appreciation is 2.1 percent, the home is worth almost $137,000 in 15 years; if the appreciation is 1.9 percent, the future value of the house is close to $133,000. The $4,000 difference between the two valuations 15 years from now is equivalent to $2,941 in today’s dollars (adjusting for 2 percent inflation). In other words, the financial impact of a very small deviation in the actual appreciation rate from your expected rate could be as large as 2.9 percent of your home’s eventual value. The major uncertainty on the rental side is around the returns that can be earned with the rent-and-invest option. Those returns depend significantly on the particular alternative uses people choose for the money they’re not spending on a house. Their investment choices will be based on guesses about future returns, but those guesses could easily be wrong.
Most people look at the long-term performance of various asset classes to form their expectations about future returns. For example, the average return on stocks from 1950 to 2008 was 11 percent. Average inflation over this period was only 3.5 percent. In other words, stocks delivered returns that outpaced the decline in the purchasing power of the dollar. But assuming that returns in some particular period in the future will be similar to that average ignores the possibility of a decade of flat real returns (like the 1970s), two decades of double-digit returns (like the 1980s and 1990s), or a decade of negative returns (like the first decade of this century). These kind of fluctuating conditions can have a significant impact on the decision to purchase a home.
Let’s say you choose an alternative investment with an expected yield of 6 percent (table 2). Instead of buying a house, if you could invest everything you would have spent on the home—your down payment, closing costs, the difference between your rent and your mortgage payment, the property taxes, and the expected maintenance costs—in this alternative, you would have significant savings in the bank at the end of 15 years. Of course, most people will not save everything they can, so we assume that you will realize only 50 percent of your savings potential when you are renting. For example, your $100,000 home with a $90,000 mortgage will have an initial monthly principal and interest payment of $483. In addition, you will pay $39 for private mortgage insurance (until you have 20 percent equity) and $250 for property taxes and homeowner’s insurance, which brings the total up to $772. In table 1 we assumed that your rent is $700, which means you save $72 a month by renting. Half of that equals $36 a month, which translates into $28,000 in savings at the end of 15 years in today’s dollars. This amount assumes that you saved all of the money you would have spent on down payment and closing costs.
The uncertainty that investment returns are subject to could affect these calculations considerably. If your expectation is off by 1 percent (up or down), for example, your savings could be as high as $32,000 or as low as $24,000. The difference, $8,000, is equivalent to 8 percent of the value of our hypothetical home.
The rent-or-buy comparison gets even more complex if we work with an adjustable-rate mortgage. Consider the mortgage described in table 3. The mortgage rate is 4 percent. It is constant for two years, but it can be contractually reset to as high as 12 percent. Under the worst-case scenario, the rates will adjust higher at the maximum possible increments, and a 12 percent mortgage rate will be reached in the sixth year. While the first principal and interest payment on the mortgage was $430, the payment may adjust to as high as $883, more than a 100 percent increase in six years.
| Mortgage details | |
|---|---|
| Initial mortgage rate | 4% |
| Points | 0 |
| Initial fixed rate period | 2 years |
| Adjustment period after initial fixed | 1 year |
| Floor | 3% |
| Initial adjustment cap | 2% |
| Rate adjustment cap | 2% |
| Lifetime cap | 12% |
Accounting for Uncertainty
The discussion so far shows that deviations from expectations on home appreciation rates, investment returns, and adjustments to mortgage rates all have a significant impact on the homebuyer’s welfare. We have considered slight deviations from forecasts in these variables, but the deviations can be much greater in actuality. We also considered each factor in isolation, but more than one can deviate from expectations at a time, and the results can be unexpected. Allowing these factors to change randomly rather than being fixed at their expected levels and observing how they interact would be informative.
Using the home purchase calculator on Clevelandfed.org, we ran an experiment in which home appreciation rates could be anywhere between −2 percent and 6 percent, with the most likely outcomes concentrated around 2 percent. This gave us an expected appreciation rate of 2 percent but with a lot of volatility. Similarly, we assumed that the alternative investment yield varied between 0 percent and 12 percent, with the most likely outcomes concentrated around the middle point, 6 percent. For additional flavor, we adopted the adjustable-rate mortgage and assumed that over the life of the loan, interest rates could vary between 4 percent and 12 percent.
To incorporate uncertainty into our calculations, we have to repeat this experiment multiple times, observing a different outcome for home appreciation, the mortgage rate, and asset returns each time. The home-purchase calculator lets us do this complex task easily. Using the parameters in tables 1 and 2 with the uncertain outcomes above, the calculator repeats our experiment 1,500 times and counts the number of times the net cost of homeownership is lower than the net cost of renting. In this case, homeownership is the better choice.
Figure 1 illustrates why this is so, by assigning the relative homeownership gain or loss obtained from each simulation to one of 4 bins. The label under each bin denotes the range of the outcomes it contains. For example, a gain of $2,000 from homeownership relative to renting would be counted in the third bin, which covers the $0 to $5,000 range. Of the 1,500 simulations that we ran, 45.8 percent fell into that range. Similarly, a loss of $8,000 would go into the first bin. The height of each bar represents the frequency with which outcomes fell into a particular bin. For example, 6.87 percent of our outcomes were in the −$5,000 (loss) to $0 range.
Figure 1. Outcome Distributions
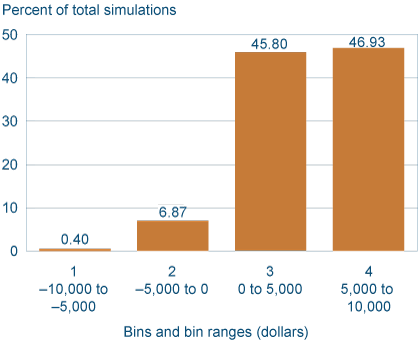
Source: Authors’ calculations.
Two important observations can be made from figure 1. First, given our parameter choices, losses from homeownership up to $10,000 and gains up to $10,000 are possible. And second, 92.7 percent of the experiments lead to a positive outcome for homeownership. We deduce that the probability of a gain from homeownership is 92.7 percent given our parameter choices. Keep in mind that if we chose different parameter values, the probability of a gain to home ownership could be very different, even the opposite. But wouldn’t that be good to know before deciding to buy a home?
Buy or Rent?
Just like any other investment, there are risks associated with a home purchase. Understanding the nature and magnitude of the risks is a crucial first step in making an informed decision about whether you are comfortable with the potential returns of buying a home. People differ in their risk tolerance, so we cannot tell you if the purchase is the right move for you.
Furthermore, financial concerns are clearly not the only driver of home purchases. There are many benefits and costs associated with homeownership that cannot be expressed in dollars. For example, on the benefit side, people like to have a home they can call their own, they like to work in their yards, and so on. On the cost side, some people don’t like to spend their time mowing the lawn or shoveling snow.
We realize that the decision to buy or rent goes beyond a consideration of financial outcomes. But taking them into account is the only way to get an accurate idea of whether buying a home is really a better choice for a family financially than renting. And while it can be difficult to calculate the likely future outcomes, a tool like the Cleveland Fed’s home purchase calculator can make it easier.
Suggested Citation
Ergungor, O. Emre, and Saeed Zaman. 2011. “Buy a Home or Rent: A Better Way to Choose.” Federal Reserve Bank of Cleveland, Economic Commentary 2011-06. https://doi.org/10.26509/frbc-ec-201106
This work by Federal Reserve Bank of Cleveland is licensed under Creative Commons Attribution-NonCommercial 4.0 International

