- Share
High Unemployment after the Recession: Mostly Cyclical, but Adjusting Slowly
The views authors express in Economic Commentary are theirs and not necessarily those of the Federal Reserve Bank of Cleveland or the Board of Governors of the Federal Reserve System. The series editor is Tasia Hane. This paper and its data are subject to revision; please visit clevelandfed.org for updates.
Unemployment has remained very high since the end of last recession, leading some economists to suggest that the underlying trend of the unemployment rate must have risen, driving unemployment permanently higher. Using a more accurate method of calculating the underlying trend, I find that the long-term rate has not risen and that most of the recent increase in the unemployment rate can be attributed to cyclical causes. But the weak nature of the recovery in real output and the slow rate of worker reallocation are likely to keep unemployment at relatively high levels for the near term.
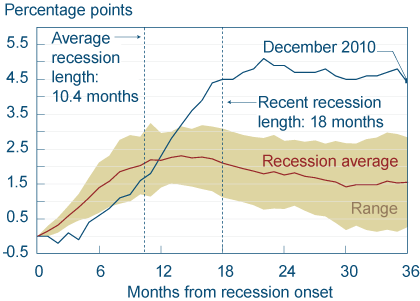
The unemployment rate rose above 9 percent during the recession and it has stayed there for the past 20 months—an unprecedented combination. The only time since the Great Depression that unemployment was higher was after the 1982 recession, but that elevated level didn’t last quite as long—only 19 months. While there is nothing surprising about a high unemployment rate in the midst of a recession, this time around has been unusual on two counts. First, the margin by which unemployment increased was substantially greater than in other recessions, and second, 20 months is an exceptionally long time for the unemployment rate to remain so elevated. Historically, unemployment has always increased whenever the aggregate economy experienced a recession. But the rate typically peaks about 15 months after the beginning of the recession, or 4 months after the end of the recession, and then starts to drop gradually over time as the economy recovers (see figure 1).
Figure 1. Cumulative Increase in the Unemployment Rate

Note: The recession average is the average unemployment rate progression for postwar recessions, and the range is plus or minus one standard deviation.
Source: Bureau of Labor Statistics.
Many economists, policymakers, and forecasters anticipate that the unemployment rate will stay above 9 percent over the near term. Their forecasts typically assume that the underlying trend of the unemployment rate, sometimes dubbed the “natural rate of unemployment,” must have risen over the course of the last recession. But it is more likely, given the size of the drop in aggregate economic activity during the recession (4.15 percent, the largest in postwar U.S. history), that the unemployment rate’s rise is due mostly to cyclical factors. I argue that even if the unemployment-rate trend has not increased, the unemployment rate could still stay high for some time. Moreover, the weakness of the recovery in real output and the slow rate of worker reallocation are likely to keep unemployment from declining to pre-recession levels any time soon.
A Framework for Understanding the Unemployment Rate Trend
In a recent Economic Commentary, Saeed Zaman and I proposed a way to measure the long-run trend of the unemployment rate over time using real output and the rates at which workers flow out of employment (separation) and into employment (job-finding). Our model assumes that the behavior of each of these rates consists of an unobserved trend component that moves relatively slowly over time and a cyclical component that fluctuates with the business cycle.
We separate the trend from the cyclical component in all the variables, and then we use the trends of the separation and job-finding flows to estimate the long-term trend of the unemployment rate. That calculation is based on the fact that, in the long run, the unemployment rate will converge to the ratio of the separation rate trend to the overall reallocation rate trend (the sum of the job-finding and separation-rate trends). (For a more detailed description of the model and results see Tasci, 2010.)
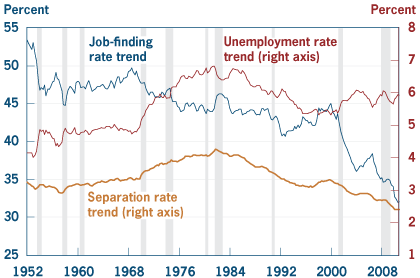
We show that when measured this way, the unemployment rate trend, or the natural rate, has been relatively stable in the last decade, even after the most recent recession (see figure 2). How the trend could have changed so little while unemployment has been so high is explained by the large size of the aggregate shock during the recession and two offsetting trends in the flows: The trend in job-finding rates, after being relatively stable for decades, declined by a significant margin in the last decade, pushing trend unemployment up. However, this effect has been partially offset by the trend in separation rates, which has been declining continuously since the 1980s. Along with the more apparent declining trend in separation rates, the declining trend in job-finding rates essentially implies that U.S. labor markets are exhibiting increasingly less worker reallocation.
Figure 2. Flows and the Unemployment Rate

Note: The job-finding and separation rates are expressed as probabilities. Shaded bars indicate recessions.
Sources: Bureau of Labor Statistics; author’s calculations.
This framework based on worker flows can be used to address several important questions about what the expected path of unemployment might be under different scenarios. For instance, we can estimate the effect of a stronger recovery in output (like we had after the 1982 recession) or higher rates of worker reallocation (like we had in the 1980s) on the adjustment path of the unemployment rate in the near term.
The Impact of Lower Worker Reallocation Rates
Low rates of worker reallocation could have important implications for unemployment dynamics in the near term. In theory, the more labor market churning there is in an economy, the faster the unemployment rate returns to its trend. Intuitively, as unemployed workers start finding jobs at a higher rate, unemployment will decline faster toward its trend. The same is true when unemployment is lower than its trend level.
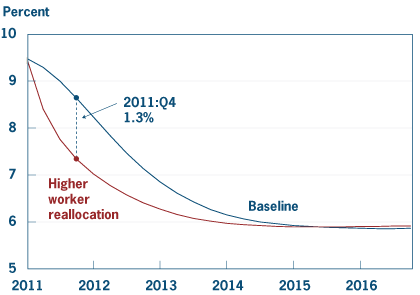
To understand the impact of worker reallocation on the rate of the decline in the unemployment rate, we use our model to generate simulations of the adjustment to trend unemployment based on two different starting points. In the baseline case, we start from our current low estimates of job-finding and separation rate trends. In the alternative case, we start from the (relatively high) job-finding rate trend that was observed in the 1980s and a correspondingly high separation rate trend—this results in the same implied unemployment rate trend as the baseline case but the labor reallocation rate is higher. Figure 3 shows the results of this experiment. The conclusion is clear; the current worker reallocation rate trend predicts a slower decline in the unemployment rate. This difference could be as high as 1.3 percentage points along the transition path.
Figure 3. Adjustment Delay in the Unemployment Rate

Note: Dates indicated represent the first quarter of each year.
Source: Author’s calculations.
The Impact of Weaker Real Output Growth
The previous exercise shows that the current recovery will be slower than it would have been had labor turnover been higher. However, the adjustment may be even slower than we calculated in that exercise, because recent GDP growth has been more anemic than the GDP forecasts we used in our simulations. Our framework assumes that the decline in the unemployment rate is a function of the cyclical decline (or increase) in real output. It implies that strong output growth will lead to a faster recovery in the labor market, as the cyclical components of the job-finding and separation rates disappear sooner, thereby lowering the cyclical component of the observed unemployment rate.
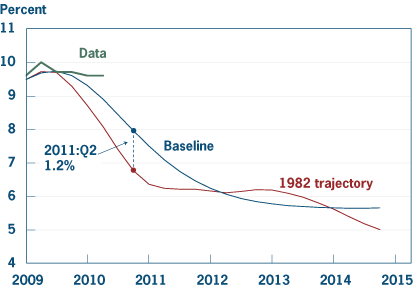
Figure 4 provides some evidence that the current pace of the recovery in real output is subpar by historical standards. We use our baseline model to generate growth rate predictions that would be consistent with a typical historical pattern, starting from the first quarter of the recovery, 2009:Q3. According to these predictions, the growth rate of real GDP should be twice the rate it is in the data at this point in the recovery process, at least during the last three quarters in the sample. Based on our parameter estimates, average growth rates at this point in the cycle would have been around 4.5 percent (annualized).
Figure 4. GDP Growth Rates

Note:Dates indicated represent the third quarter of each year.
Source: Author’s calculations.
We conduct another simulation using an alternative trajectory for GDP growth to see how much of an impact it might have on the unemployment rate adjustment. In place of the GDP figures used in the baseline simulation, we assume that GDP growth behaved as it did in the recovery after the 1982 recession. We chose that period because the size of the aggregate shocks in that recession and in the recent recession are comparable. To do the alternative simulations, we back out the realization of shocks to real output from 1982:Q3 forward and feed them into the model, generating unemployment rate and output realizations. Comparing the resulting two forecasts shows that the decline in the unemployment rate could be significantly lower with a weaker recovery, as large as 1.2 percentage points (see figure 5).
Figure 5. Unemployment Rates

Note: Dates indicated represent the third quarter of each year.
Source: Author’s calculations.
As both of these experiments suggest, even if the unemployment rate trend did not change appreciably after the last recession, it does not necessarily imply an optimistic path for the unemployment rate in the near term. The strength of real output growth and the effects of slower worker reallocation in the U.S. labor market will be among the crucial factors determining this adjustment process. The significance of the latter factor suggests that structural reasons behind slow worker reallocation might have important implications for unemployment dynamics over business cycles. Hence, even if most of the recent rise in the observed unemployment rate was caused by cyclical factors, structural changes in the labor market—causing lower worker reallocation rates—might be preventing that cyclical unemployment from disappearing sooner than it used to.
Other Factors
In addition to the channels we explored here, there are a number of other factors that could potentially affect the adjustment process in the near term. For instance, if a significant fraction of the unemployed workers who are currently receiving emergency unemployment compensation drop out of the labor force when these benefits expire, we might see a faster decline in the unemployment rate. On the other hand, if the economic recovery gains traction and motivates some discouraged workers to rejoin the labor force and search for a job again, the unemployment rate might decline even more slowly.
References and Recommended Reading
- “Unemployment after the Recession: A New Natural Rate?” by Murat Tasci and Saeed Zaman. Federal Reserve Bank of Cleveland, Economic Commentary, no. 2010–11 (September 2010).
- “The Ins and Outs of Unemployment in the Long Run: A New Estimate for the Natural Rate?” by Murat Tasci. Federal Reserve Bank of Cleveland, working paper no. 10–17R, (October 2010).
- “Labor Force Participation and the Future Path of Unemployment,” by Mary Daly, Bart Hobjin, and Joyce Kwok. Federal Reserve Bank of San Francisco, Economic Letter, no. 2010–27 (September 2010).
Suggested Citation
Tasci, Murat. 2011. “High Unemployment after the Recession: Mostly Cyclical, but Adjusting Slowly.” Federal Reserve Bank of Cleveland, Economic Commentary 2011-02. https://doi.org/10.26509/frbc-ec-201102
This work by Federal Reserve Bank of Cleveland is licensed under Creative Commons Attribution-NonCommercial 4.0 International


