- Share
Inflation: Noise, Risk, and Expectations
The most frequently cited measures of inflation expectations, from TIPS-derived indicators to survey-based estimates like Blue Chip forecasts, have some inherent limitations when it comes to applying them to questions of monetary policy.
The views authors express in Economic Commentary are theirs and not necessarily those of the Federal Reserve Bank of Cleveland or the Board of Governors of the Federal Reserve System. The series editor is Tasia Hane. This paper and its data are subject to revision; please visit clevelandfed.org for updates.
If people expect high inflation, their actions can drive up prices even faster. That is why the Federal Reserve, with a mandate for price stability, pays attention to expectations of inflation. Guessing what people expect, though, presents more of a challenge than counting the unsold Hondas on a dealer’s lot. There are useful measures, some based on market instruments, some based on surveys, but often combining tools produces the most useful information.
Surveys, such as the University of Michigan’s Survey of Consumer Attitudes and Behavior or the Blue Chip Survey, directly ask people about their expectations. But these expectations are often only available for standard horizons, such as 1 or 10 years, when the relevant policy questions might concern two, three, or six years. The most watched market-based measure, the “break-even” rate derived from Treasury inflation protected securities (TIPS), uses the difference between the interest rates on a nominal Treasury bond (that is, one not indexed to inflation) and a TIPS. It too is available only at selected horizons, and it also picks up differences between the bonds that don’t have anything to do with inflation, such as liquidity and risk.
As one way to get around these problems, researchers affiliated with the Federal Reserve Bank of Cleveland have developed a model that combines data from nominal interest rates, derivatives known as inflation swaps, and two different survey measures of inflation. (for more detail, see “A New Approach to Gauging Inflation Expectations,”) This Commentary explains how the output of the model gives us cleaner, more relevant expectations of inflation and inflation risk and what those expectations might imply for monetary policy.
Expected Inflation
The Cleveland Fed model of inflation expectations provides a simple measure of expected inflation that has two advantages over the break-even rate derived from TIPS. The first is that the measure is adjusted for the inflation risk premium. Because people don’t like the risk associated with inflation, they pay less for a nominal, unprotected bond, which means it has a higher interest rate. Thus the difference between nominal bonds and TIPS overstates the expected inflation rate. And because the model does not use the difference between TIPS and Treasuries, it does not capture liquidity differences along with inflation expectations.
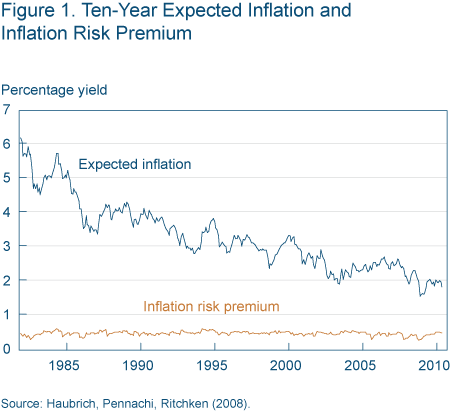
Figure 1 shows the model’s estimate of 10-year expected inflation. Expectations show a gradual decline from the early 1980s to about 2003, after which they fluctuate in the neighborhood just north of 2 percent. The financial crisis coincided with very low expectations. Despite a rebound in economic activity since the beginning of 2009, expected inflation remains very low by historical standards, a bit below 2 percent. Swiftly rising expectations could indicate a Federal Reserve that had fallen “behind the curve” in fighting inflation—resulting in a need to tighten fast and furious—but that doesn’t look like the situation we are in.

Inflation Risk
Adjusting for the inflation risk premium has an ancillary advantage: the model explicitly estimates the risk premium, producing a piece of information not readily available from either surveys or the TIPS spread. The risk premium measures how worried people are about inflation ending up significantly higher or lower than what they expect.
It’s tempting to think that inflation risk is simply the risk of high inflation, but it is rather associated with inflation deviating from expectations, whether higher or lower. Put another way, people anticipate that $10,000 will buy less in 10 years, but they are unsure exactly how much less it will buy. Similarly, when people hold nominal bonds that are not protected from inflation, they are taking a bet on inflation for the duration of the bond. Sometimes they win the bet (inflation is lower than expected), sometimes they lose (inflation is higher than expected), but either way they’re still rolling the dice.
The risk premium can move about for two very different reasons. First, the amount of inflation risk may change. Inflation may become more variable—higher highs and lower lows, and the stakes of misjudging become higher. Secondly, the stakes may stay the same, but people may become less tolerant of risk. In other words, the price of inflation risk gets higher.
What happens in the rest of the economy may affect people’s tolerance of risk. If people anticipate a lengthy recession, for example, they may be less inclined to gamble on inflation. While the risk premium can change for different reasons, the effect on behavior is similar: nominal bonds become less attractive investments relative to TIPS, resulting in higher interest rates on nominal bonds and lower rates on TIPS. This increases the difference between them so the break-even inflation rate overstates the true expectation of inflation.
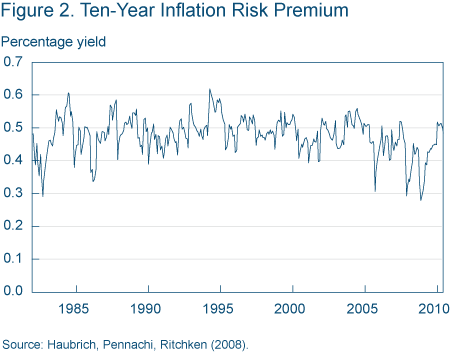
The inflation risk premium fluctuates around half a percent. (See figure 2.) This gives a rule of thumb for adjusting the break-even inflation rate to get a better estimate of true inflation expectations—take half a percentage point off. The relatively steady value of the risk premium suggests that people are not particularly worried about inflation getting far from their expectations. This again reinforces the idea that the public has confidence that the Federal Reserve is keeping inflation in check.

Removing Short-term Effects
Even “purified” expectations of inflation are not always the most useful indicators for monetary policy. They reflect a lot of short-term influences on the price level that are not really under the control of the monetary authority. In the short run, oil spills, bad weather, and other shocks mean that food, energy, and housing prices jump around, and if inflation is expected to be higher over the next year, then it quite likely averages in to a higher expected rate for the next five years. But higher prices from an oil spill today don’t really indicate much about monetary policy, and we’d somehow like a measure which looks beyond such shocks. Concepts such as the core CPI and the median CPI have addressed these questions, but they don’t correspond to the inflation protection provided by TIPS or the standard survey questions on inflation. And it’s not just a measurement issue. In the short run, there are price pressures, unemployment effects, and shifts in money demand that move the price level around in ways that are out of the control of the central bank. What’s needed is a longer-term measure of inflation expectations that purges out the short-term effects.
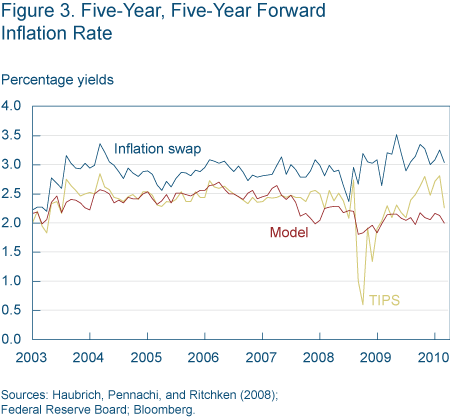
The forward inflation rate (figure 3) does that. The most popular version, the so-called “five-year, five-year forward” answers the question “in five years, what will be the expectation of inflation over the next five years?” (These forward rates might look like they adjust for liquidity differences between TIPS and nominal Treasuries, but they do not. See Charles Carlstrom and Tim Fuerst, “Expected Inflation and TIPS,” FRB Cleveland Economic Commentary, November 2004.) There are several ways of calculating the forward rate, depending on whether you measure inflation expectations from the TIPS break-even rate, from inflation swaps, or from the Cleveland model.

Figure 3 shows what a difference the approach makes: the Cleveland model shows a lower rate than the other two series over the past several quarters. It stays near 2 percent, while the other measures show a potentially worrying increase. This increase could imply that the Fed would need to tighten monetary policy in the near future. However, the model’s rate shows, if anything, a slight decrease during the most recent recession. This implies that longer-term inflation expectations are still well anchored and the time for tightening has not yet come.
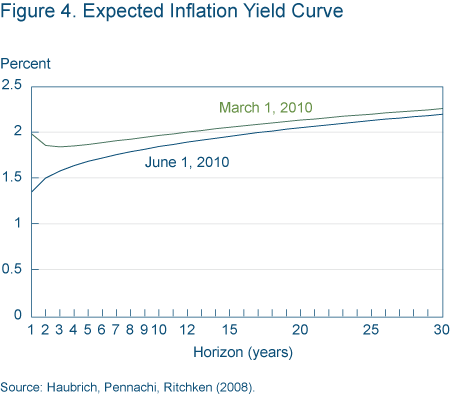
In part, the popularity of the five-year, five-year forward rate stems from a thinness in the TIPS market: TIPS are usually issued in maturities such as 5, 10, and 30 years, so it’s easier to find enough bonds around to calculate that forward spread. That might not be the most interesting spread, however. The Cleveland Fed model of inflation expectations can look at many maturities, producing a yield curve of expected inflation. One approach would be to calculate many forward rates, but another is to show expected inflation for the next 30 years, as figure 4 does (the slope of the line between any two points will give an idea of the forward rates).
Consistent with headline CPI numbers, which change monthly, short-term expectations move around quite a bit. After about five years the adjustments are tiny. Expectations of inflation appear well contained.

Conclusion
Inflation expectations can provide a clue to people’s behavior, and they can also act as an early warning system for inflation. An early increase in inflationary expectations can serve as a wake-up call to the central bank to reassess whether its policy will keep inflation in check. The measures presented here don’t indicate a current problem for the United States. But watching expectations is not a complete solution to the problem, and it should not induce complacency. Expectations take future monetary policy into account—so expectations of inflation may remain low today because people expect a vigorous Fed response in the near future. Understanding expectations is important, but it remains only one gauge on the central banker’s dashboard.
Recommended Reading
- “A New Approach to Gauging Inflation Expectations,” by Joseph G. Haubrich. Federal Reserve Bank of Cleveland, Economic Commentary (August 2009).
- “Estimating Real and Nominal Term Structures using Treasury Yields, Inflation, Inflation Forecasts, and Inflation Swap Rates,” by Joseph G. Haubrich, George Pennacchi, and Peter Ritchken. Federal Reserve Bank of Cleveland, working paper no. 0810, November 2008.
This work by Federal Reserve Bank of Cleveland is licensed under Creative Commons Attribution-NonCommercial 4.0 International


