- Share
A New Approach to Gauging Inflation Expectations
This Economic Commentary explains a relatively new method of uncovering inflation expectations, real interest rates, and an inflation-risk premium. It provides estimates of expected inflation from one month to 30 years, an estimate of the inflation-risk premium, and a measure of real interest rates, particularly a short (one-month) rate, which is not readily available from the TIPS market. Calculations using the method suggest that longer-term inflation expectations remain near historic lows. Furthermore, the inflation-risk premium is also low, which in the model means that inflation is not expected to deviate far from expectations.
The views authors express in Economic Commentary are theirs and not necessarily those of the Federal Reserve Bank of Cleveland or the Board of Governors of the Federal Reserve System. The series editor is Tasia Hane. This paper and its data are subject to revision; please visit clevelandfed.org for updates.
This Economic Commentary explains a relatively new method of uncovering inflation expectations, real interest rates, and an inflation-risk premium. It provides estimates of expected inflation from one month to 30 years, an estimate of the inflation-risk premium, and a measure of real interest rates, particularly a short (one-month) rate, which is not readily available from the TIPS market. Calculations using the method suggest that longer-term inflation expectations remain near historic lows. Furthermore, the inflation-risk premium is also low, which in the model means that inflation is not expected to deviate far from expectations.
Policymakers at the Federal Reserve and other central banks continually face the “Goldilocks” question—is monetary policy too tight, too loose, or just right? It would help if the central bank knew what real interest rates and expected inflation actually were, but these are not easy to observe. Visible indicators of these factors, such as Treasury inflation-protected securities (TIPS), survey measures of expected inflation, and nominal interest rates, are useful, but none of them alone quite tells the whole story. Nominal interest rates change with both real rates and expected inflation, survey measures ask about only a few horizons, and measures of inflation expectations coming from inflation-protected securities conflate expectations with risk premia. Uncovering a purer measure is possible, but it takes a careful combination of the available data and the application of economic theory.
People’s expectation of inflation enters into nearly every economic decision they make. It enters into large decisions: whether they can afford a mortgage payment on a new house, whether they strike for higher wages, how they invest their retirement funds. It also enters into the smaller decisions, that, in the aggregate, affect the entire economy: whether they wait for the milk to go on sale or buy it before the price goes up.
Real interest rates also play a key role in many economic decisions. When businesses invest—or don’t—in plants and equipment, when families buy—or don’t—a new car or dishwasher, they are making judgments about the real return on the object and the real cost of borrowing. As such, real interest rates can be an important guide to monetary policy. As Alan Greenspan once explained,1 keeping the real rate around its equilibrium level (which is determined by economic and financial conditions), has a “stabilizing effect on the economy” and it helps direct production “toward its long-term potential.”
Modeling Interest Rates
For economists, a model is not a toy train or runway star, but rather, a simplified description of reality, usually involving equations. It’s a way to describe how the parts of the world (or at least the financial markets) fit together. Our new approach to estimating inflation expectations starts with a model of real and nominal interest rates—in effect making assumptions and writing down equations that purport to describe how interest rates and inflation move over time.2 The model has two key parts. The first describes how short-term real interest rates and inflation move over time. The model has to capture movements of short-term rates accurately in order to describe the behavior of all interest rates accurately: If short-term rates rise, do they stay high or quickly fall; do they move smoothly or take a few big jumps? The second part of the model describes how those movements in short-term rates and inflation build up and determine longer-term interest rates and expectations.
Economists think longer-term rates such as 10-year bonds are tied to shorter rates in two ways, and the model reflects both. The first and most influential determinant of long-term rates is market expectations of future short rates. Investing in a two-year bond is a lot like investing in two one-year bonds back to back: one now and another one a year later. The yields shouldn’t get too far out of line. But because those two investments are not quite identical, long-term rates are also determined in part by something else. Because of risk, because investors don’t know what rates will be next year—longer-term bonds embed a term premium in their rates, a risk factor that makes long-term rates different from the average of expected future short rates.
This means that the model also has to describe how investors incorporate risk into interest rates. This has two parts. One has to do with capturing the amount of risk perceived to exist, which is in effect, capturing how variable short-term rates and inflation are, and the other has to do with estimating the prices of those risks. These considerations introduce several new factors into the model, including separate variability measures for inflation and interest rates, and, because investors might feel differently about variability in interest rates and inflation, separate prices of risk.
The model also needs to match two ways of looking at the data on interest rates and expectations of inflation. One is the “time series” way—how a specific interest or expected inflation rate varies over time. The other is the “cross-section” approach, which at any given date (say June 2, 1995) lists the “term structure” of rates at one month, three months, one year, and so forth. An accurate model matches both the time-series side (how rates change over time) and the cross-section side (the pattern of long and short rates at any given time). Put another way, the guess about how expected inflation moves over time must also be consistent with the relationship between long and short rates. For example, if inflation is very persistent, then seeing a high inflation rate today implies nominal long-term interest rates should also be high, as they embed the inflation that is expected to continue.
The next step is to “calibrate” the model, which involves tweaking some key numbers in the equations until the model produces results that match actual data. Some examples of these key numbers—parameters, in economists’ jargon—for the time series side are numbers describing things like how variable and persistent short-term real rates and inflation expectations are, and how large the price of risk is for both real rates and inflation. The calibration is done through a statistical analysis (in a rather complicated way we won’t go into here). It’s like calibrating a speedometer: once you measure the readings on a course you know, you can trust the reading in other situations.
In our case, the model gives predictions for nominal rates and inflation expectations derived from inflation swaps, and the parameters are moved around until predictions look similar to the actual data. More specifically, the model tries to match the yields on Treasury securities from three months to 15 years. It matches expectations of inflation coming from three different sources: Blue Chip economic forecasts, which are short-term expectations of inflation over the next several quarters; the forecasts of the Survey of Professional Forecasters (SPF), which are opinions on inflation over the next 10 years; and inflation swaps (a financial derivative in which investors swap a fixed payment for payments based on the CPI), which run the gamut from one to 30 years. Knowing there is a close match on rates we can observe, such as actual interest rates and inflation, we are more confident about what the model tells us about things that we can’t observe, such as risk factors and expectations over horizons that the surveys did not ask about.
Lessons
In a way, the story so far has been all about sharpening the knife. Now is the time to cut something with it. So what does the model tell us?
- It provides estimates of expected inflation from one month to 30 years.
- It provides an estimate of the inflation-risk premium.
- It provides a measure of real interest rates, particularly a short (one-month) rate, not readily available from the TIPS market.
Expected Inflation
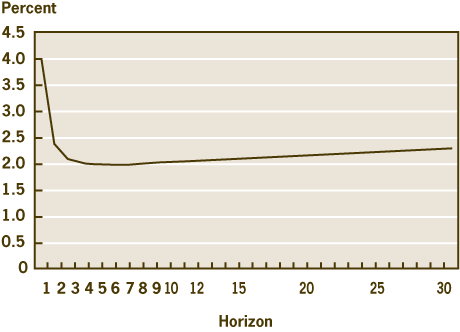
Figure 1 shows inflation expectations at an annual horizon of three months to 30 years. Despite a somewhat high one-month expectation of 4 percent, expectations rapidly return to the neighborhood of 2 percent, showing only a gradual increase after five years. In the short run, it is common for inflation to fluctuate, particularly since Blue Chip, the SPF, and inflation swaps base their expectations on the Consumer Price Index (CPI), not any of the more stable inflation measures such as the core, the median, or the trimmed-mean CPI. Big shifts in oil, gas, and food often lead to big month-to-month changes in the CPI, which often average out over the longer term. From the standpoint of the central bank, it is the longer-term trend that matters: Monetary policy determines inflation over the long haul, but it has little effect on price changes stemming from a poor harvest or a strike in the oil fields. Figure 1 shows that inflation expectations settle down after about two years; this suggests that the Federal Reserve still has credibility in keeping inflation low and that the massive increase in its balance sheet and the accompanying increase in banking system reserves has not served to unanchor the public’s expectations of inflation.
Figure 1. Expected Inflation

Note: As of September 1, 2009.
Source: Author’s calculations.
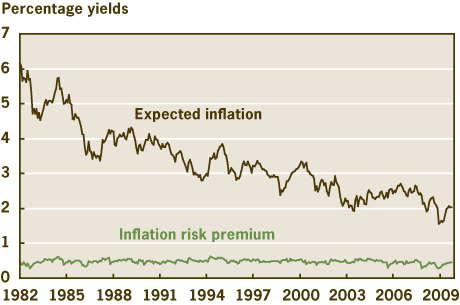
Figure 2. Ten-Year Expected Inflation and Inflation-Risk Premium

Note: As of September 1, 2009.
Source: Haubrich, Pennachi, and Ritchken (2008).
Inflation-Risk Premium
A key advantage of using this model is the ability to split out inflation expectations from the inflation-risk premium. Figure 2 plots them both for the 10-year horizon. There are three things to note in this figure. First, it documents the long, slow effort to wring out inflation psychology from the public: It took about 20 years for inflation expectations to drop from over 6 percent to around 2 percent, where they have held roughly steady for the past six years. Implicit in this is the second point, that current expectations of longer-term inflation are near historically low levels, though up a bit from earlier this year. Finally, the inflation-risk premium is rather low and quite steady.
Finding the inflation-risk premium is particularly important because it addresses the accuracy of the so-called “break-even” measures of inflation expectations (“break-even” because investors break even on their returns if inflation is as expected). These break-even rates come from financial markets, either as the difference between the interest rate on nominal Treasury bonds, which are not protected against inflation, and TIPS, which are, or from inflation swaps, where one party makes a fixed payment to receive a payment indexed to the CPI. The problem is that the break-even rate includes a risk premium. This risk premium means that the break-even rate overstates expected inflation and that changes in the break-even rate might arise from changes in the risk premium, not changes in expected inflation.
The inflation-risk premium averages around one-half of a percent for most of the period. It also varies only between 29 and 61 basis points, effectively keeping between one-third and two-thirds of a percent over the 27-year period. Such a low and steady level means that outside of special periods, such as the present, break-even inflation rates provide a reasonable measure of expected inflation. The dominant portion of the break-even rate, and by far the largest changes, come from the expectations, not the risk premium. So in most instances, a change in the break-even rate can safely be attributed to a change in expectations. In the end, the model ends up supporting the case for using TIPS as a gauge of inflation expectations.
Short-Term Real Rate, September 1, 2009
TIPS provide a direct measure of real interest rates, but most TIPS are long-term, issued only in maturities of 5, 10, or 20 years. As time passes, of course, their time to maturity shortens, but even then they are not always traded very frequently. Our model, however, can produce (or estimate) short-term real rates. Knowing short-term real rates provides a crucial element in understanding monetary policy. Comparing actual real rates with a what Alan Greenspan above termed the equilibrium rate, sometimes also called the natural or neutral real interest rate—gives an idea of whether Fed policy is expansionary or contractionary. If the Fed sets rates so that the current real interest rate is above the natural rate, policy is contractionary, and if below, expansionary. If policy calls for tightness or ease, then rates must rise or fall. Of course, the natural rate can move around with changes in the economy, so the Fed may have to do quite a bit of raising and lowering just to stay neutral. Finding the real rate is also only half the battle, and probably the easier half at that: Policymakers also have to have some idea of what the equilibrium rate is.
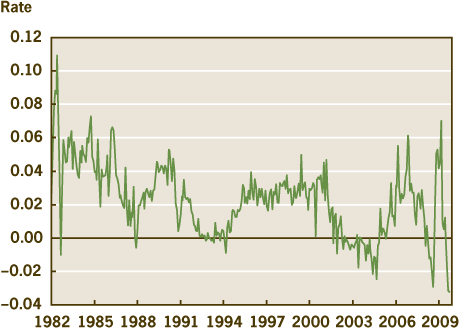
Figure 3. Real Interest Rate

Note: As of September 1, 2009.
Source: Haubrich, Pennachi, and Ritchken (2008).
A look at the short (one-month) interest rate from the model in figure 3 shows several things. Recently, the rate has been quite variable, swinging from a plus 7 to a minus 3 percent in 2009 alone, and it currently stands deep in negative territory. Overall, negative rates are uncommon, though not rare. They figure most prominently in the period from early 2002 to late 2004, a period when the Fed was worried about the possibility of deflation.
Conclusion
Financial markets provide a lot of information about the economy and expectations, but sometimes getting what you want takes a little bit of work. Our model, at the cost of some assumptions and complexity, splits out key components of interest rates, which individually often tell more about the economy than does the nominal interest rate alone.
Currently, the model indicates low rates, and stable inflation expectations. Although it is hard to estimate the equilibrium rate, the currently low level of the one-month real interest rate suggests monetary policy is reasonably accommodative. Despite this, our model provides some evidence that inflation is not expected to increase, as longer-term inflation expectations remain near historic lows, in the neighborhood of 2 percent. Furthermore, the low inflation-risk premium suggests people are reasonably confident that the dangers of inflation deviating far from their expectations are relatively low.
Footnotes
- Testimony before the Subcommittee on Economic Growth and Credit Formation of the Committee on Banking, Finance and Urban Affairs, U.S. House of Representatives, July 20, 1993, p. 11. Return
- Interested readers can find the details in “Estimating Real and Nominal Term Structures using Treasury Yields, Inflation, Inflation Forecasts, and Inflation Swap Rates,” by J. Haubrich, G. Pennacchi, and P. Ritchken. Federal Reserve Bank of Cleveland, working paper, no. 08-10. Return
This work by Federal Reserve Bank of Cleveland is licensed under Creative Commons Attribution-NonCommercial 4.0 International


