- Share
The Minimum Wage and the Labor Market
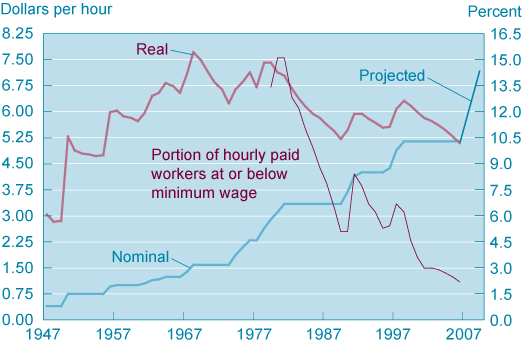
The federal minimum wage was established in 1938 by the Fair Labor Standards Act. Initially set at 25 cents an hour, the wage has been raised periodically to reflect changes in inflation and productivity. From September 1997 to the beginning of 2007, the minimum wage stood at $5.15 an hour, but its real value declined steadily from about 40 percent of the average private nonsupervisory wage to a mere 30 percent. Adjusted for inflation, the minimum wage was lower at the beginning of 2007 than at any time since 1955 (see figure 1). Meanwhile, the wage affected fewer people, as the fraction of hourly workers who earned no more than the minimum dropped from around 15 percent in 1980 to just 2.2 percent in 2006. On May 24, 2007, Congress passed a bill raising the federal minimum wage to $7.25 in three phases over two years.
The views authors express in Economic Commentary are theirs and not necessarily those of the Federal Reserve Bank of Cleveland or the Board of Governors of the Federal Reserve System. The series editor is Tasia Hane. This paper and its data are subject to revision; please visit clevelandfed.org for updates.
The federal minimum wage was established in 1938 by the Fair Labor Standards Act. Initially set at 25 cents an hour, the wage has been raised periodically to reflect changes in inflation and productivity.
From September 1997 to the beginning of 2007, the minimum wage stood at $5.15 an hour, but its real value declined steadily from about 40 percent of the average private nonsupervisory wage to a mere 30 percent. Adjusted for inflation, the minimum wage was lower at the beginning of 2007 than at any time since 1955 (see figure 1). Meanwhile, the wage affected fewer people, as the fraction of hourly workers who earned no more than the minimum dropped from around 15 percent in 1980 to just 2.2 percent in 2006. On May 24, 2007, Congress passed a bill raising the federal minimum wage to $7.25 in three phases over two years.
Figure 1. Federal Minimum Wage and Workers at or below It

Source: U.S. Department of Labor, Bureau of Labor Statistics.
To assess whether the recent increase in the minimum wage is excessive or not, one must know what it is intended to achieve. The wage’s proponents have argued that it exerts positive effects on labor market outcomes by reducing employers’ excessive market power. Its opponents, however, believe that labor markets are competitive and any wage regulation is bound to reduce employment, especially among low-skilled workers.
This debate can be clarified with the aid of economic theories that analyze the effects of the minimum wage on the labor market. These theories can help us answer questions such as: Does a minimum wage necessarily increase unemployment? Does it expand the number of people participating in the labor force? Does it improve social welfare?
Competitive and Noncompetitive Labor Markets
The effect of a minimum wage depends, in part, on whether the labor market is competitive—or not, in which case employers exert significant power over wage decisions. We review the employment effects of the minimum wage under two extreme assumptions: In the first case, there are a lot of employers competing to attract workers; in the second, there is a single employer. These extremes give us two benchmarks from which we can discuss specific situations and markets.
A perfectly competitive labor market is a composite of many firms that are in competition for workers. Firms have no power to set wages; the market determines a competitive wage. If a firm deviates from this wage, it either pays less and loses workers or pays more, sustains losses, and exits the market.
At the other extreme is a labor market that is a collection of small local markets. In each local market, some firms are in a dominant hiring position (think of a large retailer near a small city, for example). In such an employer- dominated market (referred to as a monopsonistic market by economists), a major employer has the power to set a wage unilaterally without fear of competition.
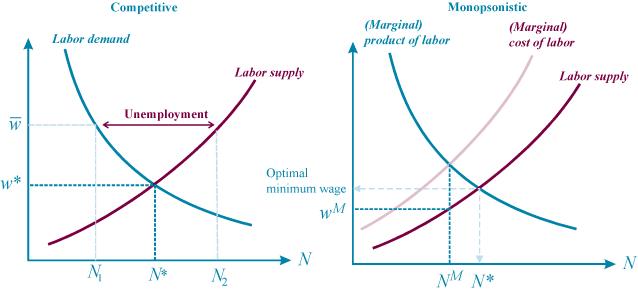
In both extremes, there are large numbers of potential workers, each of whom has a wage below which he will not work (his reservation wage). As the market wage increases, more and more people become willing to work. The relationship between the market wage and the number of workers who want to work for that amount is called the labor supply; it is represented by the upward-sloping curve in figure 2.
Figure 2. Competitive and Monopsonistic Labor Markets

The amount of output that one additional worker can contribute to the total output of the firm (the marginal product of labor) declines as the size of the workforce grows. The diminishing marginal product of labor, represented by the downward-sloping curve in figure 2, is sometimes called labor demand.
Wage Setting in Competitive Labor Markets
When a large number of firms compete for workers, the market wage must be equal to the marginal product of labor. To see the intuition behind this statement suppose that the “marginal” worker produces $5 worth of goods and services an hour. If the market wage is $4, firms can bid it up to $4.50, attract workers from other firms, and still turn a profit. If the market wage is higher, say $6, firms take a loss because workers cost more than their production is worth. In this situation, firms cut their payrolls to restore their profits. In this case, the market wage should be $5 (w* in figure 2).
The market wage must also equal the highest reservation wage of workers in the labor force: Those whose reservation wage is above $5 stay out of the labor force, whereas those whose reservation wage is below $5 enter it. In other words, under competitive conditions, the wage adjusts to clear the labor market, equalizing labor supply with labor demand. Figure 2 (left panel) shows the market wage as the intersection of the downward-sloping demand curve (the marginal product of labor) and the upward-sloping supply curve.
Suppose that Congress introduces a mandatory minimum wage of $6 (w with a line over it). Because it is more than the market wage, the minimum wage is binding. At this higher wage, firms’ demand for workers declines (from N* to N1 in the left panel of figure 2), whereas the number of people who want to participate in the market rises (from N* to N2 in the same panel). The labor market is thrown into disequilibrium. Some unemployed workers would gladly work for a lower wage but cannot find a job, and some employers would be happy to hire workers at a lower wage but the law forbids it.
Thus, in a competitive labor market, a binding minimum wage reduces employment and creates involuntary unemployment.
Wage Setting in an Employer-Dominated Labor Market
Now consider a local labor market in which a large coal mine is the community’s dominant employer (a monopsony). Because the mine has negligible competition from other firms, it can set a wage that maximizes its profits. Unlike a competitive firm, however, a monopsony cannot hire as many workers as it wants at a constant wage. If the mine wants to add workers, it must offer a higher wage to attract new labor-force entrants. Suppose, for instance, that 10 potential hires have reservation wages below $5 and another candidate has a $6 reservation wage. If the mine wants to hire 11 workers, it must raise its wage from $5 to $6 across the board. Thus the mine’s cost of adding one worker, the marginal cost of labor, has two elements: the $6 hourly wage it pays one person plus a $1 hourly increase for each of the other 10. In this case, the marginal cost of labor is $16 ($6 + $10).
The firm maximizes its profits when the cost of having an additional worker equals the value of that person’s output. Thus, in the right-hand panel of figure 2, the point where the marginal product of labor intersects with the marginal cost of labor is the employment level for a monopsonistic firm. Notice that the employment level is lower than it would be in a competitive labor market. The wage, which can be read on the labor supply curve for the monopsonistic employment level (denoted wM in figure 2), is lower than the competitive wage. So a monopsonistic firm employs fewer workers and pays them less than their marginal product.
Suppose that Congress sets a federal minimum wage that is higher than the monopsony’s wage but still below the competitive one. In that case, the curve representing the marginal cost of labor (right-hand panel of figure 2) flattens until it intersects with the labor supply curve. This happens because the cost of an additional worker is now simply the minimum wage (as long as the firm does not want to hire more workers than the number willing to work at or below this minimum wage). In this case, a minimum wage increases employment by mitigating the negative effects of a monopsony’s power. All workers gain: More of them have jobs, and those who do receive a higher wage. The employer loses because the minimum wage policy reduces its profits. In fact, the optimal level for the minimum wage is the competitive wage that maximizes employment (right-hand panel of figure 2).
Labor Markets with Search Frictions
Of course, the previous descriptions are extremely stylized and neglect several aspects of reality. In actual labor markets, both firms and workers have some power to set wages, and the market is not frictionless: It takes time and effort for a worker to find a job or for a firm to hire a suitable worker.
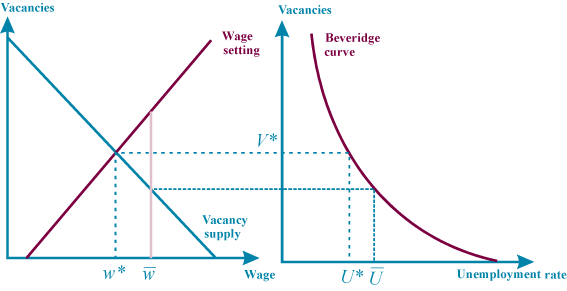
We can use the benchmark scenarios and a couple of new ideas illustrated in figure 3 (and explained in detail in “Understanding Unemployment”; see the Recommended Readings) to discuss the effect of a minimum wage in a labor market with frictions. (This approach is referred to as the search model of unemployment.)
Figure 3. Minimum Wage in a Search Model

In this model of the labor market, workers are either employed or unemployed, and jobs are either vacant or filled. Unemployed workers look for jobs, and firms open vacancies to maximize their profits. The number of vacancies that firms decide to post is given by the downward-sloping vacancy-supply curve in figure 3. Intuitively, when the wage is low, each worker generates more profits for the firm; as a result, firms post more vacancies. The wage is determined by bargaining between firms and workers (the wage-setting schedule in figure 3).
When vacancies outnumber unemployed people, firms may infer that workers have better job prospects elsewhere. As a firm’s vacancies increase, the bargained wage rises. Finally, with a given number of vacancies, the Beveridge curve, which summarizes the matching process of unemployed workers and vacancies, specifies the economy’s unemployment rate. Labor market outcomes such as wages, the number of vacancies, and the number of unemployed are determined by these three building blocks—the vacancy-supply curve, the wage-setting schedule, and the Beveridge curve.
Suppose the government introduces a minimum wage that exceeds the market wage (figure 3). The wage-setting curve then has a vertical portion at the minimum wage. As higher wages cut into their profits, firms open fewer vacancies, and the unemployment rate increases (from U* to U with a line over it in the figure). So in this scenario, a binding minimum wage raises both wages and unemployment.
Workers’ Job-Search Effort
Let’s enrich our description of the labor market now by assuming that workers can choose the intensity with which they search for a job—how much time they spend looking for a job, how many application letters they send out, and so on.
Under these conditions, a higher wage exerts two opposing effects: It raises the payoff when workers find a job, which motivates them to look harder. At the same time, it weakens firms’ incentives to create jobs, making workers less likely to succeed and so dampening their search efforts. The net effect depends on where the wage stood before the increase. To see this, consider two extreme cases where wages initially are either high or low, depending on the extent of workers’ bargaining power.
First, suppose that workers have no bargaining power, firms post wages unilaterally, and workers search until they find an acceptable wage offer. Since employers appropriate the entire surplus from their relationship with labor, unemployed people have little incentive to search actively for a job; the result is high unemployment. Next, consider the other extreme, where workers have all the bargaining power to set wages. Firms make no profit from hiring more workers. Because opening and advertising vacancies is costly, firms do not do so, and unemployment is high.
This means that in markets which tend to be dominated by employers or equivalently, in markets where workers’ bargaining power is not too high, a compulsory increase of the wage can lead to higher search intensity and higher employment. If the market wage is low, a binding minimum wage can make employment more attractive to workers, which strengthens their search efforts and so reduces unemployment. If the market wage is high, a binding minimum wage might discourage workers from looking for a job because there are fewer vacancies.
The search model’s results are consistent with the monopsony model: A minimum wage can, in theory, reduce unemployment.
One can also show that workers’ search effort and social welfare move together. The wage that maximizes one also maximizes the other. Because of that fact, if the market wage is small enough, a minimum wage improves labor market conditions and increases social welfare. Another interesting result of this model is that the minimum level of unemployment occurs when the market wage is below the one that maximizes workers’ search effort. This means that a minimum wage can make workers better off even if it increases unemployment.
Labor Force Participation
If we focus instead on workers’ decision to participate in the labor force (the analog of labor supply in the frictionless models), we can use logic similar to that followed above: If the market wage is very low because workers have little bargaining power, they might decide not to search for a job at all. They have no incentive to enter the market because nonmarket activities (such as gardening) are more valuable than working; hence, employment is low. Conversely, if the market wage is very high, firms are not hiring, unemployment spells are long, and workers stay out of the labor force. In general, employment is a hump-shaped function of the wage.
But unlike the model with workers’ search effort, unemployment always decreases with the wage. Although participation is weaker when wages are low, firms still create jobs because their profits are high. This swells the number of vacancies relative to the number of job seekers, making it more likely that they will find work.
If the market wage is too low and workers lack bargaining power, the introduction of a binding minimum wage strengthens labor force participation, even though the duration of unemployment increases. In contrast, if the market wage is high, a minimum wage reduces the supply of vacancies and increases unemployment duration, which discourages workers from entering in the labor force.
Ultimately, then, we need to know the prevailing market wage and the extent of market frictions before we can determine whether raising the minimum wage will improve or harm social welfare. Christopher Flinn tried to do just that when he estimated workers’ bargaining power in a 2006 study. He finds that the market wage exceeds the wage that maximizes workers’ participation in the labor market, which seems to rule out positive welfare effects of a minimum wage: “Our estimates of the bargaining power parameter...yield an optimal minimum wage rate less than the then current value of $4.25.”
The Weight of Evidence
The analysis presented here omits several important elements of actual labor markets. Many empirical studies have sought to quantify the employment effects of a minimum wage. According to David Neumark and William Washer, who surveyed this literature thoroughly, most evidence suggests that a minimum wage leads to greater unemployment. And contrary to popular belief, most evidence suggests that the least-skilled workers are those most likely to be harmed the most.
Recommended Readings
- Bureau of Labor Statistics. 2007. Characteristics of Minimum Wage Workers: 2006.
- Pierre Cahuc, and Andre Zylberberg, 2004. Labor Economics, Cambridge, Mass.: MIT Press.
- David Card, and Alan Krueger. 1994. “Minimum Wages and Employment: A Case Study of the Fast-Food Industry in New Jersey and Pennsylvania.” American Economic Review, 84, 772–93.
- Christopher Flinn. 2006. “Minimum Wage Effects on Labor Market Outcomes under Search, Matching, and Endogenous Contact Rates,” Econometrica, 74, 1013–62.
- David Neumark, and William Washer. 2006. “Minimum Wages and Employment: A Review of Evidence from the New Minimum Wage Research,” NBER Working Paper no. 12663.
- Christopher Pissarides. 2000. Equilibrium Unemployment, Cambridge, Mass.: MIT Press.
- Guillaume Rocheteau. 2006. “Understanding Unemployment,” Federal Reserve Bank of Cleveland, Economic Commentary (October 15).
Suggested Citation
Rocheteau, Guillaume, and Murat Tasci. 2007. “The Minimum Wage and the Labor Market.” Federal Reserve Bank of Cleveland, Economic Commentary 5/1/2007. https://doi.org/10.26509/frbc-ec-20070501
This work by Federal Reserve Bank of Cleveland is licensed under Creative Commons Attribution-NonCommercial 4.0 International


