

- Share
Preliminary SORCE Insights: How Are Firms Managing Rising Costs?
The Cleveland Fed’s Survey of Regional Conditions and Expectations (SORCE) administered in September 2025 included a set of special questions about how Fourth District firms are handling increasing costs. This District Data Brief discusses the top-line results from these questions.

The views authors express in District Data Briefs are theirs and not necessarily those of the Federal Reserve Bank of Cleveland or the Board of Governors of the Federal Reserve System. The series editor is Harrison Markel.
Introduction
The Cleveland Fed’s latest edition of the Survey of Regional Conditions and Expectations (SORCE), administered during September 18–25, included a set of special questions alongside the standard question set that informs the SORCE indexes. These special questions focused on changes in Fourth District firms’ nonlabor costs, selling prices, revenue, and wages and salaries.
Respondents said their firms’ nonlabor costs had risen by an average of 6.8 percent over the past 12 months. Roughly two-thirds indicated that they had raised prices to offset some portion of these higher costs, and more than half noted adopting new technologies or increasing automation to reduce overall nonlabor operating expenses. Respondents reported that their firms’ selling prices had risen by an average of 3.3 percent over the past 12 months, and they expected greater price growth in the 12 months ahead. Below is a summary of the top-line results from each of the special questions.1
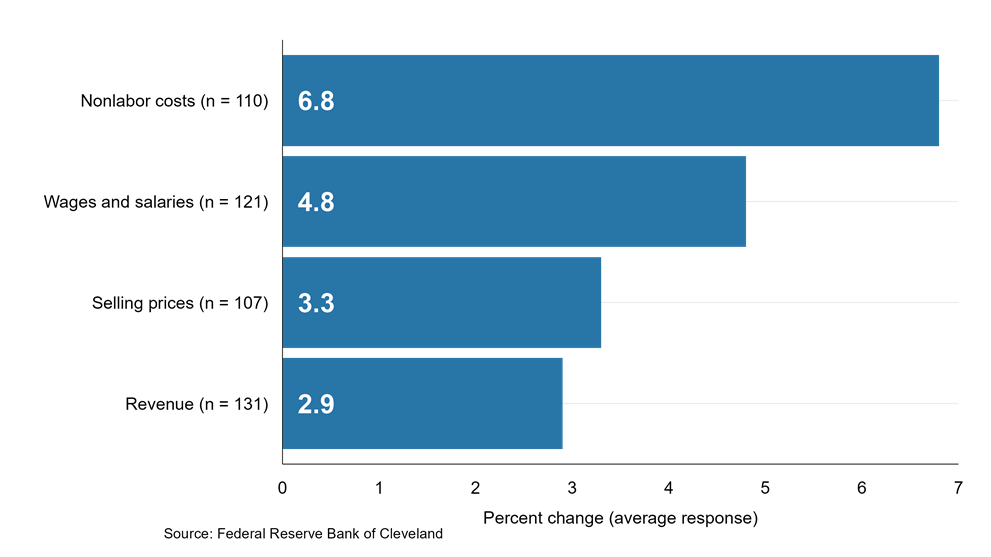
Respondents indicated that their firms’ nonlabor costs had increased by an average of 6.8 percent over the past 12 months. On average, wages and salaries had risen by 4.8 percent, selling prices by 3.3 percent, and revenue by 2.9 percent over the same period. The averages for nonlabor costs and selling prices exclude financial services contacts.
In percentage terms, by how much has the following changed over the past 12 months?
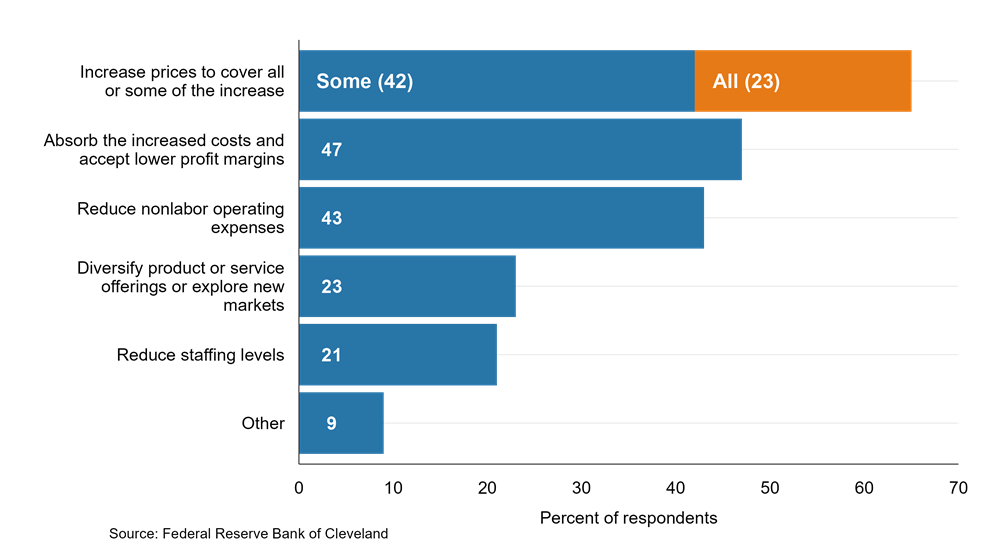
Respondents who indicated that their firms’ nonlabor costs had increased over the past 12 months were asked which of the strategies listed below, if any, their firms were adopting in response to these rising costs. Sixty-five percent (the sum of the blue and orange segments in the top bar) indicated that their firms were increasing prices to cover some or all of the increase. This result excludes financial services contacts.
Which of the following strategies, if any, have you implemented in response to these rising [nonlabor] costs? (Select all that apply) (n = 100)
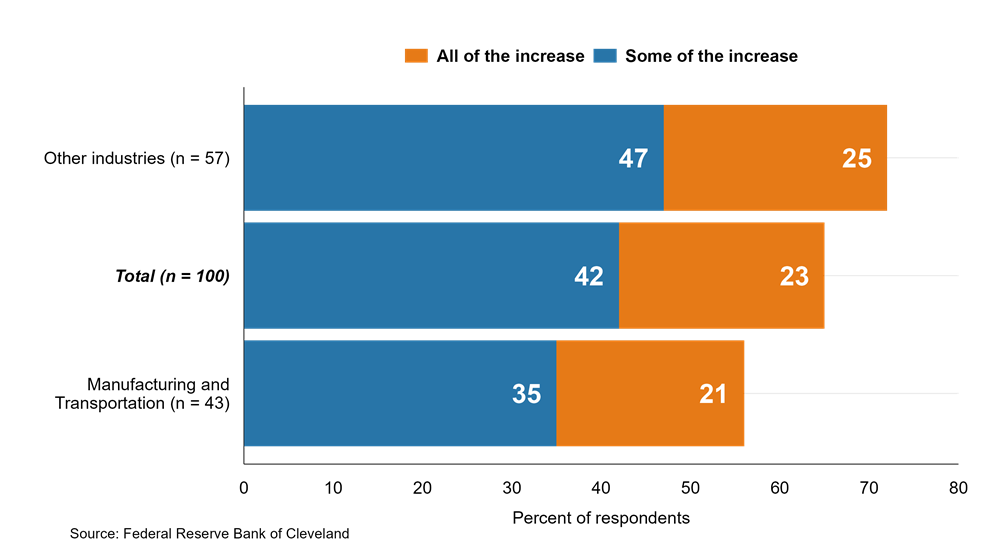
Compared to firms in manufacturing and transportation, firms in other industries more frequently reported raising prices to cover some (47 percent) or all (25 percent) of their recent increases in nonlabor costs. These other industries comprise retail, construction and real estate, professional and business services, and a small number of firms not grouped in one of these major sectors. This result excludes financial services contacts.
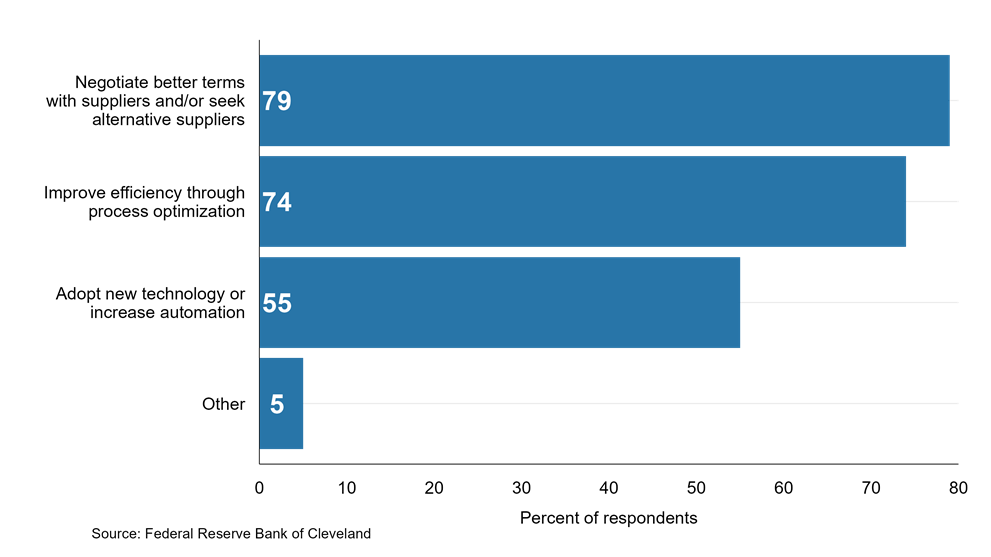
Respondents who indicated that their firms were attempting to reduce nonlabor operating expenses were asked if they were taking any of the approaches listed below to achieve those reductions. More than half of respondents noted adopting new technologies or increasing automation. This result excludes financial services contacts.
Which of the following strategies, if any, have you implemented to reduce nonlabor operating expenses? (Select all that apply) (n = 42)
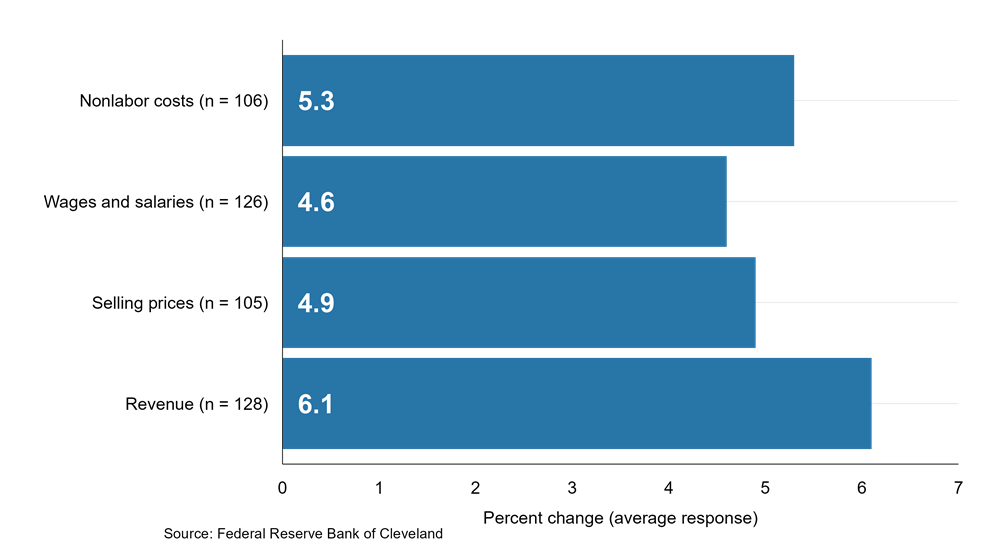
Respondents expected their firms’ revenue to increase by an average of 6.1 percent over the next 12 months. Over the same period, on average, firms expected their nonlabor costs to rise by 5.3 percent, selling prices by 4.9 percent, and wages and salaries by 4.6 percent. The averages for nonlabor costs and selling prices exclude financial services contacts.
In percentage terms, by how much do you expect the following to change over the next 12 months?
The Cleveland Fed’s Research Department gathers and analyzes timely economic information from businesses and community contacts to inform our Beige Book contribution and to prepare for Federal Open Market Committee (FOMC) meetings. One way we obtain this information is through the Survey of Regional Conditions and Expectations (SORCE), a business conditions survey sent to firms across the Fourth District, which comprises Ohio, western Pennsylvania, eastern Kentucky, and the northern panhandle of West Virginia. The SORCE is administered eight times per year. In addition to the set of standard questions asked during each round of the survey, the Cleveland Fed routinely asks a set of “special questions” to explore timely issues that may be impacting businesses across the Fourth District. The SORCE Insights District Data Briefs share the results from the “special questions.” For more information on SORCE, visit https://clevelandfed.org/SORCE.
Footnotes
To minimize the influence of extreme responses, the data used to calculate the averages in the first and last figures are winsorized at 95 percent. This means that values greater than the 97.5th percentile or less than the 2.5th percentile have been set equal to those respective limits, leaving the middle 95 percent of the data unadjusted.
Return to 1
Suggested Citation
Moseley, Carol, and Brett Huettner. 2025. “Preliminary SORCE Insights: How Are Firms Managing Rising Costs?” Federal Reserve Bank of Cleveland, Cleveland Fed District Data Brief. https://doi.org/10.26509/frbc-ddb-20251014
This work by Federal Reserve Bank of Cleveland is licensed under Creative Commons Attribution-NonCommercial 4.0 International


Regional Data, Analysis, and Engagement
Explore economic trends and the circumstances impacting the economy and diverse communities of the Federal Reserve’s Fourth District, which includes all of Ohio, western Pennsylvania, eastern Kentucky, and the northern panhandle of West Virginia.

About Us
The Federal Reserve Bank of Cleveland (commonly known as the Cleveland Fed) is part of the Federal Reserve System, the central bank of the United States.