

- Share
Using Worker Flows to Assess the Stability of the Early Childcare and Education Workforce, 2010-2022
Turnover is a particular problem among childcare workers and less so among preschool and kindergarten teachers. In 2022, turnover in childcare work was about 65 percent higher than in a typical job, while attrition among preschool and kindergarten teachers was on par with the typical occupation.

The views expressed in this report are those of the author(s) and are not necessarily those of the Federal Reserve Bank of Cleveland or the Board of Governors of the Federal Reserve System.
Introduction
While discussion of early childcare and education services (ECE) frequently focuses on availability and the costs for parents, conditions within the ECE workforce deserve greater attention.1 In a labor-intensive sector such as ECE, a stable workforce is critically important to basic day-to-day operations and the overall quality of services (Grunewald and Stepick, 2022). A stable ECE workforce helps promote full employment (Bick et al., 2023; Crockett and Zhang, 2022; Horowitz, 2023), especially for working mothers (Hofferth and Collins, 2000) and people of color (Novoa, 2020), while building the foundation for the workforce of the future (Rolnick and Grunewald, 2003). This report provides information that can be used to assess the stability of the ECE workforce. It highlights staffing trends for childcare workers, who, along with preschool and kindergarten teachers, make up the ECE workforce.
Staff turnover is one of the main obstacles to a stable ECE workforce. The 2019 National Survey of Early Care and Education found that roughly one-third of centers had turnover rates of 20 percent or greater, while 44 percent of centers experienced no turnover at all (Amadon et al., 2023). This disparity makes understanding the scope of the problem difficult, since turnover can be described as elevated in a large number of facilities and nonexistent in many others. Although the level of turnover may be hard to gauge, the reasons for it are often linked to low wages. The 2019 survey showed, for example, that turnover tended to be higher in ECE centers with lower pay (Grunewald et al., 2022). And from the workers’ perspective, a review of studies based on either administrative or small-sample surveys found that turnover was more common among lower-wage workers with less experience and lower job satisfaction and among those working in private centers without accreditation standards (Totenhagen et al., 2016). High turnover has also been linked to the combination of childcare and educational services offered at centers. Those offering more educational services tended to have less turnover because they often have dedicated funding sources (Bassok et al., 2021; Phillips et al., 2019; Doromal et al., 2022; Federal Reserve’s Early Care and Education Work Group, 2023).
Properly assessing the stability of the ECE workforce requires asking additional turnover and staffing questions into which we currently have little insight:
- How does the level of turnover vary by ECE's component occupations?
- How does the level of turnover compare with that of other occupations?
- Where are workers who leave an ECE occupation going?
- At what rate and from where are new ECE workers entering the field?
For answers, this report uses the Current Population Survey to estimate the rates at which workers moved into and out of ECE occupations from 2010 to 2022.2
Key Findings
- Turnover is particularly a problem in childcare services and less so in teaching. From 2010 to 2022, childcare workers left their occupation at higher rates (14.9 percent), on average, compared to preschool and kindergarten teachers (8.5 percent) and those working in the typical (median) occupation (9.1 percent). In 2022, turnover for childcare workers was about 65 percent higher than turnover in the typical occupation.
- Once they left their jobs, ECE workers, especially childcare workers, were less likely to remain in the labor force than workers in the typical occupation. Over the period analyzed, roughly 50 percent of childcare workers, on average, left the labor force upon leaving their jobs, compared to 29.3 percent of preschool and kindergarten teachers and 24.1 percent of people in a typical occupation.
- Childcare has a relatively high rate of worker entry into the occupation. From 2010 to 2022, individuals entered childcare work at a rate of 9.3 percent of employment, on average, whereas the rate of entrants into preschool and kindergarten teaching (4.7 percent) was below the median occupation rate (5.8 percent).
- The composition of workers entering the ECE workforce shows that sizable shares come from outside the labor force rather than from other jobs. Almost 50 percent of workers entering childcare work and 25 percent of workers becoming preschool or kindergarten teachers came from outside the labor force, compared to 20 percent for the median occupation.
Collectively, these findings show that stability and turnover in the ECE workforce are more of a problem in the provision of childcare than in early childhood education. Childcare workers have some of the highest turnover rates, while the rate for preschool and kindergarten teachers tends to be on par with that of the median occupation. These findings also indicate a significant amount of churn among childcare workers in and out of the labor force. Further study is needed to understand how factors such as job quality may play a role in this dynamic. When solutions to support childcare workers are discussed, an obvious place to look is educational services occupations within childcare, where conditions appear to be more stable.
Descriptions of ECE Occupations
• Childcare workers attend to children at schools, businesses, private households, and childcare institutions and perform a variety of tasks, such as dressing, feeding, bathing, and overseeing play.
• Preschool teachers instruct preschool-aged students, following curricula or lesson plans, in activities designed to promote social, physical, and intellectual growth.
• Kindergarten teachers teach academic and social skills to kindergarten students.Source: US Bureau of Labor Statistics
The ECE Workforce
Before we dive into the worker flow data, some background information on the ECE workforce helps to further distinguish between care workers and teachers. Table 1 presents the demographic characteristics of workers in both ECE occupations and an average for all occupations. The ECE workforce stands out from the broader workforce in that it tends to be younger, primarily female, and more diverse in terms of race and ethnicity. The childcare worker component of the ECE labor force is more likely to be younger, a person of color, and unmarried, and to have much lower levels of educational attainment than preschool and kindergarten teachers. The differences in educational attainment between the two occupations reflect the typical level of education that most workers need to enter those occupations. Entry-level childcare work tends to require only a high school diploma, while entry-level preschool and kindergarten teachers more often have associate’s degrees and bachelor’s degrees, respectively, according to the US Bureau of Labor Statistics.
Table 1: Worker Characteristics by Occupation, 2010-2022
| Childcare Workers | Preschool and Kindergarten Teachers | All Occupations | |
| Average Age | 37.6 | 38.8 | 41.0 |
| Female | 94.8% | 97.7% | 47.0% |
| White | 77.5% | 79.3% | 79.0% |
| Black | 15.4% | 13.9% | 11.7% |
| Hispanic | 22.6% | 13.5% | 17.0% |
| Married | 45.1% | 59.3% | 55.7% |
| Head of Household | 42.3% | 44.9% | 51.2% |
| Children less than 5 years old | 12.8% | 17.7% | 13.2% |
| No High School Diploma | 10.0% | 1.2% | 7.4% |
| High School Diploma | 33.8% | 14.3% | 26.5% |
| Some College | 27.4% | 17.2% | 18.0% |
| 2-Year Degree | 3.8% | 4.2% | 4.7% |
| 4-Year Degree or Higher | 17.5% | 53.2% | 35.4% |
| Number of Observations | 46,315 | 27,478 | 5,839,364 |
Sources: Author’s calculations, IPUMS-CPS (2010–2021), IPUMS-ACS (2019), IPUMS USA, University of Minnesota, www.ipums.org.
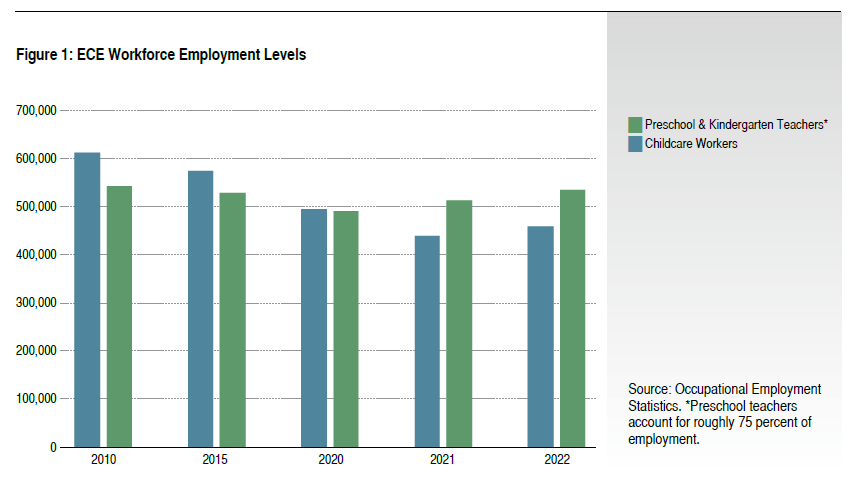
There are also differences in employment and wages between childcare and teaching. The number of preschool and kindergarten teachers has been relatively steady since 2010, at about 500,000, while the number of childcare workers has slowly declined from more than 600,000 in 2010 to 439,000 in 2021, before increasing to 459,000 in 2022 (Figure 1). Currently, the number of childcare workers remains below prepandemic levels, while the number of preschool and kindergarten teachers (534,610) has exceeded 2020 (peak pandemic) levels. In terms of compensation, annual median wages for the overall ECE workforce tend to be in the lower half of the wage distribution. In 2022, out of the 825 occupations that have publicly available wage information, childcare workers had the 10th lowest annual median wage ($28,520), just ahead of fast food and counter workers ($27,930) and cashiers ($28,240); preschool and kindergarten teachers rank 213th lowest at $40,942. The pay for a childcare worker does not provide a living wage for a single adult plus one child in any state (Whitebook et al., 2020).
Flows Out of the ECE Workforce3
Worker outflows, or the share of workers in an occupation who are no longer in that occupation in the following month, are a significant problem for childcare workers. Figure 2 presents estimates of worker outflows for the ECE workforce compared with 10th percentile, median, and 90th percentile occupations for comparison purposes. On average, 14.9 percent of childcare workers and 8.5 percent of preschool and kindergarten teachers left the occupation every month from 2010 to 2022, putting the former closer to the 90th percentile, while the latter is on par with the median occupation. Other high-turnover occupations tend to be lower-wage service jobs such as cashiers, retail salespersons, food prep and service workers, couriers and messengers, and personal care aides, or physically demanding positions such as construction laborers, package handlers, laborers and freight handlers, stock and material movers, and ground maintenance workers. Comparing 2022 with 2010, the outflow rate for the median occupation increased 1.0 percentage point, while the rate for childcare workers and preschool and kindergarten teachers increased faster, at 1.6 and 2.8 percentage points, respectively. The spike in turnover in 2020 is attributable to workers transitioning to unemployment during the pandemic (see also Figure 5). More recently, worker outflows have declined from pandemic highs but remain elevated. In 2022, 15.7 percent of childcare workers and 9.0 percent of preschool and kindergarten teachers left those occupations.
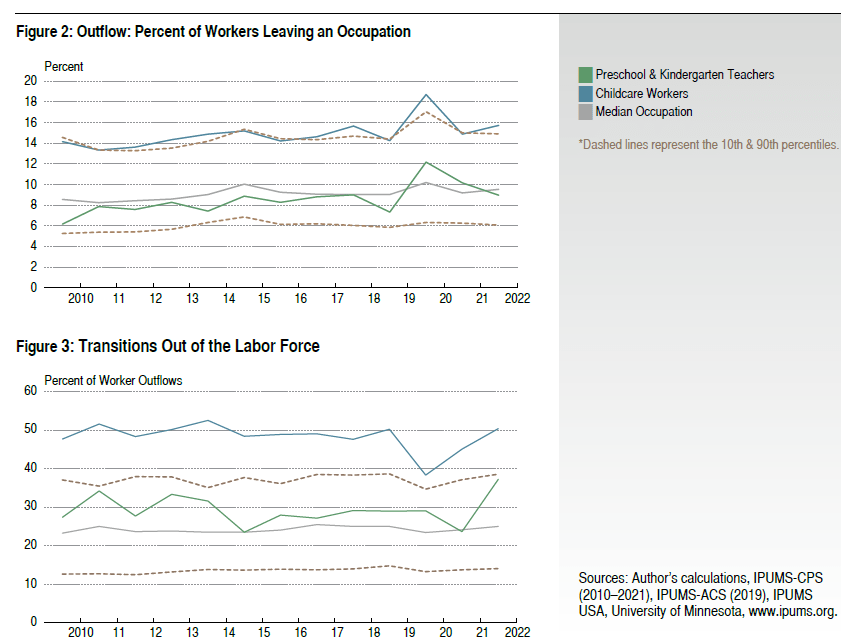
For childcare workers, the largest share of departures was composed of people leaving the labor force altogether, as opposed to moving to another occupation or to unemployment (Figure 3). Childcare workers stand out on this measure, with almost 50 percent of their departures, on average, attributable to leaving the labor force, compared to 29.3 percent of preschool and kindergarten teachers and 24.1 percent of the median occupation. This indicates that ECE workers, especially childcare workers, were more likely to leave and stop looking for work altogether than workers in the typical occupation. This became more common in 2022: 50.4 percent of outgoing childcare workers and 37.2 percent of outgoing preschool and kindergarten teachers left the labor force, compared to 25 percent for the median occupation. As for what was keeping individuals out of the labor market, the top stated reasons given by ECE workers were “taking care of house or family” and “in school.”4 Over 50 percent of exiting ECE workers were “taking care of house or family” compared to 39 percent of all workers. The share of former childcare workers “in school” (35.9 percent) was on par with that of all exiting workers (34.2 percent), while fewer preschool and kindergarten teachers left the occupation for school reasons (23.4 percent).
For preschool and kindergarten teachers, the biggest group of departures was people moving into other occupations. However, both teachers and childcare workers moved into other occupations less frequently and were less likely to remain employed than people in the typical occupation. Figure 4 shows that for the median occupation, roughly two-thirds of workers leaving an occupation ended up employed in a different occupation the following month, on average, compared with about half of preschool and kindergarten teachers and only one-third of childcare workers.
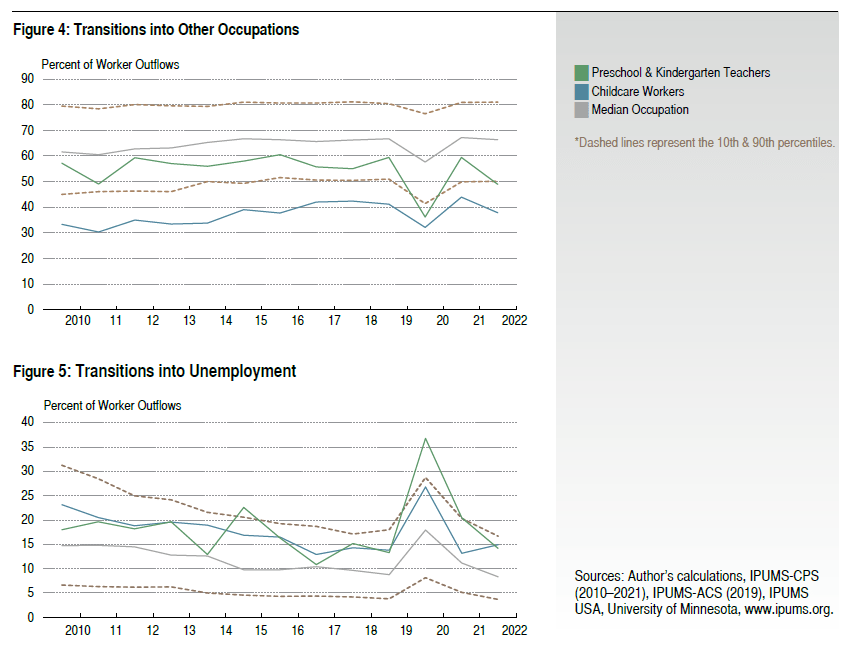
Unemployment for both childcare workers and teachers tended to be a larger component of worker outflows than it was for the typical occupation (Figure 5). During the pandemic in 2020, unemployment spiked as businesses closed and workers received support from pandemic jobless benefits. In 2022, unemployment for the median occupation returned to prepandemic levels, but shares for both ECE occupations remained higher, at 11.7 percent (childcare workers) and 13.8 percent (preschool and kindergarten teachers).
Flows into the ECE Workforce
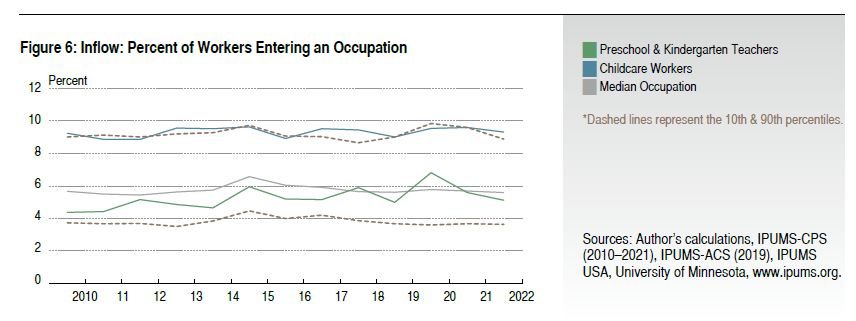
The flow of workers into the ECE workforce was relatively consistent but at higher levels for childcare workers than for teachers. Figure 6 presents the inflow rate of workers as a share of employment in those occupations. Childcare workers had a relatively high rate of workers entering the occupation each month at 9.3 percent of employment, on average, compared to 5.8 percent for the median occupation and 5.2 percent for preschool and kindergarten teachers.
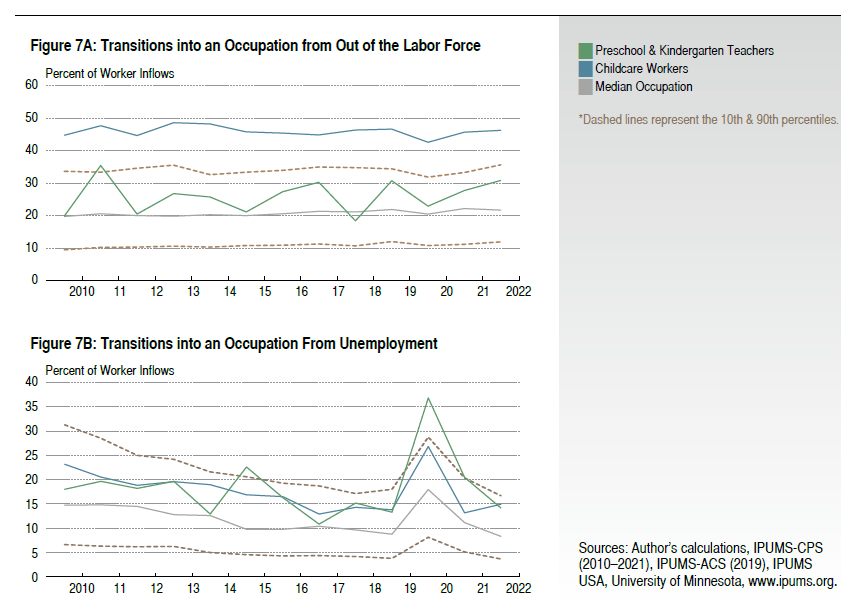
Workers entering the ECE workforce were largely individuals coming from outside the labor force and from the ranks of the unemployed. Almost half of the individuals entering childcare work and a quarter of those entering preschool and kindergarten teaching were previously out of the labor force, compared to just 20 percent of the median occupation (Figure 7A). Roughly 50 percent of those entering the ECE workforce from out of the labor force reported “taking care of house or family,” compared to 35 percent of all those entering the workforce from out of the labor force.5 The unemployed also accounted for more than a typical share of people moving into the ECE workforce (Figure 7B). Together, these trends underscore the difficulty, and perhaps the unsustainability, of recruiting people into childcare work because doing so relies on pulling workers off the sidelines and into employment.
Conclusion
A stable ECE workforce is an important support for full and sustained participation in the economy. Previous research shows that staff turnover is an obstacle to that stability. This analysis of worker movements in and out of the ECE workforce finds that turnover among childcare workers, in particular, is a much larger issue than turnover in educational services. In 2022, turnover in childcare work was about 65 percent higher than that in a typical job, while turnover among preschool and kindergarten teachers was on par with that of the typical occupation. These findings dovetail with and help quantify other research findings describing turnover challenges among childcare workers.
However, even a basic step such as raising wages is not as straightforward as simply increasing prices and passing the costs on to parents. Household childcare costs as a share of income are already higher than the recommended federal guidelines, with the true cost of licensed infant childcare estimated to be 40 percent more than the current price charged to parents and what providers receive from a public subsidy reimbursement (Workman, 2021). Given these realities, it should be no surprise that ECE providers have relied on temporary funds from the American Rescue Plan (ARP) Child Care Stabilization Program to keep staffing levels up (ARP Childcare Stabilization Funding State and Territory Factsheet), but that program has recently expired. In pursuit of stability, some advocates have called for a secure, dedicated funding source for the ECE workforce.
Endnotes
- ECE services refers to a wide range of programming for children prior to reaching school age (5 years old). For a closer look at how childcare workers were affected during the COVID-19 pandemic, see Boesch et al., 2021. Return to 1
- An IPUMS-CPS defined variable that uniquely identifies individuals across CPS samples allows this analysis to be conducted monthly (Flood et al, 2021). Monthly CPS samples, as opposed to the March Supplement, are used to observe occupation transitions because it allows for a large sample size and for this analysis to include 2022. The Bureau of Labor Statistics separates preschool and kindergarten teachers into separate occupations, but the worker flow data from the Current Population Survey is based on Census Bureau occupation definitions which groups preschool and kindergarten teachers into a single occupation, which is how the two occupations are treated in this analysis. Estimates are produced for over 500 occupations to provide the context of trends in the larger workforce. Annual estimates are presented. Return to 2
- While related to a traditional concept of turnover, outflow estimates likely understate the level of turnover within an occupation because the CPS does not reliably identify when a worker changes employers in the monthly microdata. As presented, a worker who changes employers but not specific occupations would not be included in an outflow measure because their occupation does not change from month to month. Return to 3
- Non-trivial shares of respondents who are not retired failed to report a major activity for not being in the labor force. Limited major activity options include: disabled; ill; in school; taking care of house or family; and something else. Return to 4
- Non-trival shares of respondents who are not retired failed to report a major activity for not being in the labor force. Limited major activity options include: disabled; ill; in school; taking care of house or family; and something else. The share of incoming childcare workers ‘in school’ (33.0 percent) is on par with all incoming workers (32.2 percent), while fewer incoming preschool and kindergarten teachers were previously in school (18.4 percent). Return to 5
References
- Amadon, S., Lin, Y-C., Padilla, C., M. (2023). Turnover in the Center-based Child Care and Early Education Workforce: Findings from the 2019 National Survey of Early Care and Education. OPRE Report #2023-061. Washington, DC: Office of Planning, Research, and Evaluation, Administration for Children and Families, U.S. Department of Health and Human Services.
- Bassok, D., Markowitz, A. J., Bellows, L., & Sadowski, K. (2021). New evidence on teacher turnover in early childhood. Educational Evaluation and Policy Analysis, 43(1), 172–180. https://doi.org/10.3102/0162373720985340
- Bick, Alexander; Gregory, Victoria and Leukhina, Oksana. 2023. “Are Higher Child Care Wages Affecting the Labor Supply?” Federal Reserve Bank of St. Louis, On the Economy Blog. https://www.stlouisfed.org/on-the-economy/2023/jul/are-higher-child-care-wages-affecting-labor-supply
- Boesch, Tyler, Lim, Katherine, and Nunn, Ryan. 2021. “COVID-19’s Disruptions Disproportionately Hit Child Care Workers.” Federal Reserve Bank of Minneapolis. https://www.minneapolisfed.org/article/2021/covid-19s-disruptionsdisproportionately-hit-child-care-worker
- Crockett, A. and Zhang, X., 2022. Economy's Essential Early Care and Education Industry but Still Faces Labor Shortfall. Fed in Print. https://www.dallasfed.org/cd/communities/2022/0516
- Doromal, J.B., Bassok, D., Bellows, L. and Markowitz, A.J., 2022. Hard-to-staff centers: Exploring center-level variation in the persistence of child care teacher turnover. Early Childhood Research Quarterly, 61, pp.170-178.
- Federal Reserve’s Early Care and Education Work Group. 2023. “A Late Start: Understanding Public Investments in Education to Inform Supply-Side Investments for Early Learning.” Federal Reserve Bank of San Francisco Community Development Research Brief 2023-03. doi: 10.24148/cdrb2023-03.
- Flood, Sarah, Miriam King, Renae Rodgers, Steven Ruggles, J. Robert Warren, and Michael Westberry. 2021. “Integrated Public Use Microdata Series, Current Population Survey: Version 9.0 [Dataset].” Minneapolis, MN: IPUMS. https://doi.org/10.18128/D030.V9.0
- Grunewald, R., Nunn, R. and Palmer, V., 2022. Examining teacher turnover in early care and education. Available at Federal Reserve Bank of Minneapolis: https://www.minneapolisfed. org/article/2022/examining-teacher-turnover-in-early-care-and-education.
- Grunewald, R and Stepick, L, 2022. What drives the cost of high-quality early care and education?. Available at Federal Reserve Bank of Minneapolis: https://www.minneapolisfed.org/article/2022/what-drives-the-cost-of-high-quality-early-care-and-education.
- Hofferth, S., & Collins, N. (2000). Child care and employment turnover. Population Research and Policy Review, 19, 357-395. https://deepblue.lib.umich.edu/bitstream/handle/2027.42/43521/11113_2004_Article_277206.pdf?sequence=1
- Horowitz, Benjamin. 2023. “Why Equitable Access to Child Care Matters to the Economy.” Fed Communities. https://fedcommunities.org/why-equitable-access-quality-child-care-matters-economy/
- Novoa, Christina. (2020). “How Childcare Disruptions Hurt Parents of Color Most.” Center for American Progress. https://www.americanprogress.org/article/child-care-disruptions-hurt-parents-color/
- Phillips, D. A., Anderson, S., Datta, A. R., & Kisker, E. (2019). The changing portrait of center-based preschool teachers: 1990 and 2012. Children and Youth Services Review, 107(October), Article 104558. https://doi.org/10.1016/j.childyouth.2019.104558.
- Rolnick, A. and Grunewald, R., 2003. Early childhood development: Economic development with a high public return. The Region, 17(4), pp.6-12.
- Totenhagen, C.J., Hawkins, S.A., Casper, D.M., Bosch, L.A., Hawkey, K.R. and Borden, L.M., 2016. Retaining early childhood education workers: A review of the empirical literature. Journal of research in childhood education, 30(4), pp.585-599.
- Whitebook, M., McLean, C., Austin, L.J. and Edwards, B., 2020. Early Childhood Workforce Index 2020. The Early Educator Workforce. Center for the study of Child Care Employment, University of California at Berkeley. https://cscce.berkeley.edu/workforce-index-2020/the-early-educator-workforce/early-educator-pay-economic-insecurity-across-the-states/
- Workman, S., 2021. The True Cost of High-Quality Child Care Across the United States.” Center for American Progress Action Fund: Washington, DC, USA. https://www.americanprogress.org/article/true-cost-high-quality-child-care-across-united-states/
Suggested Citation
Fee, Kyle D. 2024. “Using Worker Flows to Assess the Stability of the Early Childcare and Education Workforce, 2010-2022.” Federal Reserve Bank of Cleveland, Community Development Reports. https://doi.org/10.26509/frbc-cd-20240119
This work by Federal Reserve Bank of Cleveland is licensed under Creative Commons Attribution-NonCommercial 4.0 International

