

- Share
Resilience and Recovery: Insights from the July 2022 Eastern Kentucky Flood
Because of its topography, location, and coal mining legacy, eastern Kentucky has a long history of flooding. This report focuses on housing in the 13 counties declared federal disaster areas after the July 2022 flood.

The views expressed in this report are those of the author(s) and are not necessarily those of the Federal Reserve Bank of Cleveland or the Board of Governors of the Federal Reserve System.

Rescue teams use kayaks to search for residents trapped by the flood in Whitesburg, Kentucky.
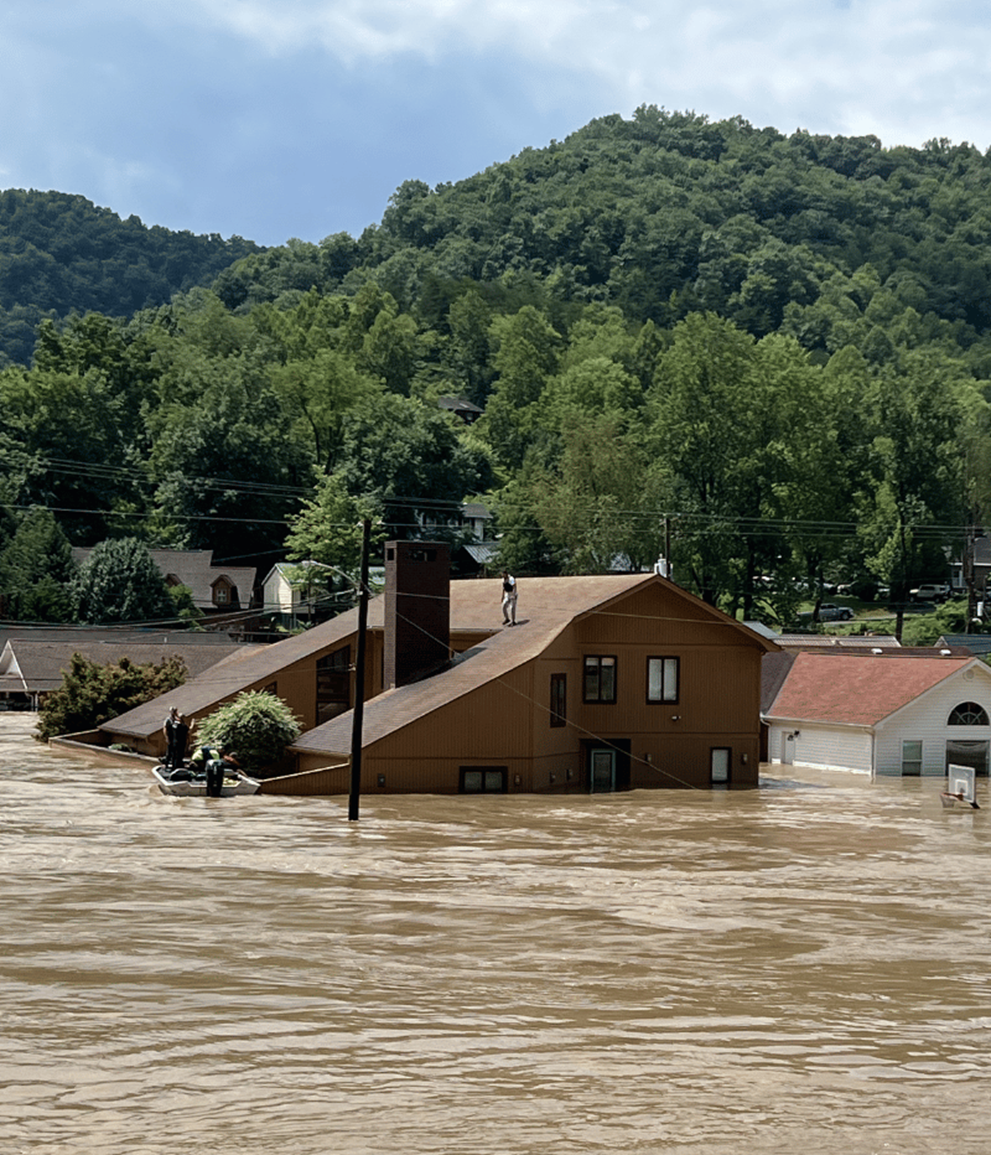
A rescue boat is needed to retrieve a man stranded on the roof of his home.
“I don't think any of us were prepared for the ferocity of this storm,” said Dee Davis, president of the Center for Rural Strategies. “People woke up with water lapping at their beds.” According to Scott McReynolds, executive director of the Housing Development Alliance, “Creeks that normally run a few inches deep were 35 feet deep and raging, which was enough force to carry an 1,100-square-foot house down the river for about a quarter mile and set it on top of a bridge.”
The rain started on Monday, July 25, 2022, and flash flood reports began coming in on the morning of July 26 as rain in excess of four inches per hour fell across eastern Kentucky. Training storms, a series of slow-moving thunderstorms that follow the same path, dumped extreme amounts of rain over relatively short periods of time, inundating some areas with upwards of 14–16 inches of rain. The worst of it occurred after dark on July 28, as raging walls of water washed houses, mobile homes, and vehicles down the valleys, flooded schools and businesses, and left roads and bridges impassable. Experts deemed it a thousand-year flood: a flood with a 1 in 1,000 chance of occurring in any given year.
In the aftermath, 44 people died, and 13 counties1 were declared federal disaster areas (see Map 1). Nearly 9,000 homes were damaged or destroyed (Dixon and Shelton, 2023), and hundreds of families took cover with family and friends or were forced into temporary shelter, such as government-provided trailers. More than 1,400 people required rescuing, more than 600 by helicopter. Though floodwaters receded, homes and businesses were still left with thick layers of mud and muck that needed to be shoveled out, and any wet belongings needed to be removed. “You literally [saw] all of somebody's life spread out in their yard,” said McReynolds.

Source: OpenFEMA Dataset: Disaster Declarations Summaries - v2.
The July 2022 flood was not the region’s first, nor will it be its last. It’s in these situations that close-knit communities with deep family ties to the land demonstrate their resourcefulness. However, despite eastern Kentucky’s resilience, its recovery is made more challenging by the decline of the coal industry, which has led to the loss of many well-paying jobs and a steady exodus of people from the region. Since 1996, the population in the 13 flooded counties has declined by 16 percent; that’s nearly 2,000 people per year. It is also an impoverished region, with county poverty rates topping 20 percent, well over the national average of 12.6 percent.
This report focuses on the 13 counties declared federal disaster areas following the July 2022 flood. It examines the flood’s impact on the region’s housing by synthesizing three sources of information: the academic literature, available quantitative data, and qualitative interviews with four key stakeholders directly involved in the recovery.2
Key findings
- Cost of flood insurance can be prohibitive. The average cost of homeowners insurance and a flood insurance policy could account for around 7 percent of the median household income in the counties impacted by the 2022 eastern Kentucky flood. These policies can be expensive, particularly for low-income households, leading them to go without. Evidence of these difficult decisions can be found in the fact that only 5 percent of damaged homes had flood insurance, and households earning $30,000 or less per year accounted for 60 percent of damaged homes.
- Floods exacerbate affordable housing shortages. Nearly 9,000 housing units were affected by the flood, with 74 percent of the damage occurring in just four counties (Breathitt, Knott, Letcher, and Perry), comprising 22 percent of their occupied housing units. Research finds that low-income households and renters are more likely to suffer permanent displacement because they often have fewer relocation options and lower-quality housing is more likely to be demolished instead of being rebuilt (Wilson, Tate, and Emrich, 2021). These points are particularly relevant in these 13 flood-impacted counties where, in 2021, 37 percent of households, including 55 percent of renters, made less than $25,000 per year.
- Floods increase population out-migration, which, in turn, impacts the local labor force. In the four hardest hit counties (Breathitt, Knott, Letcher, and Perry), an analysis of United States Postal Service (USPS) Vacancy Data shows that residential vacancies increased by 19 percent from the third to the fourth quarter in 2022. This is in addition to an average population decline of 600 people per year going back to 1984. Fewer residents mean fewer people available to fill jobs.
- The pre-existing weakness of local labor markets will likely impact housing recovery, particularly due to a lack of available workforce in skilled trades. Prior to the July 2022 flood, the region experienced unemployment rates consistently higher than the national rate. In the region, the construction sector, key to the housing recovery, has declined by 24 percent (1,759 jobs) from its 2001 peak to 2022. Only coal mining and financial activities employment saw greater declines. This shortage of skilled trades workers, such as carpenters, electricians, and plumbers, has led to a backlog of people waiting to get their homes repaired or replaced.

Residents of Letcher County, Kentucky, use a rope line to help a family leave their flooded home.
A history of flooding in eastern Kentucky
Eastern Kentucky has a long history of flooding, which can be primarily attributed to three things:
- Topography: Development tends to occur on lower-lying flatland, which is where the steep terrain and narrow valleys funnel the water.
- Geographic location and weather changes: Eastern Kentucky is closer to the warm water in the Gulf of Mexico, which feeds moisture toward the region. As average temperatures increase, the additional moisture can lead to more water vapor in the atmosphere and rain.
- Coal mining legacy: Mountaintop removal deforested areas and compacted the soil, allowing faster water runoff down the valleys.
Flooding occurs with relative frequency in eastern Kentucky. Map 2 shows the number of federally declared disasters, by county, where flooding was mentioned in the description. From 1967 to 2022, these 13 counties averaged 27 total events, ranging from 17 in Whitley County (one every 3.2 years) to 33 in Pike County (one every 1.7 years). For comparison, the rest of the state’s counties averaged 11 federally declared flooding events over that time (one every 5 years).

Note: Total includes any incident where “flood” appears in the “declaration title” field.
Source: OpenFEMA Dataset: Disaster Declarations Summaries - v2.
Floods cause substantial amounts of property damage. From 1967 through 2021, total damages due to flooding in the 13 counties was $331.6 million, or $1,139 per capita; for the rest of the state, flood damages were $396 per capita.3
Given the frequency of events and the amount of property damage, it should be no surprise that these 13 counties have a greater risk of future flood events compared to the rest of the state. The First Street Foundation calculates a Flood Factor, an assessment of flood risk for nearly every parcel in the United States, based on the likelihood of flooding and its severity. A Flood Factor score of 1 indicates less than a 0.2 percent chance of flooding. Table 1 shows the share of parcels by Flood Factor score. In the 13 counties, 40 percent of parcels are at high risk for future floods, compared to 5 percent of the rest of the state’s parcels and 4 percent of US parcels.
Table 1. Share of Parcels by Flood Risk
| Geography | Low Risk (Flood Factor of 1) | Medium Risk (Flood Factor of 2–8) | High Risk (Flood Factor of 9–10) |
| 13 counties4 | 48 percent | 12 percent | 40 percent |
| Rest of Kentucky | 86 percent | 9 percent | 5 percent |
| United States | 82 percent | 14 percent | 4 percent |
Four takeaways from the July 2022 flood
Cost of flood insurance can be prohibitive
Homeowners and renters insurance typically do not cover flood damage; so households must purchase a separate flood insurance policy. The National Flood Insurance Program (NFIP), overseen by the Federal Emergency Management Agency (FEMA), is the largest provider of flood insurance in the United States, with more than 5 million policyholders nationwide. Its cost depends on many factors, including the size and age of the home, its proximity to water, and whether it is in a floodplain. According to the National Association of Insurance Commissioners, the average annual cost of a homeowners insurance policy in the state of Kentucky is $1,174,5 and, according to an analysis of NFIP data, the average cost for a flood insurance policy in the 13 counties in 2022 was $1,384.6 Based on these averages, both homeowners and flood insurance could account for around 7 percent of the 13 counties’ median household income of $37,263 in 2021. These policies can be expensive, particularly for low-income households, leading to difficult decisions. Evidence of these difficult decisions can be found in an analysis of FEMA data from the July 2022 flood by the Ohio River Valley Institute: only 5 percent of damaged homes had flood insurance. The analysis also found that lower-income households accounted for a higher share of disaster-damaged homes: households earning $30,000 or less per year accounted for 60 percent of damaged homes (Dixon and Shelton, 2023). During the recovery, homeowners who either rebuild or rehab their homes in the floodplain will have to decide whether to get flood insurance. If they decide not to and get flooded again, they will not be eligible for FEMA assistance a second time.
Unfortunately, mapping flood zones can be imperfect and imprecise, making the choice to get flood insurance even more difficult. According to FEMA, nearly one-third of flood damage happens outside of FEMA designated flood zones (Hersher and Kellman, 2020). When looking at First Foundation data for the four most impacted counties (Breathitt, Knott, Letcher, and Perry), 45 percent of parcels had a flood risk of 9–10 (highest risk), but only 22 percent of those parcels were in a FEMA designated flood zone, indicating a disconnect between flood potential and whether a household should have flood insurance.
Floods exacerbate affordable housing shortages
Research finds that low-income households and renters are more likely to suffer permanent displacement because they often have fewer relocation options and lower-quality housing is more likely to be demolished instead of being rebuilt (Wilson, Tate, and Emrich, 2021). These points are particularly relevant in a region where, in 2021, 37 percent of households, including 55 percent of renters, made less than $25,000. In addition, the flood affected 8,950 homes across the 13 counties, with 74 percent of the damage occurring in just four of the counties (Breathitt, Knott, Letcher, and Perry), comprising 22 percent of their occupied housing units. Across the 13 counties, flood-affected homes ranged from 31 percent in Knott County to 0.2 percent in Whitley County (see Figure 1). Having several thousand affected units is particularly detrimental to rural areas, which typically lack surplus housing units that flood victims can move to. In 2021, these 13 counties contained a majority of single-family structures (61 percent), a substantial minority of manufactured homes (31 percent), and relatively few multifamily structures (8 percent). Most housing units are owner-occupied (73 percent).

Sources: 2017–2021 American Community Survey; Dixon and Shelton, 2023.
Floods tend to increase out-migration, which, in turn, impacts the labor force
Research finds that natural disasters such as floods increase the overall number of migrants who move both locally and long-distance from the impacted area, which, in turn, impacts the local labor force (Boustan et al., 2020; Roth Tran and Wilson, 2023). One way to examine this is by using the USPS Vacancy Data. Released quarterly, this dataset provides information on the number of vacant residential addresses in a census tract. Trends in these data seem to indicate possible out-migration or, at the very least, an increase in vacant residential addresses. Focusing on the four hardest hit counties of Breathitt, Knott, Letcher, and Perry shows that residential vacancies increased by 19 percent from Q3:2022 (when the flood occurred) to Q4:2022. This is in addition to an average population decline of 600 people per year from its peak in 1984. Fewer residents mean fewer people available to fill jobs.
There is also anecdotal evidence of out-migration. According to Bridget Back, deputy director of the Eastern Kentucky Concentrated Employment Program, Inc. (EKCEP), one local school system has eliminated some positions due to a decline in school enrollment. McReynolds fears that “the longer people stay away, the less likely they are to come back.” However, out-migration’s impact remains to be seen, as recent research finds that those who moved tended to move to areas with a lower flood risk but also tended to stay within a 20-minute drive of their original homes (Elliott and Wang, 2023).
The pre-existing weakness of local labor markets is likely to impact housing recovery
Leading up to the July 2022 flood, the labor market in the 13 counties was not healthy. Total employment had dropped by 17 percent (15,812 jobs) from 2006 (its peak) to 2022, even after taking into account a 5.5 percent gain from 2020 to 2022. This sustained decline was driven in large part by a loss of 9,544 jobs (–77 percent) in the natural resource and mining sector, which was primarily coal mining, over the same period. This loss of jobs in turn leads to out-migration and unemployment rates that average higher than the national rate.
With that in mind, when the July 2022 flood occurred, unemployment filings jumped by 246 percent in August 2022 for the four most flood-impacted counties (Breathitt, Knott, Letcher, and Perry) compared to a 35 percent increase in the other nine counties. In addition, the 13 counties suffer from a shortage of skilled trades workers, such as carpenters, electricians, and plumbers, which has led to a backlog of people waiting to get their homes repaired or replaced. The sheer magnitude of the event has overwhelmed local companies, and the shortage of available housing and rental accommodations has hindered many outside companies from being able to stay long term. To better understand this shortage, it is helpful to examine location quotients, which are a common way to measure industry specialization by comparing the share of an industry in one region against the share of the same industry in a larger geographic area, usually the United States. A number greater than 1.0 indicates industry specialization. Going back to 1990, the highest location quotient for the construction sector was 0.75 (or 4.7 percent of total private employment) in 2001. Since then, the location quotient has declined to 0.45 (or 2.7 percent of total private employment) in 2022; that translates to 1,759 fewer jobs. Not only is the 13 counties’ share lower than the national average of 6 percent in 2022, but it is lower than the average rural county’s share, which has closely tracked the national average going back to 2009. One remedy, instituted by EKCEP in early 2023, was to fund wages up to 12 months for individuals participating in cleanup, humanitarian, and reconstruction efforts. As of July 2023, more than 200 people have benefited from the effort.
Recovery and preparedness
Rebuilding and repairing homes take time and resources
Rebuilding takes time, and, according to McReynolds regarding how long the recovery will take, “The recovery experts that came in were saying five years minimum.” McReynolds’ organization, the Housing Development Alliance, is well on its way to its goal of building 20 homes in 2023, but according to Back, rebuilding is made more difficult because the mountainous terrain limits the number of buildable pieces of land and adds to the cost. Following the flood, families were housed in the few available hotels, FEMA travel trailers, nearby state parks, or with family or friends. Some have cleaned up small sections of their homes and have chosen to live there until the rest of the home is repaired, which, according to Davis, is “dangerous as a cocked cannon,” given the potential health dangers of living in a home with mold and mildew. Others, according to McReynolds, “are buying sheds and using them as tiny homes.”
Depending on variables such as the damage done and the type of structure, households without flood insurance could be awarded up to $37,900 from FEMA to rebuild. Given inflation’s impact on prices and the shortages in building supplies and labor, FEMA’s funds may fall short of what is needed to repair homes. “That’s not enough to do anything if you have to rebuild your house,” observed McReynolds. Additionally, he points out the disconnect between the value of the damage and the cost of the repair: “Somebody may have been a homeowner, but the home they owned was a 1982 single-wide trailer. Well, what’s the value of a 1982 single-wide trailer? Not a lot. So, from a value standpoint, they may have only lost $5,000 or $10,000, but how are you going to house them? A replacement home is going to cost $150,000.” According to Davis, “A lot of people are trying to figure out where to rebuild, how to rebuild, but I also see people rebuilding in the same place because that's all the capacity they have. They do it in hopes that it's another 50 years before the next flood.”
For those who rent, the situation can be even more dire. According to Back, “Many renters lost their unit because it was damaged and the owner either decided that they were not going to repair the rental property, or it just took a backseat to other priorities they had, such as their own home.”
Researchers find that rural areas have both challenges and advantages related to flood recovery, but in the end, it is rarely a return to a pre-disaster state.
Recovery is a complex process and rural areas are more likely to face challenges such as a lack of zoning and building code enforcement alongside a limited or declining tax base. This can make recovery more difficult and constrain a community’s ability to invest in natural disaster mitigation and preparedness strategies (Jerolleman, 2020). While recovery rarely means a return to pre-disaster conditions, there are advantages that rural areas can count on to get them beyond a constant cycle of recovery and preparedness. Rural government structures tend to be less complex, giving them more flexibility to make decisions, but sometimes these advantages can be eliminated by a lack of cash reserves and staff capacity (Jerolleman, 2020). Rural areas also tend to have stronger social bonds, a greater sense of self-reliance, and a defined sense of community, which creates a collective action that aids in disaster recovery (Jerolleman, 2020). Communities that experience repeated flooding learn from each event to improve their response to and preparedness for the next one. For example, over time, these 13 counties developed two key pieces for flood recovery: a strong network of housing nonprofits and a local community foundation, the Foundation for Appalachian Kentucky, with the capacity to collect and redistribute money. In 2022, the foundation distributed $7.5 million in grants to over 7,650 households.

A flooded home and garage in Letcher County, Kentucky.
Building resilience
A key condition of a region’s resilience in response to a disaster is how well people and organizations work together. We see this in eastern Kentucky. When asked about the region’s biggest strength during the recovery, without hesitation, Back replied, “The youth. They came out in droves, working in the hot July and August sun, just loading up, delivering, and handing out supplies.” Kristin Collins, Esq., chief operating officer of the Foundation for Appalachian Kentucky, also experienced this firsthand. She told of eight high school students who “came to our office every day for two weeks, volunteering up to 50 hours a week answering phones, talking to people, and listening because people just wanted to tell their stories.” Many counties have created long-term recovery groups made up of key stakeholders such as faith-based organizations, nonprofits, local government, and businesses to assist communities as they recover from disasters. Meanwhile, donations poured in from churches and private businesses. Food trucks arrived to serve hot meals, because, as Back explained, “You're so busy trying to save what you can out of your home, and you have no running water, you have no electricity, you have no way to really feed yourself.”
During our interview, Davis declared that “[I’ve] never been as moved or felt as proud about being from eastern Kentucky as I've been in watching the response to this flood, but a lot of people are still living in the trauma.” Rebuilding takes time and many homes remain damaged, exacerbating a shortage of affordable housing, and families move away, further weakening an economy dealing with the decline of coal mining.
The other reality is that the region will flood again.
In the year since the July 2022 flood, recovery is well underway: businesses have reopened, homes are being rebuilt, and roads are being repaired. Actions have been undertaken that can be applied to other places facing recurring floods. The state of Kentucky has helped to secure four large plots of land on higher ground, totaling more than 200 acres with the potential to contain hundreds of units of housing, which is really the only sure way to be safe from a flood. Floodwalls, levees, and flood gates continue to be installed around the hardest-hit places. During the rehab and rebuild stage, mechanicals such as air conditioners are being elevated to lessen the chance of water damage and flood vents are being installed to prevent foundations from being blown out by the pressure of floodwaters. Yet, the thing that ties this all together is the people. These strong social ties and sense of self-reliance developed over generations culminate in a sense of community, a community that comes together during flood recovery. Explained McReynolds, “We're rural people, we're mountain people, we're going to take care of our own, we're going to do it ourselves.”
Endnotes
- The Kentucky counties of Breathitt, Clay, Floyd, Johnson, Knott, Leslie, Letcher, Magoffin, Martin, Owsley, Perry, Pike, and Whitley. Return to 1
- Bridget Back, deputy director, Eastern Kentucky Concentrated Employment Program, Inc.; Kristin Collins, Esq., chief operating officer, Foundation for Appalachia Kentucky; Dee Davis, president, Center for Rural Strategies; and Scott McReynolds, executive director, Housing Development Alliance. Return to 2
- Calculated as total damages from 1967–2021 divided by 2021 population. Return to 3
- The counties of Clay, Knott, and Pike are unavailable in the dataset. Return to 4
- Cost of the average HO-3 policy, which is the most common in Kentucky, making up 61.3 percent of homeowner policies. Return to 5
- This is based on the average cost of 2,904 flood insurance policies in the 13 counties as of December 31, 2022, which accounts for only 3.8 percent of all owner-occupied homes in the region, according to the 2017–2021 American Community Survey. Return to 6
References
- Blankenship, Bonnie S. 2023. “Workers Are Essential for Rebuilding after Historic Flooding in Eastern Kentucky.” Notes from the Field (blog). Federal Reserve Bank of Cleveland. March 9, 2023. https://www.clevelandfed.org/publications/notes-from-the-field/2023/nftf-20230309-workers-essential-rebuilding-after-historic-flooding.
- Boustan, Leah Platt, Matthew E. Kahn, Paul W. Rhode, and Maria Lucia Yanguas. 2020. “The Effect of Natural Disasters on Economic Activity in US Counties: A Century of Data.” Journal of Urban Economics 118: 103257. https://doi.org/10.1016/j.jue.2020.103257.
- Dixon, Eric, and Rebecca Shelton. 2023. “Housing Damage from the 2022 Kentucky Flood.” Ohio River Valley Institute and Appalachian Citizens’ Law Center. https://ohiorivervalleyinstitute.org/housing-damage-2022-ky-flood/.
- Elliott, James R, and Zheye Wang. 2023. “Managed Retreat: A Nationwide Study of the Local, Racially Segmented Resettlement of Homeowners from Rising Flood Risks.” Environmental Research Letters 18 (6): 064050. https://doi.org/10.1088/1748-9326/acd654.
- FEMA. 2023. “OpenFEMA Dataset: Disaster Declarations Summaries, V2.” Accessed September 8, 2023. https://www.fema.gov/openfema-data-page/disaster-declarations-summaries-v2. This product uses the Federal Emergency Management Agency’s OpenFEMA API, but is not endorsed by FEMA. The federal government or FEMA cannot vouch for the data or analyses derived from these data after the data have been retrieved from the agency's website(s).
- Foundation for Appalachian Kentucky. 2023. “Annual Report 2022: Rising Where We Are Rooted.” https://www.appalachianky.org/annual-report/.
- Garcia, Joseph, and Sarah Magin. 2022. “Beshear: 44 Kentuckians Killed in Devastating Summer Flooding.” Whas11.Com, December 22, 2022. https://www.whas11.com/article/weather/kentucky-flooding/gov-beshear-flooding-eastern-kentucky-floyd-breathitt-clay-owsley-letcher-pike-county-death-toll/417-205e4d41-73d3-4565-acbe-bc2ab1120a96.
- Hersher, Rebecca, and Ryan Kellman. 2020. “Living In Harm’s Way: Why Most Flood Risk Is Not Disclosed.” NPR, October 20, 2020. https://www.npr.org/2020/10/20/921132721/living-in-harms-way-why-most-flood-risk-is-not-disclosed.
- Jerolleman, Alessandra. 2020. “Challenges of Post-Disaster Recovery in Rural Areas.” In Louisiana’s Response to Extreme Weather, edited by Shirley Laska, 285–310. Extreme Weather and Society. Cham: Springer International Publishing. https://doi.org/10.1007/978-3-030-27205-0_11.
- Krauth, Olivia. 2022. “Eastern Kentucky Flood Death Toll Climbs to 44, Beshear Says.” Louisville Courier Journal, December 22, 2022, sec. Politics. https://www.courier-journal.com/story/news/politics/2022/12/22/eastern-kentucky-flood-death-toll-climbs-to-44-beshear-says/69751648007/.
- Myers, Katie. 2022. “Floods Took Their Family Homes. Many Don’t Know When — or If — They’ll Get Help.” NPR, September 13, 2022. https://www.npr.org/2022/09/13/1122042884/a-month-after-record-flooding-a-crooked-road-lies-ahead-for-eastern-kentucky.
- National Association of Insurance Commissioners. 2022. “Dwelling Fire, Homeowners Owner-Occupied, and Homeowners Tenant and Condominium/Cooperative Unit Owner’s Insurance Report: Data for 2020.” https://content.naic.org/sites/default/files/publication-hmr-zu-homeowners-report.pdf.
- National Weather Service. n.d. “Historic July 26th-July 30th, 2022 Eastern Kentucky Flooding.” National Oceanic and Atmospheric Administration (NOAA). Accessed September 8, 2023. https://www.weather.gov/jkl/July2022Flooding.
- Pollard, Kelvin, Sara Srygley, and Linda A. Jacobsen. 2023. “The Appalachian Region: A Data Overview from the 2017-2021 American Community Survey.” Population Reference Bureau, prepared for the Appalachian Regional Commission. https://www.arc.gov/report/the-appalachian-region-a-data-overview-from-the-2017-2021-american-community-survey/.
- Roth Tran, Brigitte, and Daniel Wilson. 2023. “The Local Economic Impact of Natural Disasters.” Working Paper 2020-34. Federal Reserve Bank of San Francisco. https://doi.org/10.24148/wp2020-34.
- US Census Bureau. 2022. “American Community Survey 2017–2021.” https://www.census.gov/programs-surveys/acs/data.html.
- Wilson, Bradley, Eric Tate, and Christopher T. Emrich. 2021. “Flood Recovery Outcomes and Disaster Assistance Barriers for Vulnerable Populations.” Frontiers in Water 3 (December): 752307. https://doi.org/10.3389/frwa.2021.752307.
All photos courtesy of Bridget Back; Whitesburg, Kentucky; July 28, 2022.
Suggested Citation
Klesta, Matt. 2023. “Resilience and Recovery: Insights from the July 2022 Eastern Kentucky Flood.” Federal Reserve Bank of Cleveland, Community Development Reports. https://doi.org/10.26509/frbc-cd-20230927
This work by Federal Reserve Bank of Cleveland is licensed under Creative Commons Attribution-NonCommercial 4.0 International

