- Share
The Opioid Epidemic and Its Effects: A Perspective on What We Know from the Federal Reserve Bank of Cleveland
Drug overdoses are now the leading cause of death for Americans under 50. In the Fourth District states of Kentucky, Ohio, Pennsylvania, and West Virginia, opioid overdose deaths are occurring at rates that exceed the 2016 national average of 13.2 deaths per 100,000 people. In fact, opioid overdose deaths in Kentucky, Ohio, and West Virginia are at least 1.5 times more frequent than the national average. To what degree the opioid epidemic is connected to the labor market? Is a declining labor force participation rate a result of the opioid abuse, or is opioid abuse a result of declining economic conditions? This report details what the Federal Reserve Bank of Cleveland has learned as we sought to gain a better understanding of the opioid epidemic and specifically, its effect on workers’ participation in the labor force.

The views expressed in this report are those of the author(s) and are not necessarily those of the Federal Reserve Bank of Cleveland or the Board of Governors of the Federal Reserve System.
Key Findings:
- The epidemic is the result of a prescription opioid problem evolving into an illegal opioid problem.
- During the last few years, though the epidemic has grown dramatically across the nation, it disproportionately affects states in the Fourth Federal Reserve District.
- According to surveys conducted in the first quarter of 2018, both business community members and community development stakeholders report being impacted by the epidemic.
- Recent Cleveland Fed research suggests that counties that have higher levels of opioid prescriptions during the period from 2006 to 2016 have substantially lower prime-age labor force participation rates, but the research also shows that the labor market shock of the Great Recession did not significantly increase opioid use.
Related Fed reads:
- March 2019 working paper: Opioids and the Labor Market
- September 2017 Economic Commentary: The Opioid Epidemic and the Labor Market
- June 2017 Policy Summit session: The Opioid Crisis
- November 2017 report: The Opioid Epidemic in the Fifth District (Richmond Fed)
- October 2017 report: Economic Aspects of the Opioid Crisis (Richmond Fed)
Introduction
Drug overdoses are now the leading cause of death for Americans under 50.1 In the Fourth Federal Reserve District states of Kentucky, Ohio, Pennsylvania, and West Virginia, opioid overdose deaths are occurring at rates that exceed the 2016 national average of 13.2 deaths per 100,000 people. In fact, opioid overdose deaths in Kentucky, Ohio, and West Virginia are at least 1.5 times more frequent than the national average.
What is not clear, however, is to what degree the opioid epidemic is connected to the labor market. Is a declining labor force participation rate a result of the opioid abuse, or is opioid abuse a result of declining economic conditions? Some scholars have suggested that poor labor market outcomes such as low labor force participation are related to opioid abuse,2,3 while other scholars have proposed that causality runs in the opposite direction.4,5 This report details what the Federal Reserve Bank of Cleveland has learned as we sought to gain a better understanding of the opioid epidemic and specifically, its effect on workers’ participation in the labor force.
Background Information and a Sense of Scale from the Policy Summit
The opioid epidemic, and drug abuse generally, is a medical and public health topic in which a central bank typically has little expertise. As a starting point to understanding the crisis and its potential impact on people and the economy, we reached out to those who are closer to the issue to see what we could learn from them. We invited several public and mental health professionals to speak at a panel session at our 2017 Policy Summit. The panelists presented on a variety of aspects of the opioid crisis. During the session, each panelist noted the roles that the over prescription of opioids and the disease of addiction have played in creating and intensifying the problem and agreed that medication-assisted treatment resources are much needed. Panelists concurred that the epidemic had begun with a prescription opioid problem, which then evolved into an illegal opioid problem. Specifically, panelists cited heroin and fentanyl—both readily available and lower-cost alternatives to prescription pain medications—as the major cause behind the recent spike in overdose deaths. Relatedly, 75 percent of heroin users seeking treatment claim their opioid abuse began with a legal prescription.6
The cost of the opioid crisis, panelists declared, is devastating to many more than those who abuse the drugs: An estimate of the total societal costs of prescription opioid abuse was $78.5 billion in 2013 alone, with $20 billion of that sum attributed to lost productivity and production.7 An estimate from the Council of Economic Advisors, using different assumptions, found the economic cost of the epidemic to be $504 billion in 2015.8 With most estimates in the billions, it is clear that there are significant economic impacts on human capital as well as state and local finances.
Data and Trends: Regionally and Nationally
In addition to gaining a better understanding of the overall epidemic, it is imperative to understand what data are—and are not—available. The data not only color our perception of the epidemic and who it affects and when, but they also help to inform what research questions are currently able to be answered. Much of what we do know is from the Centers for Disease Control and Prevention (CDC), which produces the two main sources of data: overdose death data and prescription opioid data.
Overdose Deaths
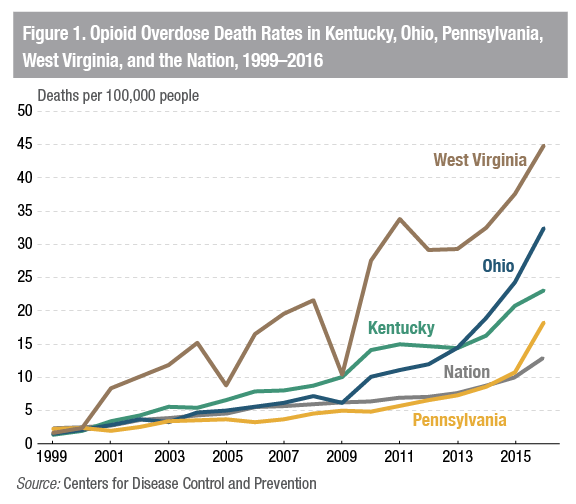
The available overdose death data have both strengths and weaknesses. They can be used to create descriptive statistics that can help describe the evolution of the epidemic. One can compare opioid overdose death rates over time and across geography as seen in figure 1. From 1999 to 2016, opioid overdose deaths in the nation increased 528 percent. Unfortunately, during that same period, opioid overdose deaths increased markedly faster in all Fourth District states: In Pennsylvania, opioid overdose deaths increased 736 percent; in Kentucky, Ohio, and West Virginia, opioid overdose deaths increased by more than 1,000 percent. Moreover, in 2016, the rate of opioid-related overdoses in each Fourth District state exceeded the national rate of 13.2 deaths per 100,000 people: In West Virginia, Ohio, Kentucky, and Pennsylvania, the 2016 opioid overdose death rate was 44.9, 32.5, 23.2 and 18.4 deaths per 100,000 people, respectively.
Figure 1. Opioid Overdose Death Rates in Kentucky, Ohio, Pennsylvania, West Virginia, and the Nation, 1999–2016
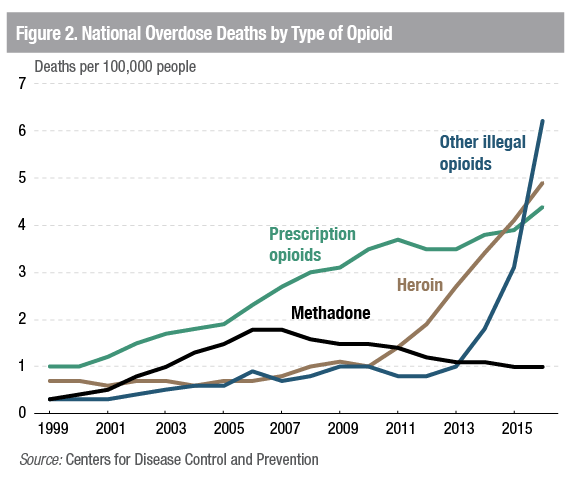
The overdose death data can also be used to see which types of opioids are driving overdose deaths. Figure 2 presents overdose death rates (per 100,000 people) for different groupings of opioids over time. Since 1999, deaths associated with prescription opioids have been increasing. Starting in 2011, heroin-related overdose deaths increased sharply and were followed by even sharper increases in deaths associated with other—more potent—illegal opioids such as fentanyl and carfentanil. While the evolution from prescription opioids to illegal opioids seems straightforward, it is important to consider that most overdose deaths involve multiple drugs, and that can muddle the narrative.9
Figure 2. National Overdose Deaths by Type of Opioid
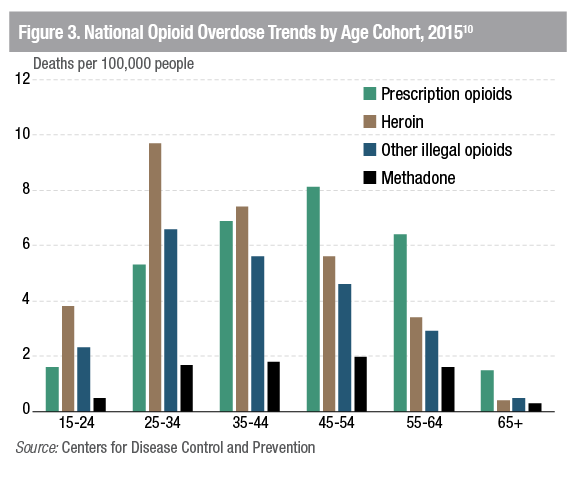
The opioid overdose death data can also be useful for examining which opioids are affecting different age cohorts (figure 3). In 2015, older cohorts were more likely to die from a prescription opioid overdose, while younger populations were more likely to die from a heroin or other illegal opioid overdose. Again, it is important to remember that more than one drug can be associated with an overdose.
Figure 3. National Opioid Overdose Trends by Age Cohort, 201510
The usefulness of this data series for economic research is limited by three important weaknesses. First, national opioid-related mortality rates were likely underreported by almost 25 percent because of differences in post-death testing and reporting practices across states.11 Moreover, this phenomenon is not consistent across states; underreporting of opioid-related deaths is found in some states (Pennsylvania, Indiana, New Jersey, and Arizona), while overreporting is found in others (Connecticut, Florida, Kentucky, New Mexico, Ohio, and South Carolina). Second, death certificates can list multiple opioids as the accidental cause of death. For example, when fentanyl is mixed in with heroin, both drugs might be recorded, making it difficult to definitively determine the specific opioid responsible for the overdose. Third, the limited availability of the data at the county level restricts the ability to associate it with labor market data.
The overdose data suggest that opioid-related overdose deaths in the Fourth District’s states have risen markedly and occur more frequently than the national average, but the number of opioid-related deaths alone does not tell the whole story of this epidemic’s effect on the economy. Deaths are an alarming final outcome, but other impacts on the labor market may precede death, including reduced labor market activity, lower productivity, and impacts on other workers. While the overdose data can be useful to describe broad trends and the death toll resulting from the opioid epidemic, overdose deaths remain an imperfect measure of the full economic impacts of the crisis.
Prescription Rates
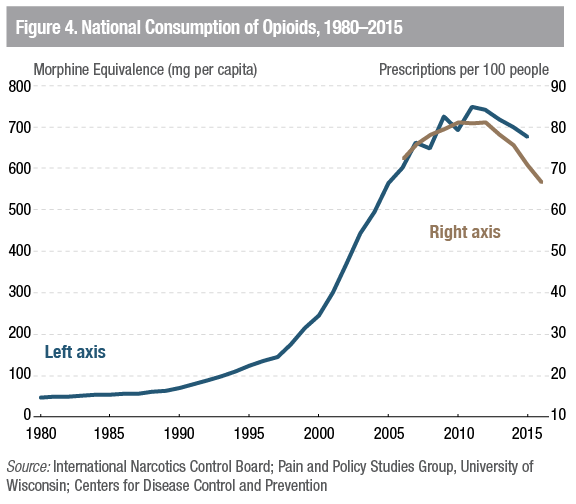
Though the overdose death data garner attention because they are surprising and involve the loss of human life, we have found that prescription opioid data are useful for understanding the evolution of the crisis and how it has affected our economy. The CDC notes that prescription opioid data are “based on a sample of approximately 59,000 retail (non-hospital) pharmacies, which dispense nearly 88% of all retail prescriptions in the U.S.” and “cover 87% of all counties.”12 The prescription opioid data are expressed as the number of prescriptions per 100 people, making them useful for comparing counties of different sizes. For this data series, the CDC considers a prescription to be “an initial or refill prescription dispensed at a retail pharmacy in the sample, and paid for by commercial insurance, Medicaid, Medicare, or cash or its equivalent.”13 Ideally, a researcher would also want information on the strength and duration of each prescription to gauge the supply more precisely, but this information is not readily available, and the published prescription rate serves as a reasonable proxy for the supply of prescription opioids found in each county. The CDC did produce a data series on the geographic distribution of the morphine milligram equivalent (MME), which would give a more specific estimate of supply, but it is only for one year (2015). Comparing the two series, we found the prescription rate data were highly correlated (0.9) with MME data series. Additionally, the CDC only publishes sub-national opioid prescription data going back to 2006. An alternative yet similar data series contains national data back to 1980 and reveals a substantial surge in the consumption of opioids during the 1990s and 2000s. Figure 4 shows that the national consumption of opioids increased from less than 100 mg per person in 1990 to almost 700 mg per person in 2010.
Figure 4. National Consumption of Opioids, 1980–2015
The remainder of this section describes the broad trends in the CDC-published prescription opioid data. When considering these trends, it is important to think about the prescription rate as the supply of an addictive product. Following this thinking, counties with a high level of supply—and increases in that supply—have a higher potential for prescription opioid abuse. The more pills available, the greater someone’s chances to abuse them. Importantly, a decrease in the supply of prescription opioids may not simply decrease the potential for prescription opioid abuse; there may be unintended consequences. For example, when there are fewer pills available, the potential for a nonaddicted person to abuse opioids is decreased, but the person already abusing opioids may switch from prescription opioids to illegal opioids.14
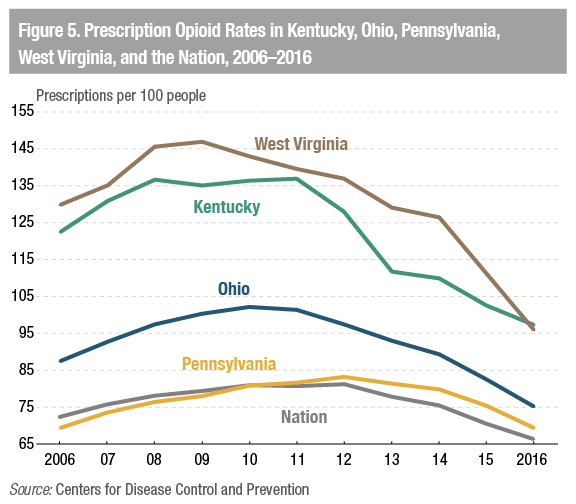
With prescription opioid data, one can compare prescription rates over time and across geographies. Figure 5 shows that the national supply of prescription opioids increased from 72 prescriptions per 100 people in 2006 to 81 prescriptions per 100 people in 2010. The rate remained relatively stable from 2010 to 2012 before it declined roughly 18 percent to 67 prescriptions per 100 people in 2016. This inverted U-shaped pattern suggests that the supply of prescription opioids markedly increased before it plateaued and sharply decreased over the past few years. Note this trajectory refers to the supply of prescription opioids, not the use or abuse of opioids in general.
Fourth District states followed inverted U-shaped patterns similar to the nation’s over time but tended to have higher prescription rates overall. Notably, West Virginia’s and Kentucky’s prescription rates exceeded a 1 prescription per 1 person ratio for most of the period considered. However, from 2011 to 2016, opioid prescription rates declined faster in most Fourth District states than in the nation; the nation’s rate of decline was 17.8 percent, while West Virginia’s was 31.2 percent, Kentucky’s was 29.0 percent, Ohio’s was 25.7 percent, and Pennsylvania’s was 14.8 percent. Yet the latest data we have indicate that opioid prescription rates in West Virginia and Kentucky still remain significantly above even the peak national rates seen in the 2010–2012 period.
Figure 5. Prescription Opioid Rates in Kentucky, Ohio, Pennsylvania, West Virginia, and the Nation, 2006–2016
Prescription opioid rates vary considerably across counties. For example, figure 6 shows opioid prescriptions per 100 people by county in 2011. The CDC finds that “rates of opioid prescribing vary greatly across states in ways that cannot be explained by the underlying health status of the population, highlighting the lack of consensus among clinicians on how to use opioid pain medication.”15 Overall, Fourth District counties tended to have higher opioid prescription rates than most of the nation in 2011; of the 163 counties in the Fourth District with available data, 89 had a prescription rate of more than 1 prescription per person.
Figure 6. Opioid Prescription Rates by County, 2011
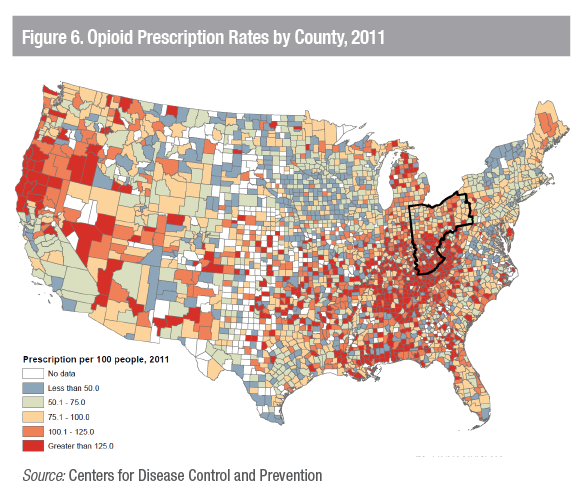
Table 1 shows Fourth District counties ranked by highest opioid prescription rate in 2011 (see appendix table for 2011 opioid prescription rates for all Fourth District counties). The 10 counties with the highest opioid prescription rates are all found in Kentucky, with 9 of the 10 having prescription rates in excess of 2.5 prescriptions for every person. Strikingly, Floyd County, Kentucky, had an opioid prescription rate of 4.26 prescriptions per person in 2011; that number declined by almost 50 percent to a still-elevated level of 2.26 prescriptions per person in 2016. The national opioid prescription rate in 2011 and 2016 was 0.81 prescriptions per person and 0.67 prescriptions per person, respectively. Opioid prescription rates in all of the counties in table 1 remain well above national averages in 2016 despite declines in excess of 20 percent (except Hancock County in West Virginia and Fayette County in Pennsylvania).
Table 1. Opioid Prescription Rates per 100 People in Fourth District Counties, 2011 and 2016
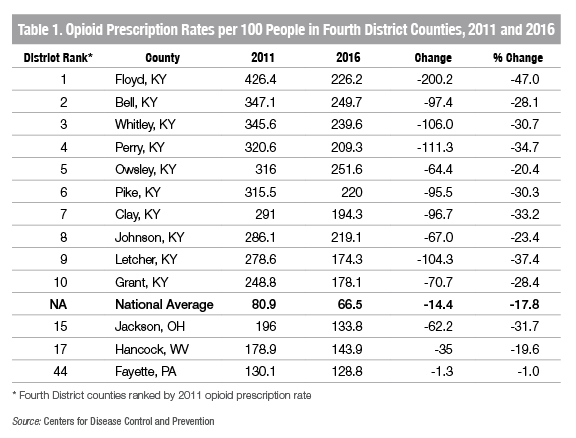
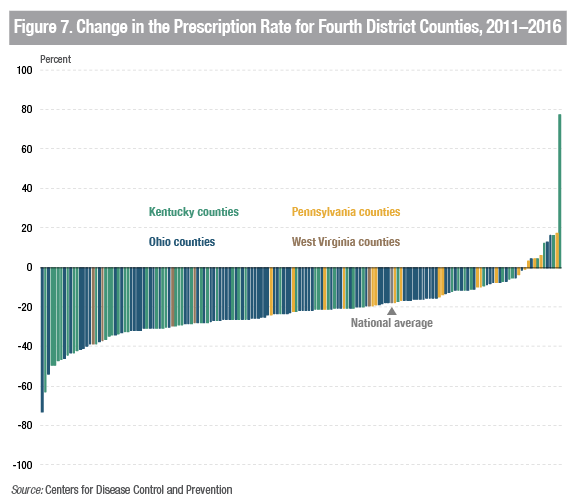
Figure 7 presents the change in the opioid prescription rate from 2011 to 2016 for Fourth District counties with available data (163 out of 169 counties). Consistent with the declines in opioid prescription rates shown in table 1, 67 percent of Fourth District counties saw a decline in opioid prescription rates from 2011 to 2016 that was greater than the nation’s decline in the opioid prescription rate. Despite sizable and widespread declines, the opioid prescription rate in 75 percent of Fourth District counties remained higher than the nation’s opioid prescription rate in 2016. Notwithstanding persistently high opioid prescription rates, one sign of progress is that in 2016, only 38 counties, down from 89 counties in 2011, in the Fourth District have an opioid prescription rate greater than 1 prescription per person; most such counties are in Kentucky.
Figure 7. Change in the Prescription Rate for Fourth District Counties, 2011–2016
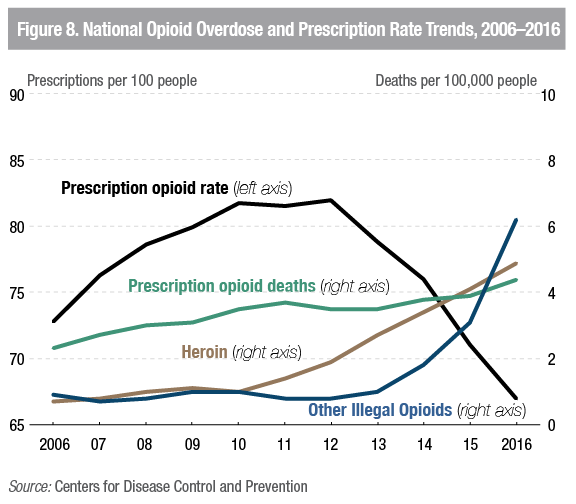
Bringing the overdose death data and prescription rate data together, as shown in figure 8, helps tell the story of the evolution of the opioid epidemic—a story that begins with a focus on prescription opioids and then shifts to illegal opioids. Viewed together, the data also suggest there may be unintended consequences associated with well-intentioned public policies designed to lower the supply of prescription opioids, as the decline in prescription opioids coincides with increases in opioid overdose deaths. While the pattern is informative, more analysis is required to reach a firm conclusion and would aid in setting policy responses going forward.
Figure 8. National Opioid Overdose and Prescription Rate Trends, 2006–2016
Interestingly, data at the state level reinforces the need for a cautious approach. States with large declines in the opioid prescription rate from 2011 to 2016 also experienced high opioid overdose death rates in 2016. For example, West Virginia, Kentucky, and Ohio saw opioid prescription rates drop by 43.9, 39.8, and 26.2 percentage points, respectively; yet they continue to have elevated opioid overdose death rates relative to the nation. However, at this point, it is unclear if the high rates of overdose deaths can be attributed to the initial high opioid prescription rates, declines in the supply of prescription opioids, or something else. Further research requiring better opioid overdose data and illegal drug supply data is needed to clarify the cause of the elevated death rates in 2016. Additional analysis would also need to account for other state-level opioid-related interventions introduced during the same period that were designed to lower the supply of prescription opioids.
Overall, recent data suggest a need to consider both the supply and demand dynamics of the opioid epidemic when contemplating the appropriate policy responses. Reducing the supply of prescription opioids without addressing the demand side may facilitate the spread of illegal opioids and cause the epidemic to get worse.16 Policy responses that consider both the supply and demand sides may benefit from being collaborative and coordinated such that policies are not implemented within, but rather across, silos.
Impact on Business and Communities
In addition to looking at data related to overdose deaths and prescription rates, we sought to better understand how the opioid epidemic was impacting the Fourth District more generally. To do this, we solicited input from the business community and direct service providers.
Input from the business community was obtained by surveying members of the Cleveland Fed’s eight Business Advisory Councils (BACs), advisory committees whose members represent firms from a cross-section of regional businesses and from labor, community development, and consumer organizations. Approximately half of the members of our BACs noted that the opioid epidemic was negatively impacting their businesses directly or indirectly. Several members reported having encountered hiring difficulties due to failed drug tests. A few members suggested that hiring difficulties in the trucking industry have led to increases in shipping costs. In terms of production, members in the construction and homebuilding industry stated that hiring difficulties for specific skilled trades have effectively slowed the building process. Other BAC members stated that while their employees may not have problems with opioids, employees’ family members were having troubles with opioid abuse. BAC members affiliated with philanthropy noted that resources were increasingly being redirected from other needs and concentrated on the opioid epidemic. BAC members also suggested that it is challenging for them to know if the opioid epidemic is impacting their business until there is an actual problem.
Through our Community Issues Survey, we survey 139 direct service providers, including workforce and economic development agencies, housing assistance centers, and other social service providers. Of these, 65 percent indicated that the opioid epidemic has negatively impacted their organization, with many respondents noting that this issue had the single most significant impact on the welfare of the communities they serve during the past year. A plethora of comments described stresses in the foster care system as the epidemic has broken families; others noted that extended families were bearing the brunt of the addicted parents. Many stakeholders stated that there was an increase in the demand for services, especially those for addiction treatment and youth programs. As a result, many of the service providers surveyed had expanded relationships with local mental health and substance abuse organizations along with medication-assisted treatment programs and drug courts. Others stated that they are experiencing capacity constraints as funding is increasingly being redirected from other needs in order to address opioid-related problems.
Opioids and the Labor Market Working Paper Findings
We have also been working to provide research on the key impacts of the opioid crisis. A recent working paper, “Opioids and the Labor Market,” directly addresses the question posed in the introduction: Is a declining labor force participation rate the result of the opioid abuse, or is opioid abuse the result of declining economic conditions?17 To do so, researchers Dionissi Aliprantis and Mark Schweitzer pursue two strategies. First, they statistically model how the availability of prescription opioids impacts local labor market outcomes. Using the CDC’s prescription opioid data coupled with individual labor market information, the researchers find large differences in outcomes depending on whether an individual resides in a county with a low prescription rate (60 prescriptions per 100 people) or one with a high prescription rate (120 prescriptions per 100 people). The labor force participation rate decreases 4.6 percentage points for prime-age men and 1.4 percentage points for prime-age women in high prescription rate counties. The researchers also find that the effects are more pronounced for those with a high school diploma or less. Second, Aliprantis and Schweitzer examine whether the Great Recession increased opioid use. If the labor market does drive opioid use, then a labor market shock as large as the Great Recession should be associated with an increase in opioid use. However, using data from the National Survey on Drug Use and Health, the researchers find that the Great Recession did not increase opioid use. Overall, this research suggests that opioid abuse is not influenced by short-term labor market shocks but that poor labor market outcomes are highly correlated with prescription opioid availability.
Conclusion
The Federal Reserve Bank of Cleveland remains committed to studying issues such as the opioid crisis that may be affecting the economic stability of people, their families, and their communities. This report outlines what we have learned as we sought to gain a better understanding of the opioid epidemic. It has shown that the Fourth District has been disproportionately affected by the opioid epidemic and that the epidemic’s magnitude is still large. The report documents that both businesses and community stakeholders are being impacted, and it presents research findings that suggest that poor labor market outcomes are associated with opioid availability.
References
- Katz, Josh. 2017. “Short Answers to Hard Questions about the Opioid Crisis.” The New York Times. nytimes.com/interactive/2017/08/03/upshot/opioid-drug-overdose-epidemic.html Return
- Case, Anne and Angus Deaton. 2015. “Rising Morbidity and Mortality in Midlife among White Non-Hispanic Americans in the 21st Century.” Proceedings of the National Academy of Sciences. 112(49): 15,078–83. Return
- Case, Anne and Angus Deaton. 2017. “Mortality and Morbidity in the 21st Century.” Brookings Papers on Economic Activity (Spring): 397–476. Return
- Krueger, Alan B. 2017. “Where Have all the Workers Gone? An Inquiry into the Decline of the US Labor Force Participation Rate.” Brookings Papers on Economic Activity. Return
- Ruhm, Christopher J. 2018. “Deaths of Despair or Drug Problems?” National Bureau of Economic Research, Working Paper No. 24188. doi.org/10.3386/w24188 Return
- Cicero, Theodore J., Matthew S. Ellis, and Jessie Harney. 2015. “Shifting Patterns of Prescription Opioid and Heroin Abuse in the United States.” New England Journal of Medicine. 373(18): 1789–90. nejm.org/doi/full/10.1056/NEJMc1505541 Return
- Florence Curtis, Chao Zhou, Feijun Luo, Likang Xu. 2016. “The Economic Burden of Prescription Opioid Overdose, Abuse, and Dependence in the United States, 2013.” Medical Care, 54(10): 901–6. Return
- Council of Economic Advisors. 2017. “The Underestimated Cost of the Opioid Crisis.” Executive Office of the President of the United States. whitehouse.gov/sites/whitehouse.gov/files/images/The%20Underestimated%20Cost%20of%20the%20Opioid%20Crisis.pdf Return
- Jones, Christopher M., Joseph Logan, R. Matthew Gladden, and Michele K. Bohm. 2015. “Demographic and Substance Use Trends Among Heroin Users — United States, 2002–2013.” Centers for Disease Control and Prevention, Morbidity and Mortality Weekly Report, 64(26):19–25. cdc.gov/mmwr/preview/mmwrhtml/mm6426a3.htm Return
- Centers for Disease Control and Prevention. 2017. “Surveillance Report Highlights from the Annual Surveillance Report of Drug-Related Risks and Outcomes United States.” Return
- Ruhm, C. J. 2017. Geographic Variation in Opioid and Heroin Involved Drug Poisoning Mortality Rates. American Journal of Preventive Medicine, 53(6): 745–53. Return
- Centers for Disease Control and Prevention. 2017. “U.S. Prescribing Rate Maps.” cdc.gov/drugoverdose/maps/rxrate-maps.html Return
- Ibid. Return
- Evans, William N., Ethan Lieber, and Patrick Power. 2018. “How the Reformulation of OxyContin Ignited the Heroin Epidemic.” The Review of Economics and Statistics. Forthcoming. doi.org/10.3386/w24475 Return
- Dowell D, Haegerich TM, Chou R. 2016. “Guideline for Prescribing Opioids for Chronic Pain—United States, 2016.” Centers for Disease Control and Prevention, Morbidity and Mortality Weekly Report. 65(1): 1–49. cdc.gov/mmwr/volumes/65/rr/rr6501e1.htm. Return
- Evans, William N., Ethan Lieber, and Patrick Power. 2018. Return
- Aliprantis, Dionissi, and Mark E. Schweitzer. 2018. “Opioids and the Labor Market.” Federal Reserve Bank of Cleveland, Working Paper no. 18-07. doi.org/10.26509/frbc-wp-201807. Return
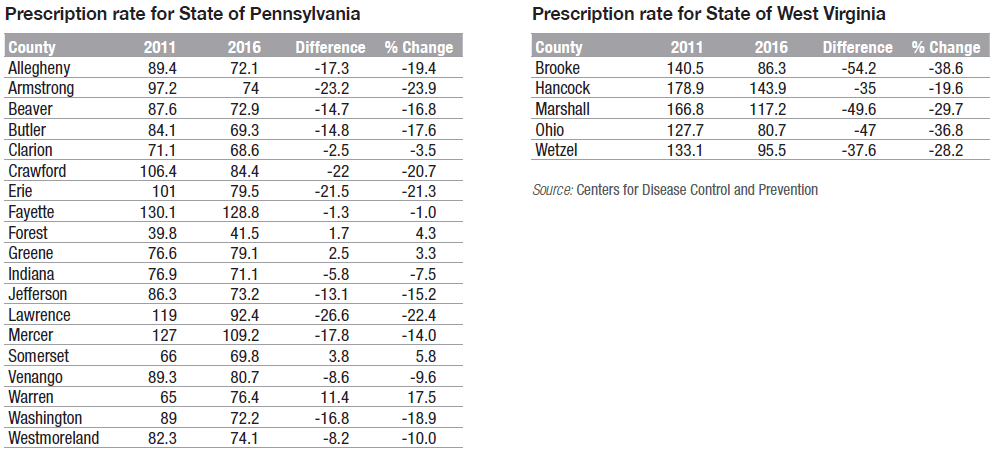
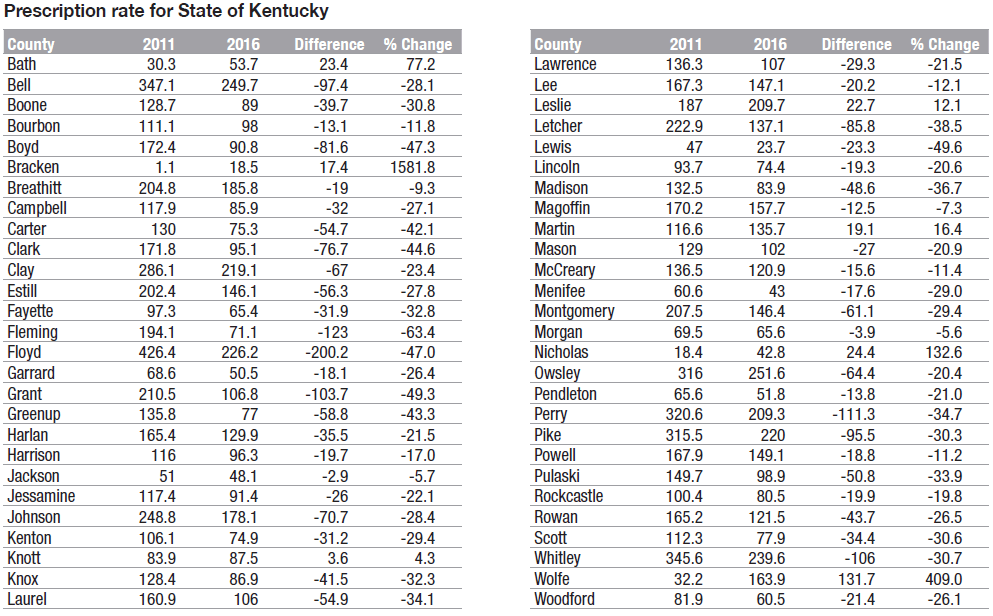
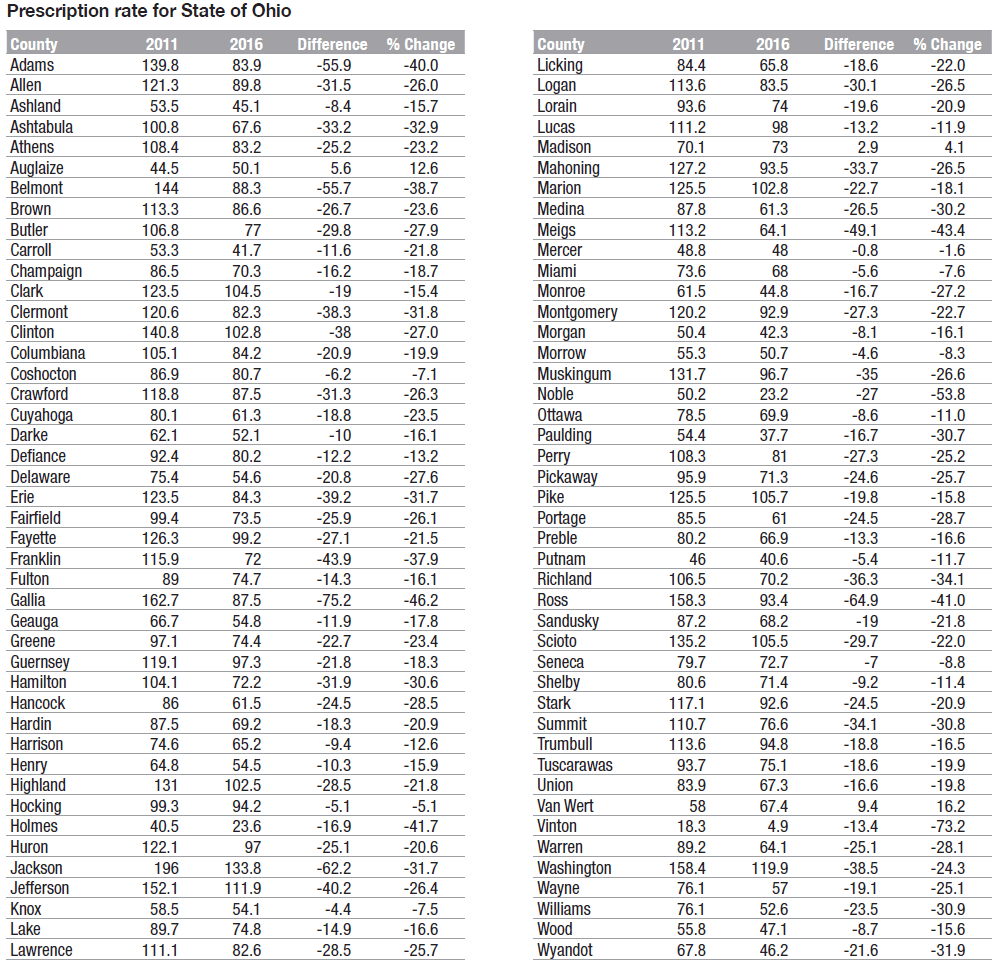
Appendix: Prescription Opioid Rates in Fourth Federal Reserve District Counties, 2011 and 2016
Prescription rate for State of Kentucky
Prescription rate for State of Ohio
Prescription rate for State of Pennsylvania and West Virginia