- Share
Broadband and High-speed Internet Access in the Fourth District
Broadband internet service is now considered by many to be a new form of infrastructure, and Federal regulators confirmed the importance of broadband access to rural communities in their recently updated guidance for the Community Reinvestment Act (CRA). This report documents the availability of high-speed internet access in the Fourth Federal Reserve District, which comprises all of Ohio, western Pennsylvania, eastern Kentucky, and the northern panhandle of West Virginia, using a series of maps and charts. While our analysis clearly shows there is limited broadband access in rural parts of the Fourth District, it shows that urban low- and moderate-income (LMI) areas also have limited access. As such, a case could be made to include investments in communications infrastructure in urban areas as CRA eligible based upon essential community needs.
The views expressed in this report are those of the author(s) and are not necessarily those of the Federal Reserve Bank of Cleveland or the Board of Governors of the Federal Reserve System.
Introduction
Broadband internet service is now considered by many to be a new form of infrastructure. A 2015 White House report noted that “broadband has steadily shifted from an optional amenity to a core utility for households, businesses and community institutions. Today, broadband is taking its place alongside water, sewer and electricity as essential infrastructure for communities.” As such, important aspects of daily life depend on the availability of broadband service, including education and access to employment opportunities and financial services.
Federal regulators confirmed the importance of broadband access to rural communities in their recently updated guidance for the Community Reinvestment Act (CRA). Released in the summer of 2016, the document noted that “an activity related to a new or rehabilitated communications infrastructure, such as broadband internet service, is important in helping to revitalize or stabilize underserved nonmetropolitan middle-income geographies.” The document also describes how investing in communications infrastructure is consistent with the CRA regulatory definitions of community development because it “helps to meet essential community needs.” (The guidance was issued by the Federal Reserve, the Office of the Comptroller of the Currency, and the Federal Deposit Insurance Corporation. The 2016 Interagency Questions and Answers Regarding Community Reinvestment can be found here.)
This report documents the availability of high-speed internet access in the Fourth Federal Reserve District, which comprises all of Ohio, western Pennsylvania, eastern Kentucky, and the northern panhandle of West Virginia, using a series of maps and charts. While our analysis clearly shows there is limited broadband access in rural parts of the Fourth District, it shows that urban low- and moderate-income (LMI) areas also have limited access. As such, a case could be made to include investments in communications infrastructure in urban areas as CRA eligible based upon essential community needs.
Applying broadband investments to CRA obligations
The Federal Reserve Bank of Dallas recently published a document describing a framework that financial institutions can follow to meet their CRA obligations by investing in broadband (“Closing the Digital Divide: A Framework for Meeting CRA Obligations”). This document provides best practices aimed at closing the digital divide as well as CRA reference guides and templates for how financial institutions can demonstrate that broadband is indeed a community need.
Data and Methods
The Federal Communications Commission (FCC) releases data on internet access for all census tracts in the country. The data starts in 2008, and the most recent data available are for 2015. Internet access is measured as the percentage of households in a particular census tract that have a fixed internet connection at either of two speeds. Five levels of access are reported: 0%, 20-40%, 40-60%, 60-80% and more than 80%. In addition, information about the total number of residential and mobile providers is collected and reported.
The two internet speeds measured are more than 200 Kbps in one direction and 10 Mbps download/1 Mbps upload. While neither speed meets the FCC’s definition of broadband (25 Mbps download/3 Mbps upload), the latter measure—10 Mbps download/1 Mbps upload—reflects the minimum speeds that are necessary for day-to-day online activities. As such, our analysis focuses on fixed connections defined as at least 10 Mbps downstream and at least 1 Mbps upstream; however, by using this slower internet speed, our analysis likely understates the need for broadband in the communities we study. Of the households we identify as having internet access, fewer will actually have the faster speeds deemed by the FCC as true broadband.
The Importance of Internet Access
Access to the internet has become increasingly important for individuals in many aspects of their lives, including seeking employment, accessing and using financial services, and completing school work, to name a few. But not all households have equal access to the internet. According to a 2015 FCC report, “49 percent of households making less than $25,000 used the internet at home, compared to 96 percent of households making $100,000.”1
This limited access to the internet by poorer households has consequences.
One of the biggest impacts of a lack of internet access is felt by jobseekers, as employers are using the internet as the primary mode of seeking, selecting, and interviewing suitable candidates. According to Georgetown’s Center on Education and the Workforce, “60-70% of jobs are posted online” and “more than 80% of jobs for those with bachelor’s degrees or better are posted online.”2 Relatedly, a 2015 White House brief notes that only 43 percent of individuals without a high school diploma use the internet, compared with 90 percent of those with a college degree.3 Lack of internet access, coupled with varying rates of use of (and perhaps familiarity with) the internet, can affect the ability of jobseekers to create professional resumes, connect with employers, and fill out applications.
Educational deficiencies are also exacerbated by the lack of high-speed connections among school-aged children in LMI households. According to Pew Research Center, “low-income homes with children are four times more likely to be without broadband than their middle- or upper-income counterparts.”4 The “homework gap,” as it has become known, suggests that low-income students are at a disadvantage without internet access because school work these days often requires access to the internet.
The increasing dependence on internet service is also seen with banking services. Pew Research Center found that “61% of internet users bank online, and 35% of cell phone users said they had used a phone”5 to access financial services. As banking continues to move online, internet access becomes essential to achieving equal access to credit and banking products.
“Broadband” and “internet”
Some people get confused about the difference between the terms “broadband” and “internet.” Broadband refers to the speed at which information can travel from one computer to other computers along a medium of transmission (cables, fiber optics, satellite, phone lines, etc.). Broadband allows for transfers of information at rates far faster than those of, for example, dial-up modems. The internet refers to a system of connections among computers that enables the machines to communicate with each other and with people using these computers. High-speed internet is often used as a synonym for broadband. The FCC defines broadband as 25 Mbps download and 3 Mbps upload.
Internet Access in the Fourth District
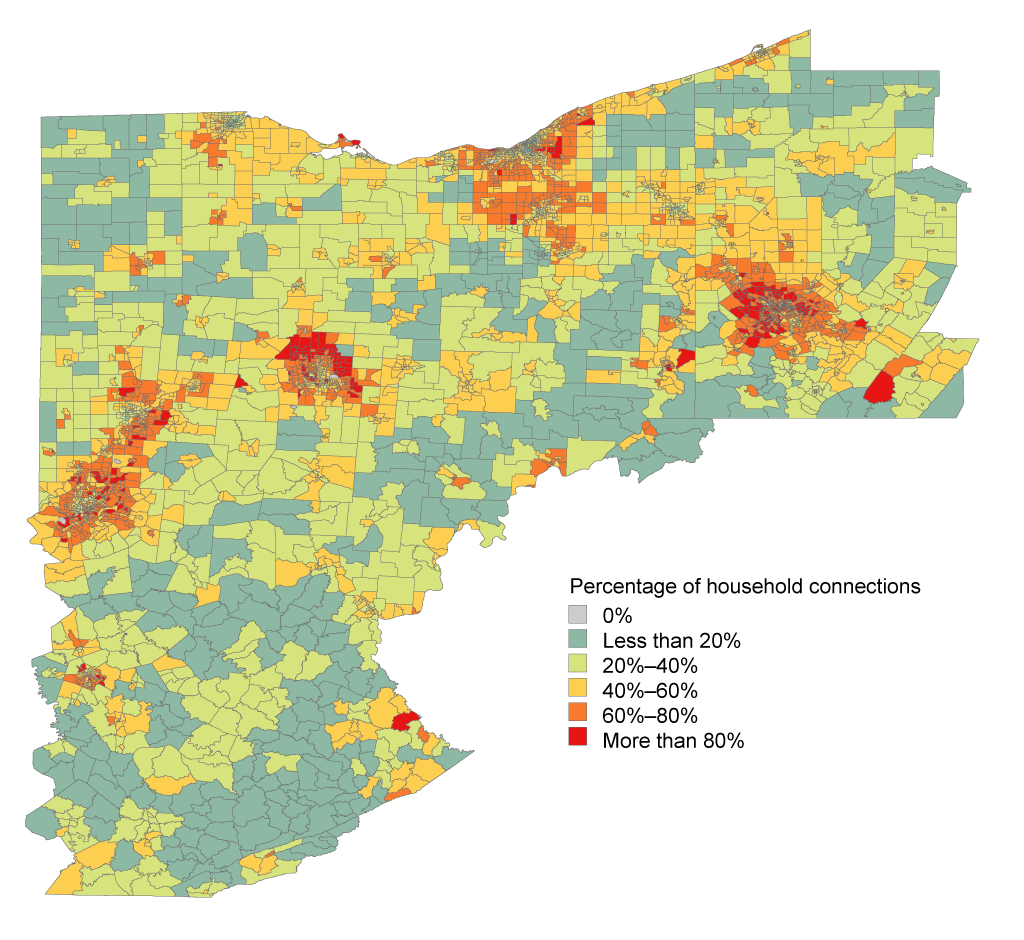
Map 1 shows the geographic distribution of residential connections to the internet in the Fourth District. At this scale, it is apparent that there are differences in internet access between urban and rural areas. Urban areas appear to have higher rates of access, but a closer examination below fully describes these patterns. In general, rural areas tend to have less than 40 percent of households with broadband access.
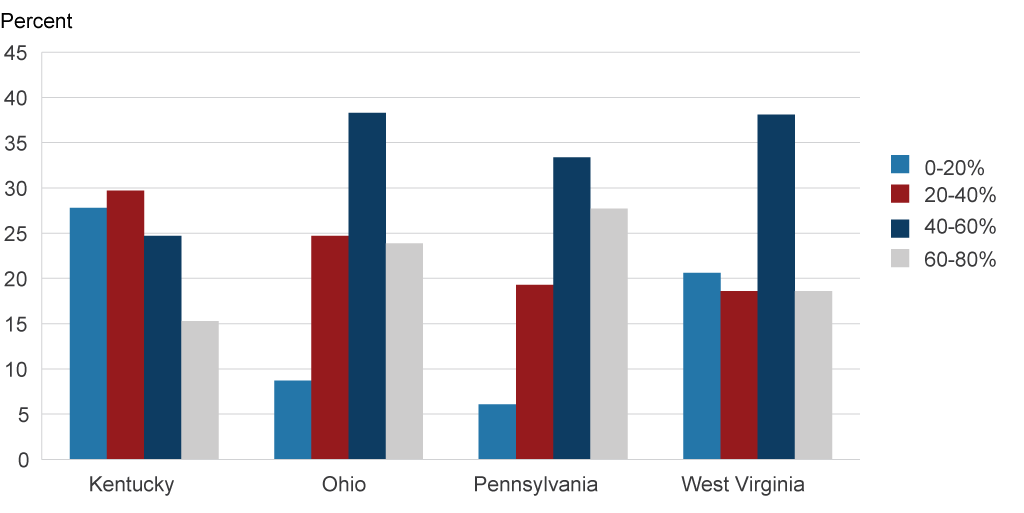
Chart 1 and table 1 present the share of census tracts in the portions of the four states that lie within the Cleveland Fed’s district by rate of household internet access. Of the four states, western Pennsylvania has the highest share of internet access among households. Forty-one percent of the census tracts in western Pennsylvania have greater than 60 percent of households with internet access, compared to just 28 percent of Ohio’s tracts, 23 percent of West Virginia panhandle tracts, and 18 percent of eastern Kentucky tracts. In fact, almost 30 percent of Fourth District Kentucky census tracts have internet penetration rates of less than 20 percent of households.
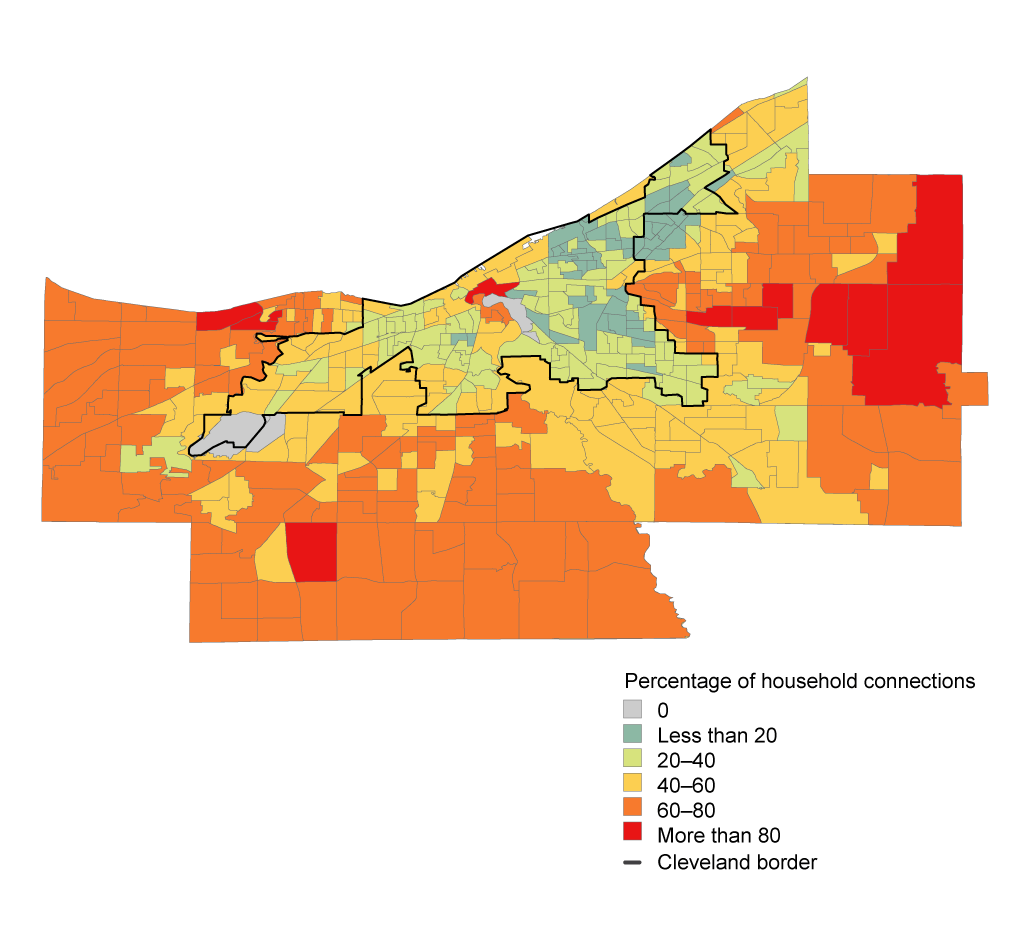
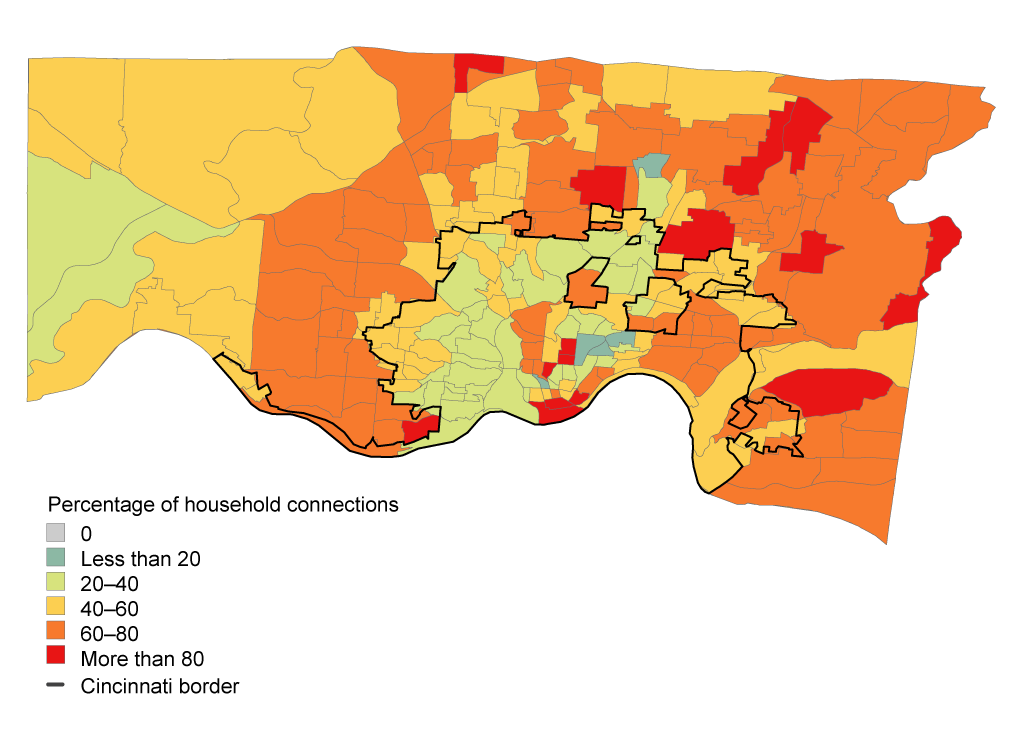
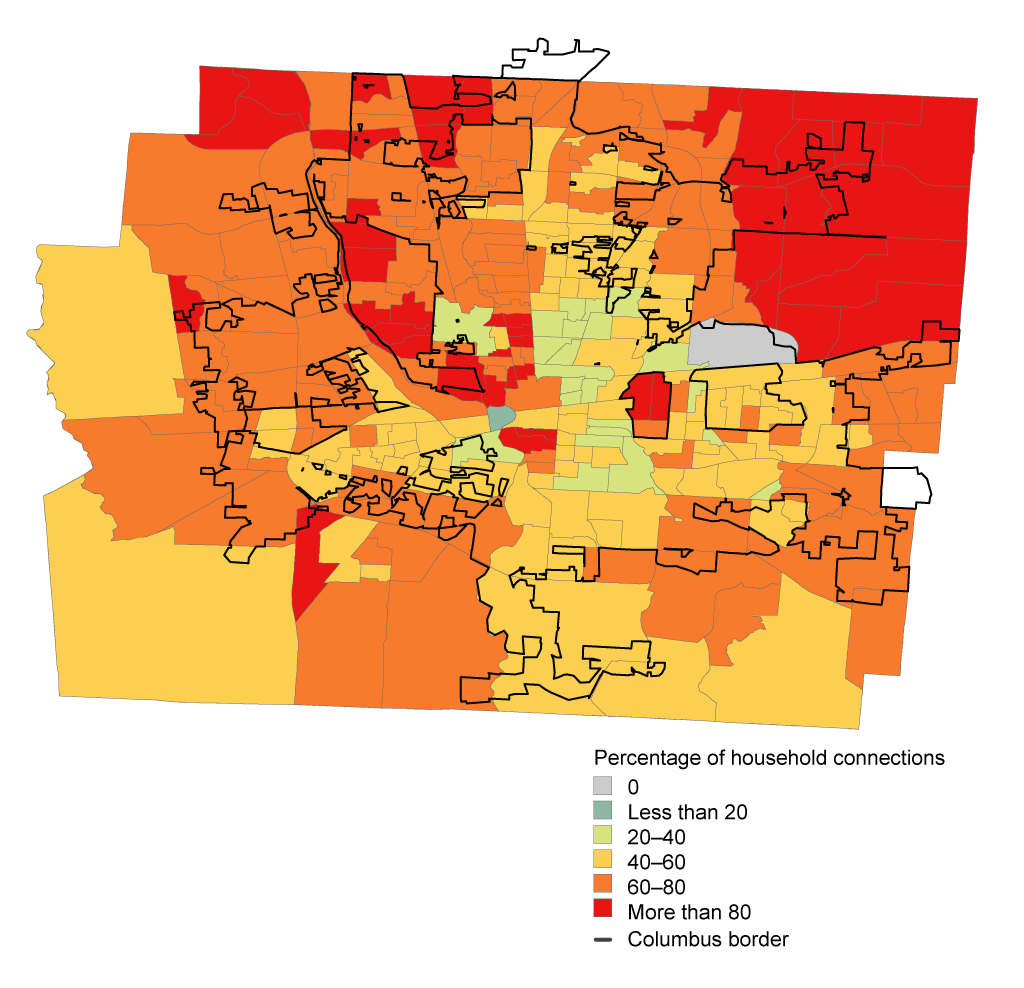
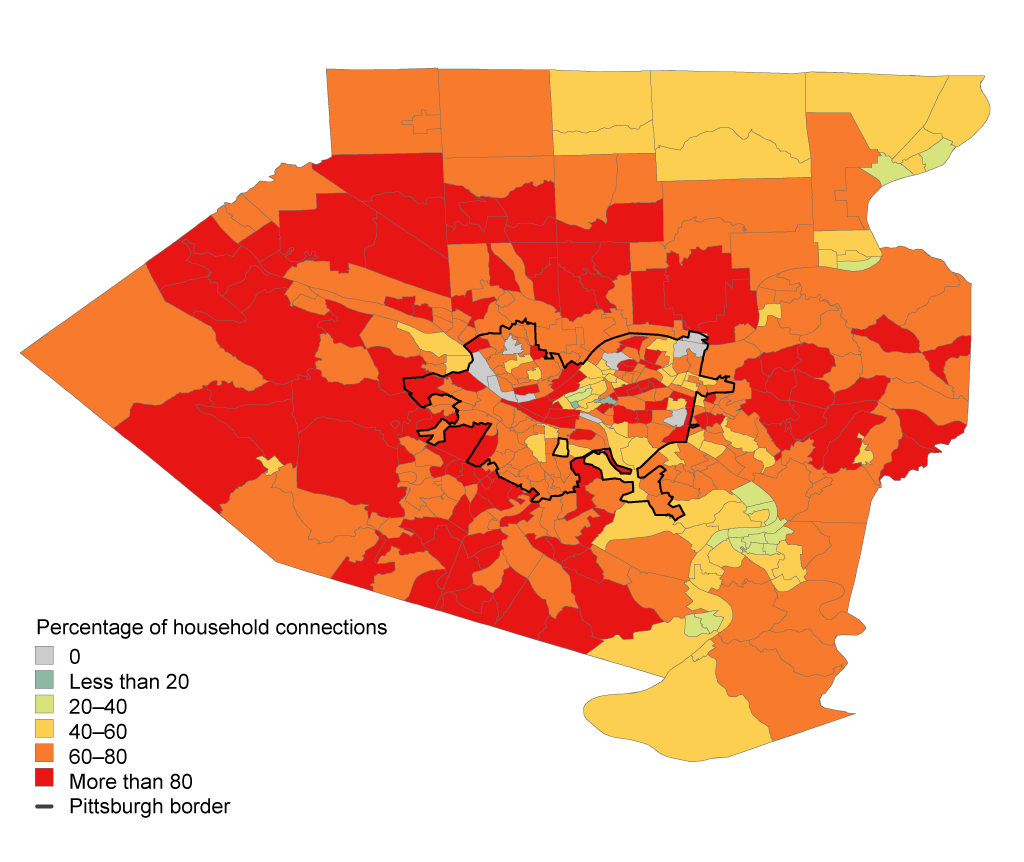
While the variation among states provides a good indicator of internet access, there is also quite a bit of variation within urban areas. Therefore, we also examine differences in internet access in the four most populous counties in the Fourth District—Cuyahoga, Hamilton, Franklin, and Allegheny—which include the cities of Cleveland, Cincinnati, Columbus, and Pittsburgh, respectively. These are shown in Maps 2, 3, 4, and 5. In general, census tracts closer to the city center tend to have fewer household internet connections compared to the outlying areas, as internet access mirrors local income levels.
A more detailed look at internet access in Cuyahoga County is shown in map 2 , while table 2 shows the percentage of census tracts reflecting different household internet penetration rates in the county. Approximately 33 percent of the census tracts have greater than 60 percent of households with internet connections. As the map shows, most of these tracts are on the periphery of the county. Conversely, those tracts with the lowest penetration rates (less than 40 percent of households with internet access) are found in the urban core as well as the east side of Cleveland, and account for 36 percent of the county’s census tracts.
Map 3 shows that Hamilton County has spatial patterns of internet access similar to Cuyahoga County but appears to have higher penetration rates. Lower rates of internet access tend to be found near the urban core, whereas the outlying areas tend to have higher rates of penetration. Nearly half (46.4%) of the census tracts in Hamilton County that have greater than 60 percent of households with internet connections are located in the outlying areas. The share of census tracts in Hamilton County with the lowest penetration rates are found near the urban core and account for about 22 percent of the county. Table 3 shows the percentage of census tracts reflecting different household internet penetration rates in the county.
The distribution of household internet connections in Franklin County is shown in map 4. The patterns of internet access in Franklin County are loosely similar to those seen in Cuyahoga and Hamilton County; however, the share of census tracts with the lowest penetration rates (less than 40 percent of households) is much lower at 10 percent. Relatedly, the share of census tracts with the highest penetration rates (greater than 60 percent) is higher, 58 percent compared to just 32.5 percent in Cuyahoga County and 46.4 percent in Hamilton County. Table 4 shows the percentage of census tracts reflecting different household internet penetration rates in the county.
Map 5 shows that Allegheny County varies significantly from the other three counties we examine in our analysis. Levels of internet penetration are similar in urban and outlying areas; Allegheny County also has much higher levels of internet access than the other three counties. Almost 80 percent of census tracts have the highest internet penetration rates (greater than 60 percent of households). Even more striking is that 31 percent of Allegheny census tracts have 80 percent of households with broadband access, compared to just below 3 percent in Cuyahoga, about 7 percent in Hamilton, and 16 percent in Franklin. Table 5 shows the percentage of census tracts reflecting different household internet penetration rates in the county.
With broad geographic trends in internet access identified, we now turn to variations in internet access across income groups. Table 6 shows the average share (population weighted) of households connected to the internet by income grouping. The 10 largest counties in the District are shown.
Internet penetration rates vary according to income group as well as by geography. In most counties, low-income census tracts have lower internet penetration rates compared to other income groupings. One exception is Allegheny County, where low-income census tracts have, on average, 62 percent of households with internet access compared to just 19 percent in Lucas County, whose low-income census tracts have the lowest percentage of households with internet access. In fact, low-income census tracts in Allegheny County average greater penetration rates than high-income census tracts in several other counties in the District. For example, the 62 percent of Allegheny County households with internet access in low-income census tracts is higher than the share of households with access in high-income census tracts in Erie, Lucas, Mahoning, and Stark counties.
Overall, greater support for investments in broadband and internet access is warranted in 9 of the 10 largest counties in the Fourth District.
Conclusion
Internet access varies markedly within the Fourth District, with LMI census tracts in both urban and rural areas generally having fewer households with internet access compared to higher-income census tracts. As more services continue to offer greater accessibility via online channels, internet access is increasingly essential to the well-being of LMI households and communities. While the uneven distribution of internet access within Fourth District communities warrants the attention of financial institutions, investments in training and equipment must accompany investments aimed at increasing access. For without a computer and the know-how, increased internet access does little to help LMI households and communities.
Footnotes
- https://apps.fcc.gov/edocs_public/attachmatch/FCC-15-10A1_Rcd.pdf Return
- https://cew.georgetown.edu/wp-content/uploads/2014/11/OCLM.Tech_.Web_.pdf Return
- https://www.whitehouse.gov/sites/default/files/wh_digital_divide_issue_brief.pdf Return
- http://www.pewresearch.org/fact-tank/2015/04/20/the-numbers-behind-the-broadband-homework-gap/ Return
- http://www.pewinternet.org/2013/08/07/51-of-u-s-adults-bank-online Return
Note:
Financial institutions should also contact their CRA examiners to obtain specific feedback on the strengths and weaknesses of their community development activities.


