

- Share
Employment Trends in Two Sectors Show a Region in Transition

The views expressed in this report are those of the author(s) and are not necessarily those of the Federal Reserve Bank of Cleveland or the Board of Governors of the Federal Reserve System.
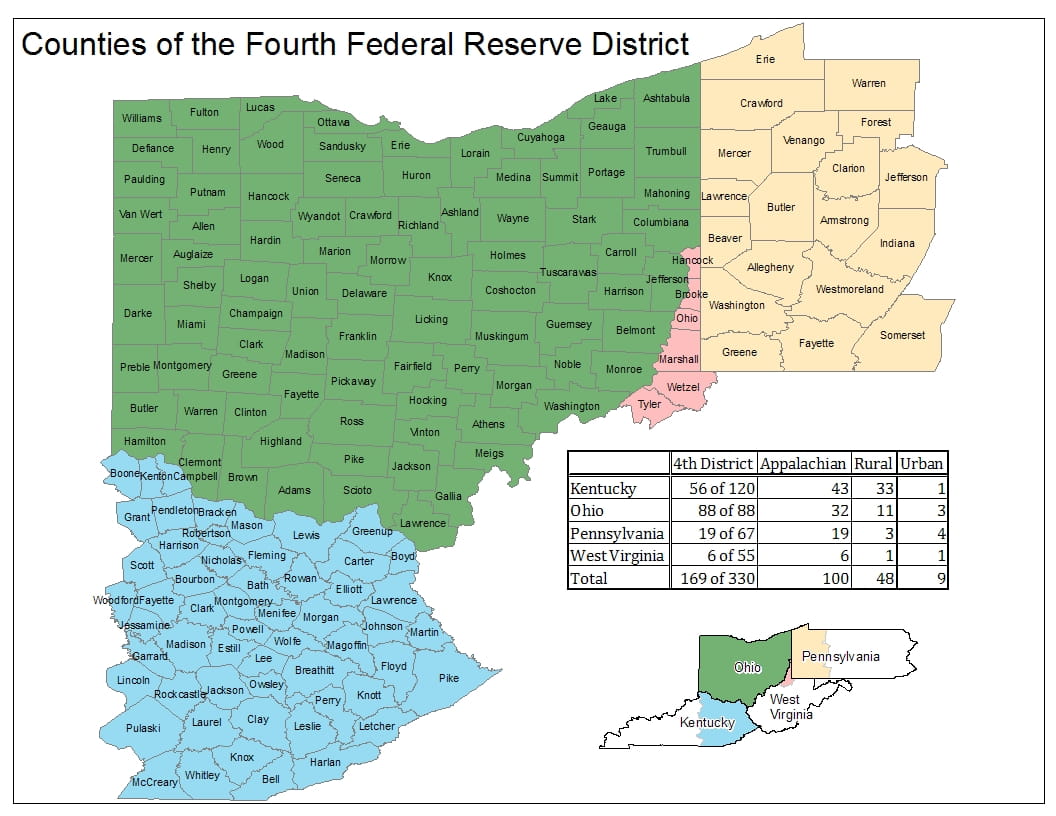
In this data brief, we examine trends in population and private employment in 17 metropolitan statistical areas (MSAs) in the Fourth District, with a focus on two sectors moving in opposite directions –manufacturing and education and health services.
Historically, much of the region has specialized in manufacturing, a sector that has been particularly hard hit over the past few decades as firms took advantage of cheaper labor costs overseas and adopted technology that allows for more efficient production methods—and fewer workers. Since the end of the Great Recession in 2009, however, the decline in manufacturing employment has slowed. In some places, employment has even grown. The story surrounding education and health services has played out a little differently, with two factors—a transition to a more knowledge-centric economy and an aging population—contributing to steady growth. In fact, education and health services was the only sector to grow in employment during the Great Recession.
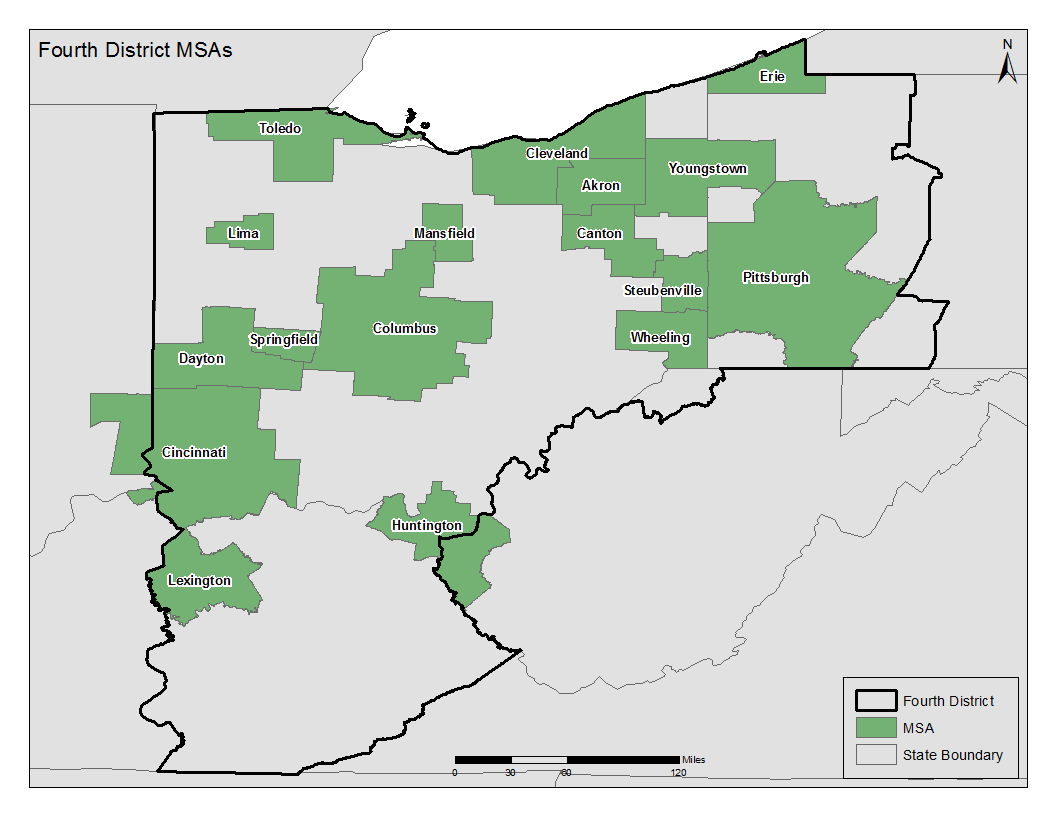
Fourth District MSAs
Findings
- Population continues to decline in many Fourth District MSAs.
- Manufacturing employment, while rebounding slightly since the Great Recession, is still well below 2001 employment levels.
- Employment in education and health services, which grew even during the Great Recession, continues to grow.
- However, within that sector there is a sizeable portion of workers earning a wage well under the national average.
Figure 1: Change in total population and total private employment (2001-2012)
Source: Bureau of Economic Analysis and the Bureau of Labor Statistics
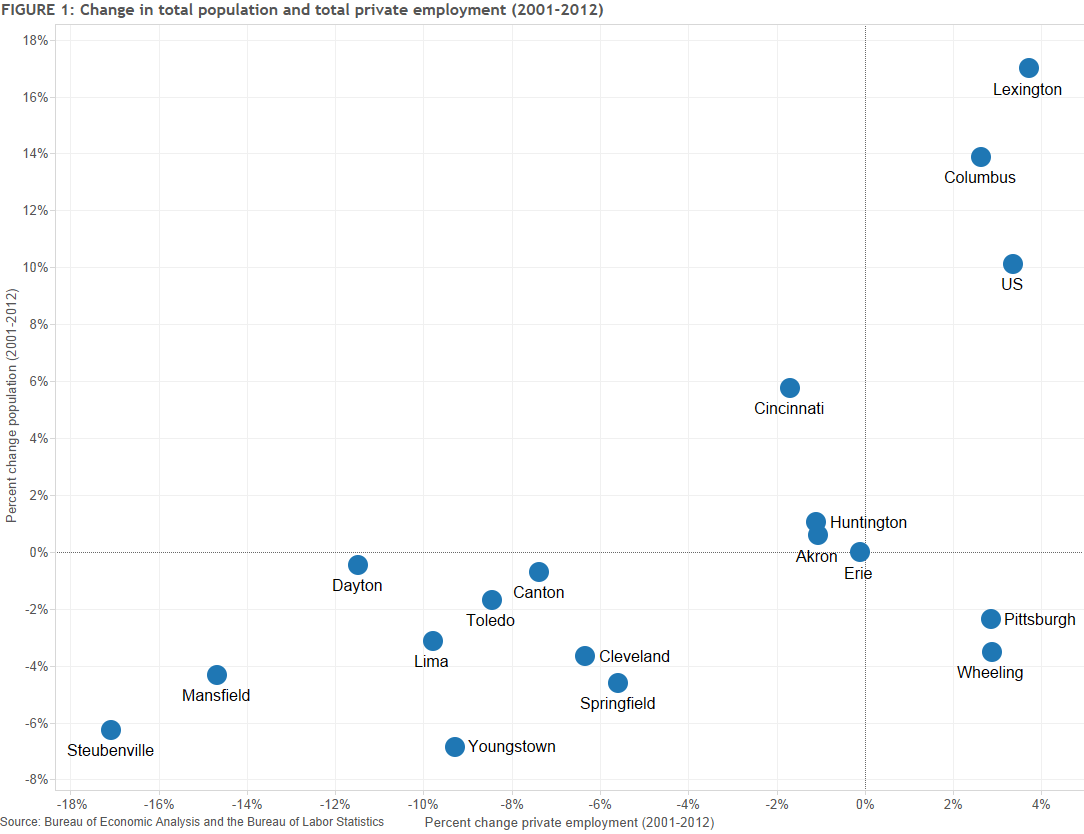
Figure 1 plots the percent change in total population (y-axis) against the percent change in total private employment (x-axis) from 2001 to 2012.
- In 2012, the 17 MSAs contained 78 percent of the District's total population, which is nearly the same share as in 2001.
- Pittsburgh is the largest MSA at 2.36 million, while Lima is the smallest at 105,141.
- The aggregate population of these MSAs has grown only 1.6 percent from 2001-2012. In comparison, the US population has grown 10 percent over the same period.
- Five of the 17 MSAs experienced population gains from 2001-2012; of those, only Cincinnati, Columbus, and Lexington posted increases every year.
- On the other hand, five of the 17 MSAs saw their populations decline every single year in this time period: Cleveland, Springfield, Steubenville, Wheeling, and Youngstown.
- Only four of the 17 MSAs saw employment gains over the time period. Columbus, Lexington, Pittsburgh and Wheeling all posted employment gains on par with national employment gains of 3 percent.
The location quotient is the ratio of an industry’s employment share between two regions. It is a way to measure an industry’s concentration within one region (an MSA, for example) compared to a base region (the United States). Values greater than 1.0 indicate greater specialization compared to the US as a whole.
Figure 2: Location quotients (2013)
Source: Bureau of Labor Statistics
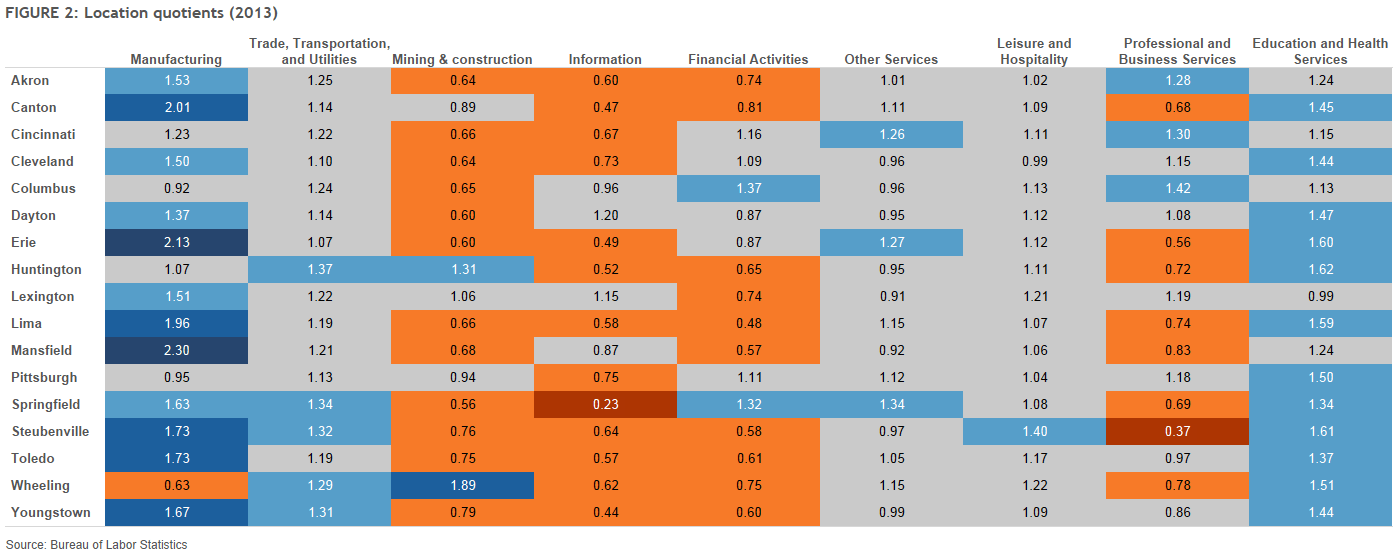
Figure 2 shows the 2013 location quotients for the 17 MSAs across the major employment sectors. Values greater than 1.25 are generally interpreted as high.
- Cells in blue indicate areas of greater specialization than the US, while orange cells indicate less.
- In 2013, Fourth District MSAs tended to be more specialized in two areas—manufacturing and education and health services—and less specialized in information and mining and construction.
Figure 3: Average annual rate of change by sector before, during, and after the Great Recession
Source: Bureau of Labor Statistics
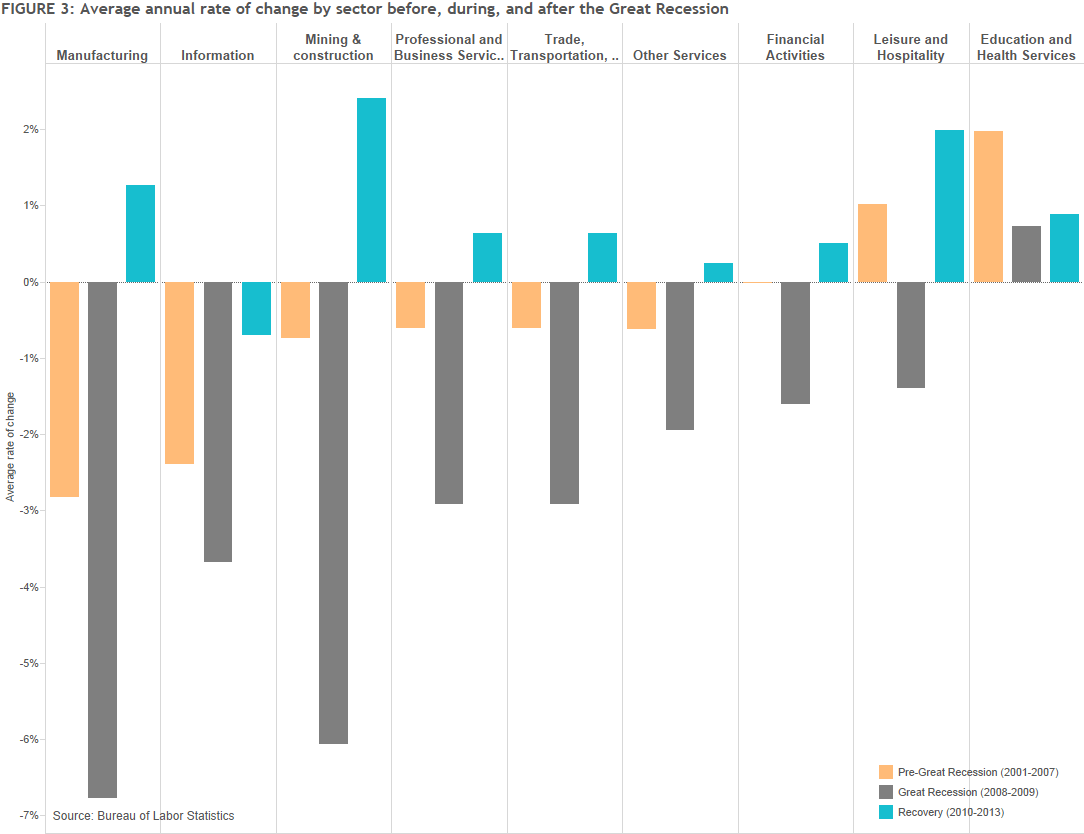
Figure 3 shows the average annual rate of change by industry sector across all 17 MSAs and three time periods: pre-Great Recession (2001-2007), Great Recession (2007-2009), and post-Great Recession (2009-2013).
- Prior to the Great Recession there was a mix of industries growing or shrinking, but when the recession hit every sector declined in employment with the exception of education and health services.
- Employment in most sectors has begun to rebound during the recovery period following the recession.
- The two sectors experiencing the most change also happen to be the two sectors that many MSAs in the Fourth District specialize in: manufacturing and education and health services.
Figure 4: Percent change in education and health services and manufacturing (2001-2013)
Source: Bureau of Labor Statistics
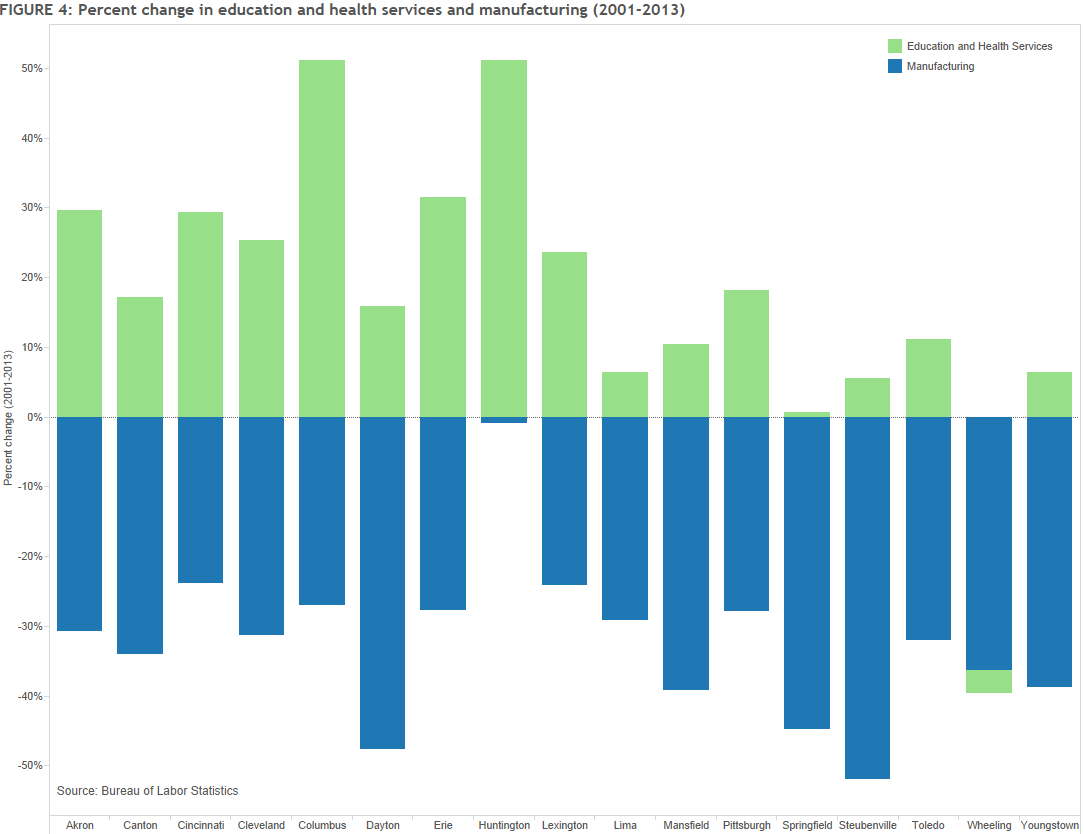
Figure 4 compares the percent change in manufacturing (blue) and education and health services (green) employment from 2001 to 2013 in each of the MSAs.
- Every MSA with the exception of Wheeling posted gains in education and health services and losses in manufacturing.
- In terms of sheer numbers, Cleveland manufacturing employment declined by more than 55,000 workers in this time period. However, as a percent change, manufacturing employment in Dayton and Steubenville were hardest hit, with employment declining by nearly 50 percent.
- On the other hand, Columbus gained more than 45,000 health and education service workers and, along with Huntington, experienced the greatest increase in share at 51 percent.
- In the US, for each manufacturing job lost there were 1.2 health and education service jobs gained. However, in the Fourth District, only four MSAs (Cincinnati, Columbus, Huntington, and Pittsburgh) gained more education and health service jobs than what was lost in their manufacturing sector.
Figure 5: Income trends (2001-2013)
Source: Bureau of Labor Statistics
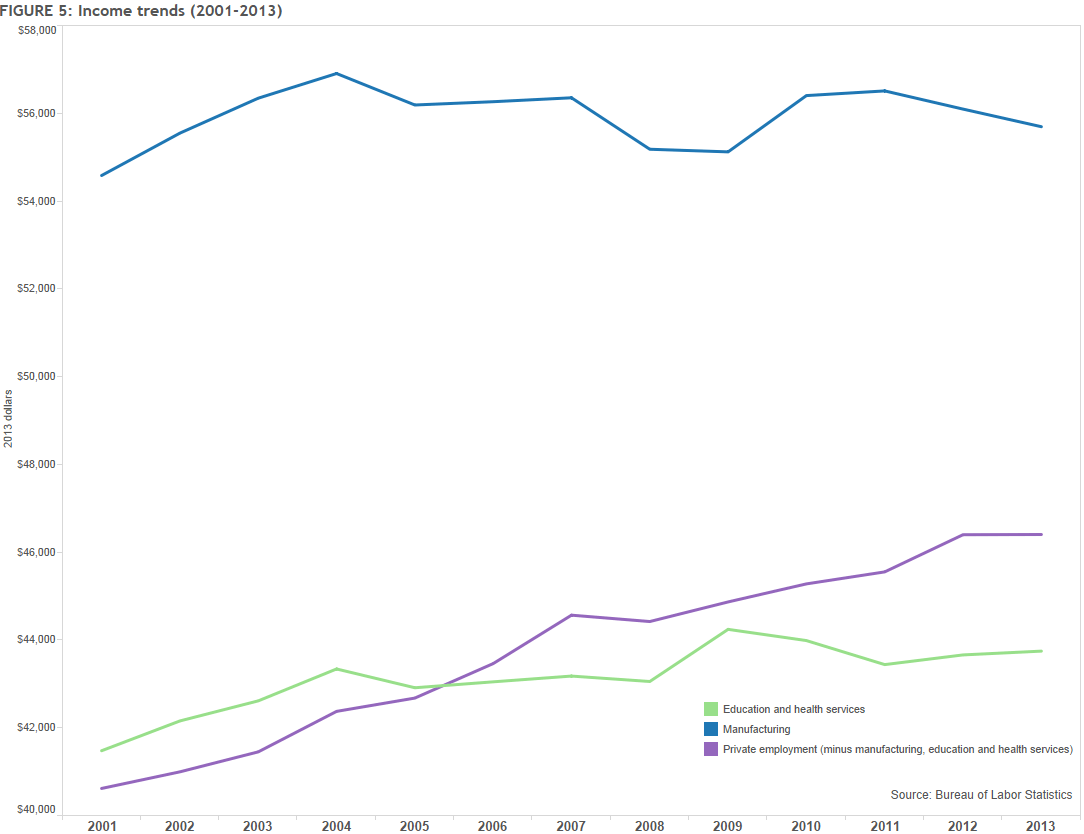
- Figure 5 compares the average annual income in manufacturing, education and health services, and all private sector employment (minus manufacturing, health and education services) in Kentucky, Ohio, Pennsylvania, and West Virginia – the states that make up the Fourth District. The time period is from 2001 to 2013 and the incomes are fixed to 2013 dollars. From 2001 to 2013, income growth in both manufacturing (2 percent) and health and education services (6 percent) has been significantly slower than overall private sector income growth (14 percent).
- One reason could be the prevalence of lower-wage jobs in the health services portion of the sector. According to the Occupational Employment Statistics from the BLS, in 2013 nearly 1/3 of workers in health services earned an average wage of $13.61 per hour, well under the national average of $22.33 for workers across all employment sectors. And in a Brookings Institute report, nearly half of all healthcare employees have less than a bachelor’s degree, which can translate into lower wages. For example, home health aides, which represent a large share of total employment in health services, had a mean hourly wage of $10.54 per hour in 2013, well below the national mean of $22.33 per hour.
For further reading
- Job Polarization and the Great Recession (Federal Reserve Bank of Cleveland)
- STEM and Healthcare Employment Trends in Ohio, Pennsylvania, Kentucky, and West Virginia (Federal Reserve Bank of Cleveland)
- Investing in the Frontlines: Improving Employment Outcomes of Direct caregivers in the Changing Healthcare Industry (part of the Connecting Communities webinar series sponsored by the Federal Reserve System)
- Part of the Solution: Pre-Baccalaureate Healthcare Workers in a Time of Health System Change (Brookings Institution)