

- Share
FHA Lending in Ohio
Recent news articles have carried the worrisome suggestion that Federal Housing Administration (FHA)-insured loans may be "the next subprime." Given the high correlation between subprime lending and foreclosures, which contributed to the recent recession, that's an unsettling premise indeed. There is no doubt that FHA-insured lending has increased recently. There is also evidence of rising delinquencies among these loans. But are FHA-insured loans truly the new subprime? In Ohio, it doesn't appear so. In fact, several findings that emerged from our examination of FHA lending in Ohio point to "no" as the answer.

The views expressed in this report are those of the author(s) and are not necessarily those of the Federal Reserve Bank of Cleveland or the Board of Governors of the Federal Reserve System.
Introduction
Recent news articles have carried the worrisome suggestion that Federal Housing Administration (FHA)-insured loans may be "the next subprime." Given the high correlation between subprime lending and foreclosures, which contributed to the recent recession, that's an unsettling premise indeed. There is no doubt that FHA-insured lending has increased recently. There is also evidence of rising delinquencies among these loans.1 But are FHA-insured loans truly the new subprime? In Ohio, it doesn't appear so. In fact, several findings that emerged from our examination of FHA lending in Ohio point to "no" as the answer.
For one, FHA-insured loans in the state are performing considerably better than subprime loans. Second, FHA borrowers have consistently higher credit scores than subprime borrowers. Lower credit scores, on the other hand, have been linked to defaults. Third, the FHA has never offered mortgages that are interest-only, carry prepayment penalties, or allow no or low documentation - all of which can be features of subprime loans. It's important to note, that current economic conditions such as rising unemployment and shaky housing prices will impact future loan defaults regardless of whether the loan is FHA-insured, prime, or subprime.
In this report, we provide an analysis of FHA lending in Ohio between 2005 and 2008. We found a large increase in the FHA originations in that time period, which corresponds with sizable decreases in both conventional prime loan originations and subprime lending. However, while FHA-insured loans had higher delinquency rates than conventional prime loans, we also found that FHA delinquency rates were considerably lower than those of subprime loans.
History of the FHA Loan
FHA loans are not a new or exotic mortgage product; in fact, they've been around since the 1930s. Prior to the establishment of the Federal Housing Authority, in fact, mortgage loans were quite different from the mortgage loans we know today. They had to be repaid within three to five years; were limited to 50 percent of the property's value; had no amortization; and had a balloon payment due at the end of the term.2 The FHA dramatically changed the mortgage market back then by allowing 20-year and 30-year loan terms that were fully amortized; increasing loan-to-value (LTV) ratios to 80 percent and higher; and, most important, insuring the loans, making them less risky for lenders.3
Created as a response to the housing market collapse in the 1930s, the FHA was established to improve housing standards and conditions; provide adequate home financing through the insurance of mortgage loans; and to stabilize the mortgage market.4 The FHA does not originate or underwrite loans. Rather, the FHA promotes homeownership by insuring mortgages for qualified borrowers, which protects lenders against losses due to defaults. The FHA authorizes certain lenders to be providers on the loans it insures.
In general, the requirements to obtain an FHA loan are less stringent than those needed to qualify for a conventional prime loan and more restrictive than for subprime loans.5 FHA requires a down payment - even if it is as low as 3 1/2 percent. Some subprime loans, on the other hand, allowed zero down. FHA will also qualify borrowers with previous credit issues; a past bankruptcy, for example, is "forgiven" after two years and a foreclosure after three years, provided these borrowers also meet specific credit requirements and debt-to-income ratios.6 Additionally, FHA borrowers pay both an upfront mortgage insurance premium and a monthly insurance premium, which are used to repay lenders if borrowers default. Borrowers of conventional loans, too, must frequently pay monthly private mortgage insurance (PMI) if they intend to finance more than 80 percent of a home's value with a single loan. The difference with FHA loans is that FHA borrowers must pay the monthly insurance premium for at least five years regardless of the LTV.7
Finally, while the FHA loans' more relaxed credit and down payment requirements make them more attainable for low- to moderate-income borrowers, there are no actual income restrictions to qualify for an FHA-insured loan. Some borrowers of these loans are decidedly middle- and upper-income. Recently, under the Housing and Economic Recovery Act (HERA) of 2008, the FHA loan limits were raised on the amount that could be borrowed, allowing homebuyers to apply for FHA loans for higher-priced homes.8
Data and Definitions
This analysis uses data from Lender Processing Services, Inc. Applied Analytics (LPS), formerly known as McDash, and from the Home Mortgage Disclosure Act (HMDA). The proprietary LPS data contain loan level information from nine of the top 10 servicers in the United States and cover approximately 60 percent of the mortgage market.9 These data contain detailed information on mortgages, including loan performance; loan characteristics; and a limited number of borrower and property characteristics. The HMDA data include information on mortgage characteristics, such as loan type and purpose; loan pricing; and some borrower characteristics. We focus our analysis on loans originated from 2005 through 2008, since these years encompass both the height of the mortgage crisis and the current situation. Loans in delinquency are defined as those that are 60 or more days delinquent, those that are in foreclosure, and those that are real estate owned (REO). Unless otherwise noted, LPS data were used for our analysis.
Share of the Originations
From 2005 to the end of 2008, while overall mortgage loan originations in Ohio and the United States fell dramatically, FHA-insured loans remained steady for most of that time before jumping in 2008. These changes in lending activity reflect what was happening in the housing market: It was during this time period that the subprime market collapsed and prime loans became more difficult to obtain due to tightened underwriting standards. The FHA's government-insured loans were a viable and appealing option for borrowers seeking financing for a home and for lenders wanting to bear less risk in this uncertain market.
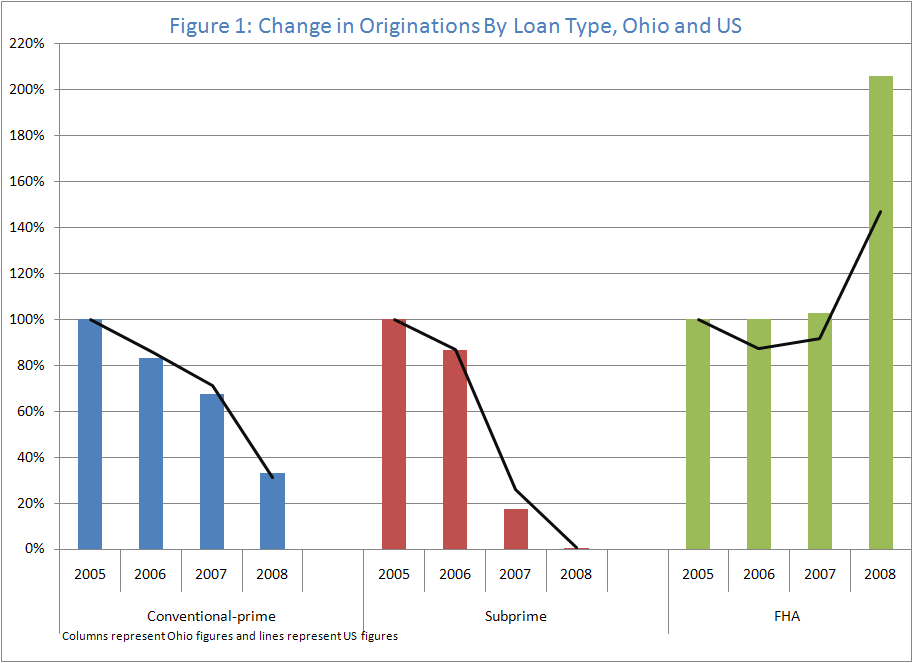
Figure 1 depicts the change in the number of originations in each year as a percent of the 2005 originations for each loan type. Conventional prime loan originations decreased by two-thirds in both Ohio and the nation from 2005 to 2008. These decreases occurred more gradually in both geographies between 2005 and 2007 before dropping sharply from 2007 to 2008. As the chart illustrates, this drop corresponded with the large increase in FHA-insured lending. Subprime originations in 2007 dropped to just 17 percent of the 2005 level in Ohio and to about 26 percent of the 2005 level for the United States before all but disappearing in both geographies by 2008. FHA-insured originations, on the other hand, remained consistent with 2005 levels through 2007 before they more than doubled in Ohio from 2007 to 2008. Nationally, FHA originations that year grew a bit less than in Ohio, increasing by one and a half times the 2005 level.
Figure 1: change in Originations By Loan Type, Ohgio and US
Measuring the Performance of Loans in Ohio
After pointing out some distinction in characteristics between FHA and subprime loans, we now examine their performance to assess whether FHA loans are "the next subprime." To measure the performance of loans, we examine their delinquency rates. We do this in two ways. The first way is to look at the delinquency rates for a specific month or quarter in a year. This measure tells us the percent of outstanding loans that are delinquent at a point in time. In other words, it provides a current snapshot of how the loans are performing.
So, applying this first measure, how do FHA loans in Ohio look? As of the second quarter of 2009, over 13 percent of FHA loans in Ohio were at least 60 days delinquent, a slight increase from a year ago (11 percent). Delinquency rates on subprime loans reached 29 percent in the second quarter of 2009 (up from 24 percent a year ago), which is more than double the FHA loan delinquency rate. By comparison, delinquency rates for conventional prime loans reached nearly 6 percent in the second quarter of 2009 up from a year ago (4 percent).10
A second, less frequently used way to examine loan performance is to look at delinquency rates based on origination year and loan age. This measure shows us, for example, whether loans originated in 2007 are performing better or worse than loans originated in 2008, as well as how loans are performing at different loan ages. Of particular interest is the performance of FHA loans originated in 2007 and 2008 since this is the same time period when FHA loans doubled and subprime disappeared. As noted earlier, FHA-insured loans have performed worse than conventional prime loans, but much better than conventional subprime loans. With some slight year-by-year variations, delinquency rates on subprime loans were two to three times higher than delinquency rates on FHA-insured loans. Figure 2 shows the delinquency rates for FHA originations. As illustrated, delinquency rates are fairly consistent across origination year until about the 10-month mark, when the delinquency rates for loans originated in 2007 appear to diverge from, and rise more steeply, than those originated in the other years. At 12 months, more than 9 percent of the 2007 loans are delinquent compared to 7 percent of the 2005 and 2006 loans. The higher delinquency rates on 2007 originated loans could suggest something about borrower quality during that year. In fact, the median credit score for FHA borrowers was lowest in 2007 across the four years of data we examined.
Figure 2: FHA Delinquency Rates by Origination Year, Ohio
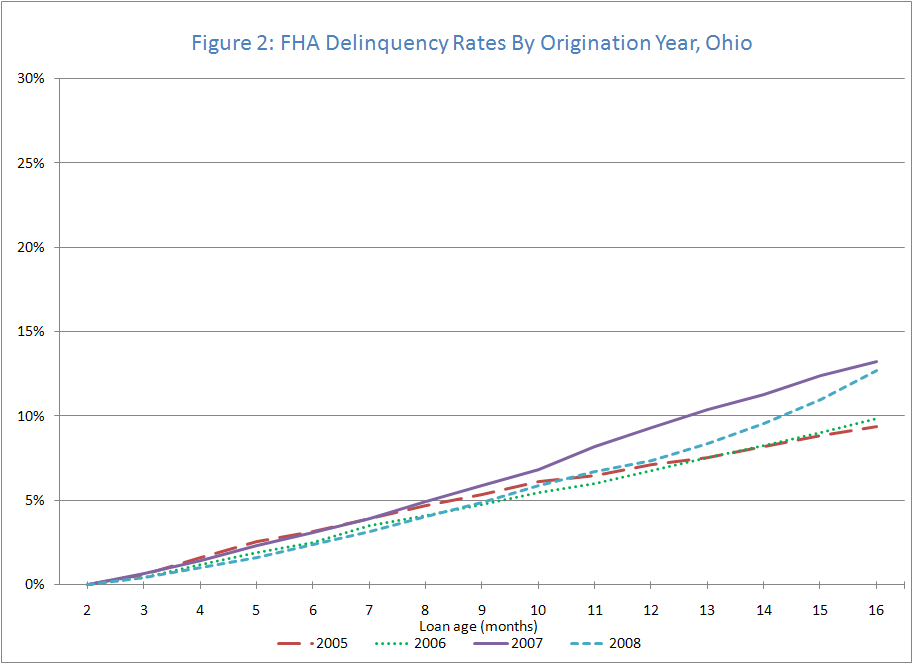
What about loans originated in 2008? Thus far, these loans appear to be performing better than loans originated in 2007. Because the most current month of data available is August 2009, only a portion of the loans originated in 2008 have reached the 12-month mark. Loans originated in December 2008, for example, can at most reach the eight-month mark. At eight months, delinquency rates for FHA loans were very similar across origination year, ranging from 4 percent for loans originated in 2006 and 2008 to 6 percent for loans originated in 2007. Once there is an entire year's worth of the data, we will have a more complete picture of the performance of loans originated in 2008.
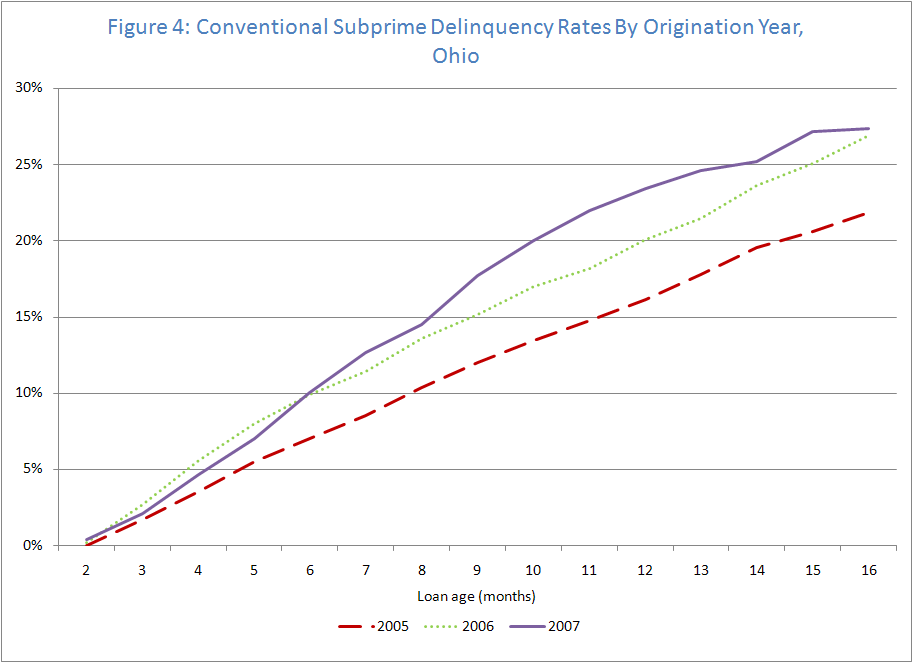
Conventional subprime loans, on the other hand, performed substantially worse than conventional prime (see figure 3) and FHA loans in every year and at every loan age. As shown in figure 4, at six months, subprime delinquency rates are between five and nine times higher than prime loan delinquencies. At 12 months, subprime loans originated in 2007 reached a delinquency rate of 23 percent, compared to 4 percent for prime loans. Clearly, subprime loans have been more problematic than FHA loans over the past several years.
Figure 3: Conventional Prime Delinquency Rates by Origination Year, Ohio
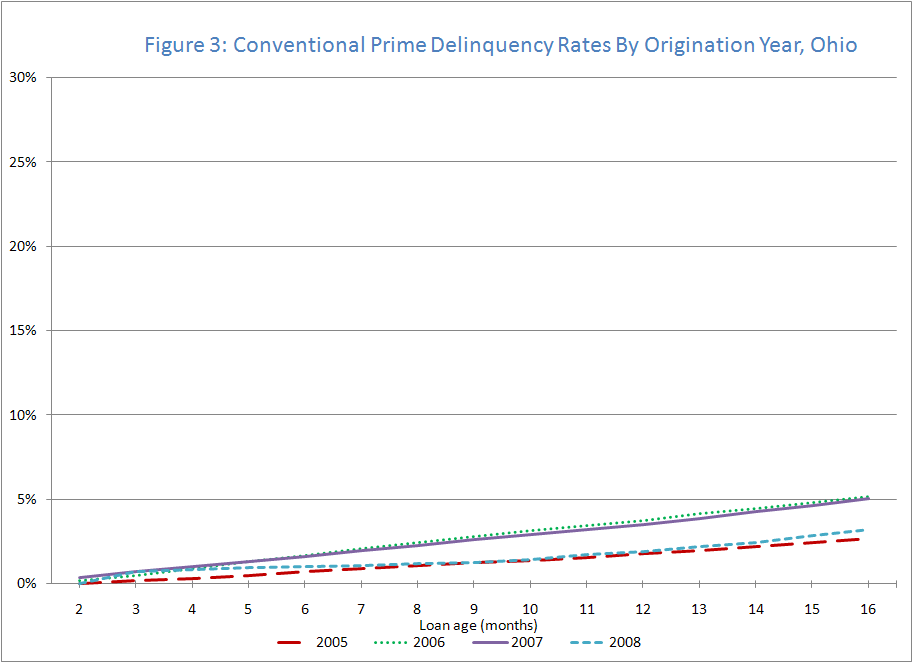
Figure 4: Conventional Subprime Delinquency Rates by Origination Year, Ohio
Who's Providing FHA Loans in Ohio?
Given the large increase in FHA originations since 2007, we wanted to see whether there were increases in the number of FHA lenders and, if so, whether there were shifts in market share among FHA lenders over time. Specifically, we wanted to know whether FHA lending has become more or less concentrated both in terms of who is doing the lending and how much of the FHA lending they are doing. We found little variation in the concentration of FHA originations by lenders. From 2007 to 2008, the number of FHA lenders did increase from 175 to 235. Yet, in both years, eight lenders provided 50 percent of the FHA loans. And these top eight were comprised of the same set of lenders in both years. The top lender in 2007 originated about 11 percent of the loans and in 2008 no lender originated more than 8 percent of the loans.
Borrower and Area Characteristics
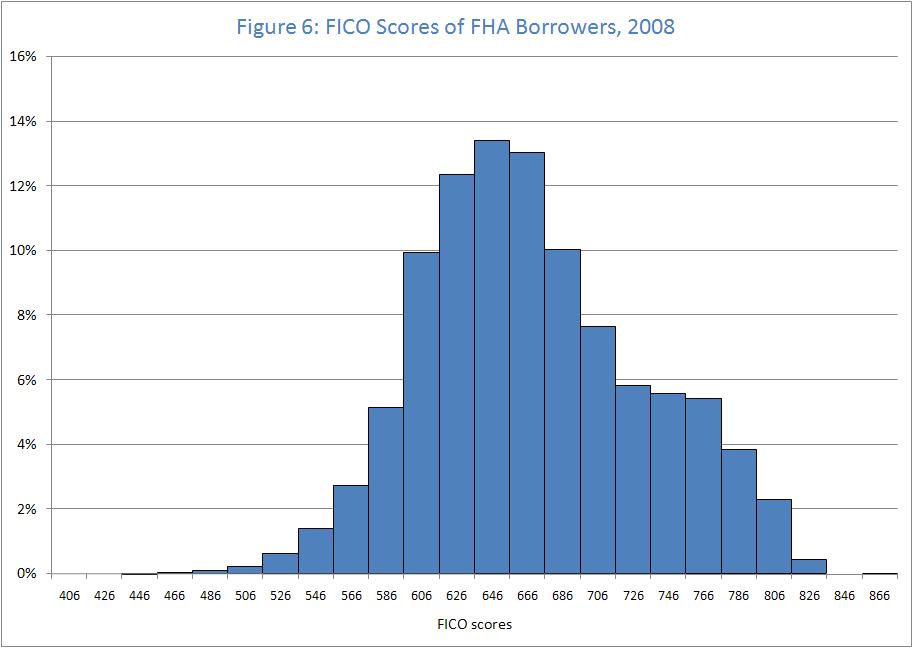
Next we looked at the relationship between credit scores and FHA loans. Credit scores are considered a key factor in determining the probability that a borrower will default: The lower the score, the greater the borrower's risk for default. A FICO score of least 660 is considered to be in the prime loan category and a credit score of below 620 is considered to be in the subprime category.11 So, are FHA borrowers getting more or less risky over time? Based on credit scores, it appears FHA borrowers are getting less risky. Using FICO scores provided in LPS data, we found that borrowers who obtained FHA loans in 2008 had a median credit score of 653, up from 631 in 2005. Credit scores peaked in 2008 for all borrowers, regardless of whether they received an FHA, conventional, or subprime loan. To further examine changes in the FICO scores of FHA borrowers over time, we looked at the distributions of scores in 2007 and 2008 since these correspond with the large increase in FHA lending. Indeed we see more borrowers with higher FICO scores in 2008 (see figures 5 and 6). Yet, this finding is not unique to FHA borrowers. We found this same pattern with regards to conventional prime loans. A larger percentage of prime borrowers in 2008 had higher credit scores when compared to prime borrowers in 2007, likely due in part to the tightening credit markets.12
To further characterize FHA-insured lending in Ohio, we looked for changes in the income of borrowers obtaining these loans as well as in areas where these loans are being originated. Using HMDA data, we found a shift in FHA lending toward both higher-income borrowers and toward borrowers living in higher-income tracts.13 In 2006, about 16 percent of FHA originations were made to high-income borrowers; by 2008 that proportion had increased to 22 percent. FHA lending also increased for borrowers living in high-income tracts, to 24 percent in 2008 compared to 19 percent in 2006. Those comprising a declining share of FHA lending in this time period were moderate-income borrowers (those making between 50 and 80 percent of the area's median family income), whose percentage of FHA originations dipped from 35 percent to 31 percent. The share of FHA lending to borrowers living in moderate-income tracts also dropped, from 18 percent to 14 percent, during this period.
Figure 5: FICO Scores of FHA Borrowers, 2007
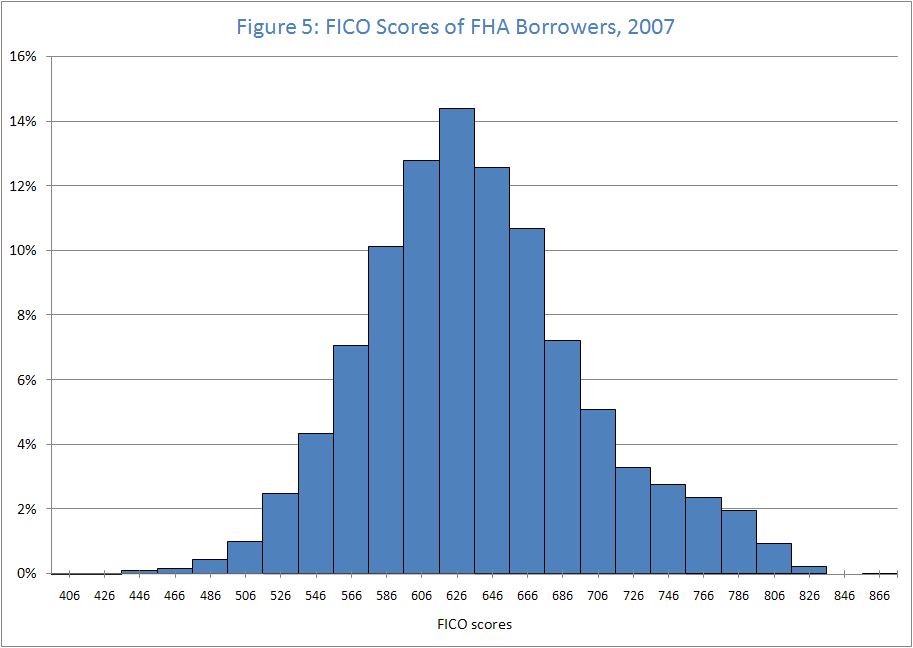
Figure 6: FICO Scores of FHA Borrowers, 2008
The pattern is similar for conventional lending. By 2008, 45 percent of all conventional lending was made to high-income borrowers, up from 37 percent in 2006. Borrowers living in high-income tracts comprised 37 percent of the conventional lending in 2008, versus 30 percent in 2006. Declines occurred in the share of lending to borrowers with incomes in the moderate- and middle-income categories - from 49 percent of all conventional lending in 2006 down to 43 percent by 2008 - and to borrowers living in tracts with these incomes.
Geographic Patterns of Subprime and FHA Orginations
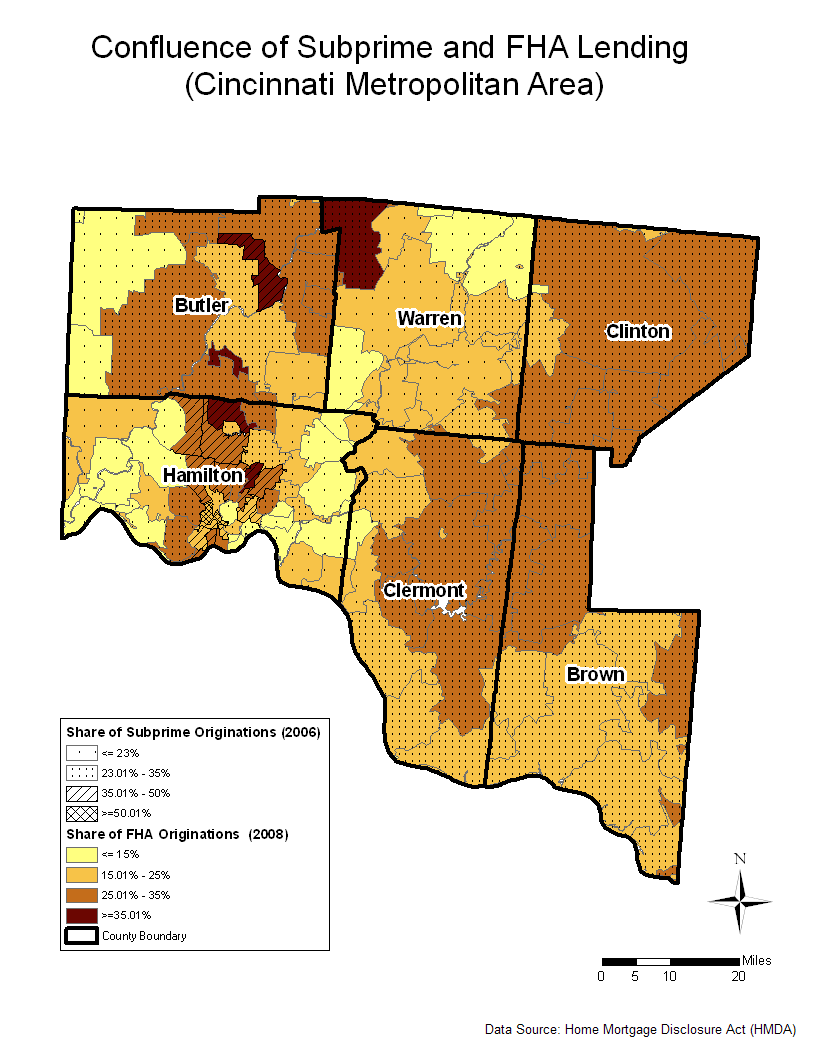
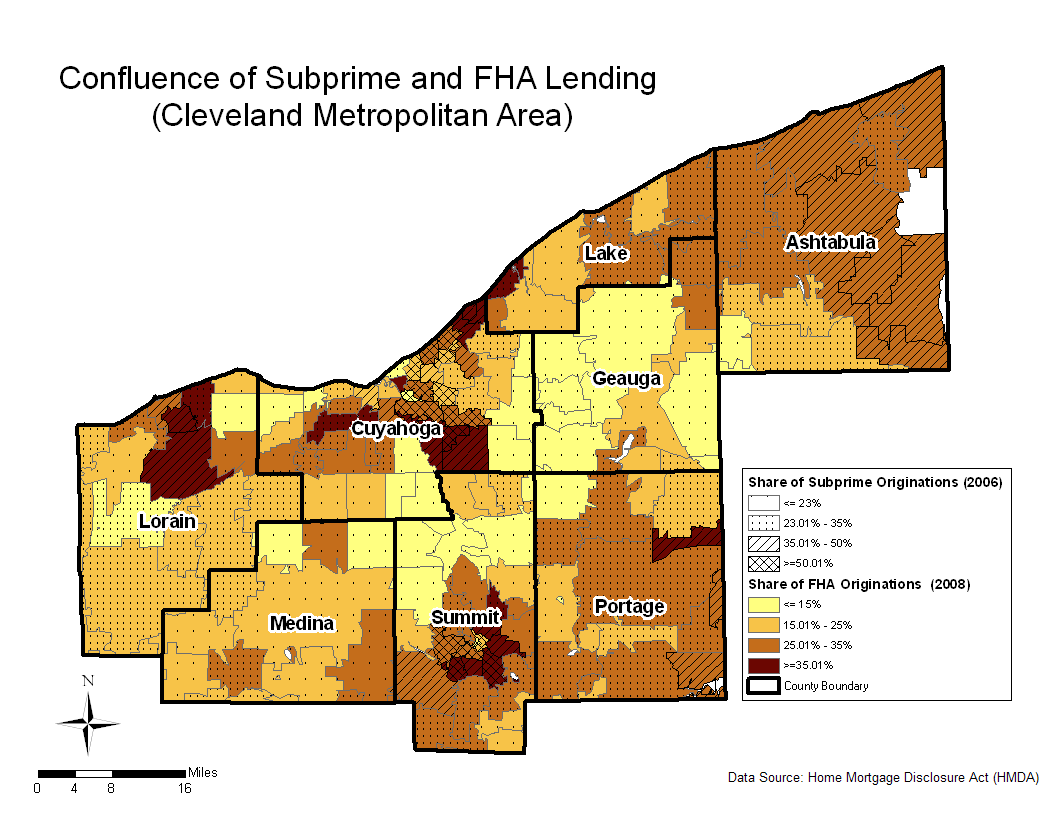
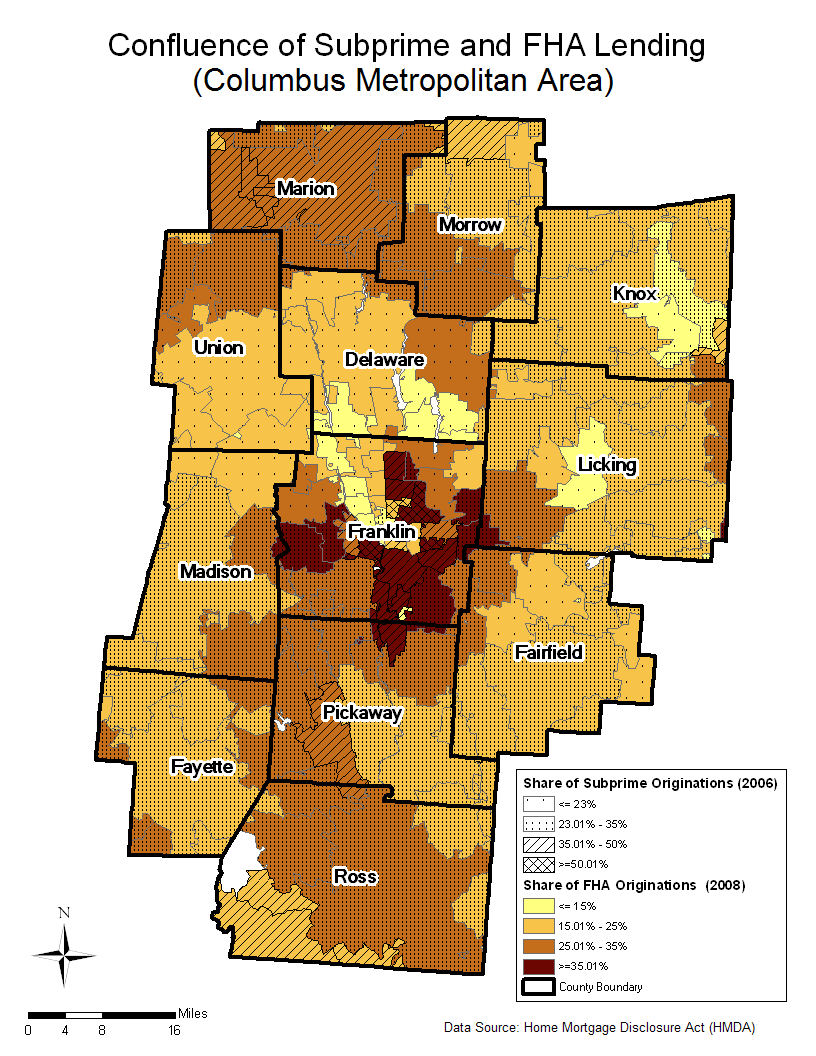
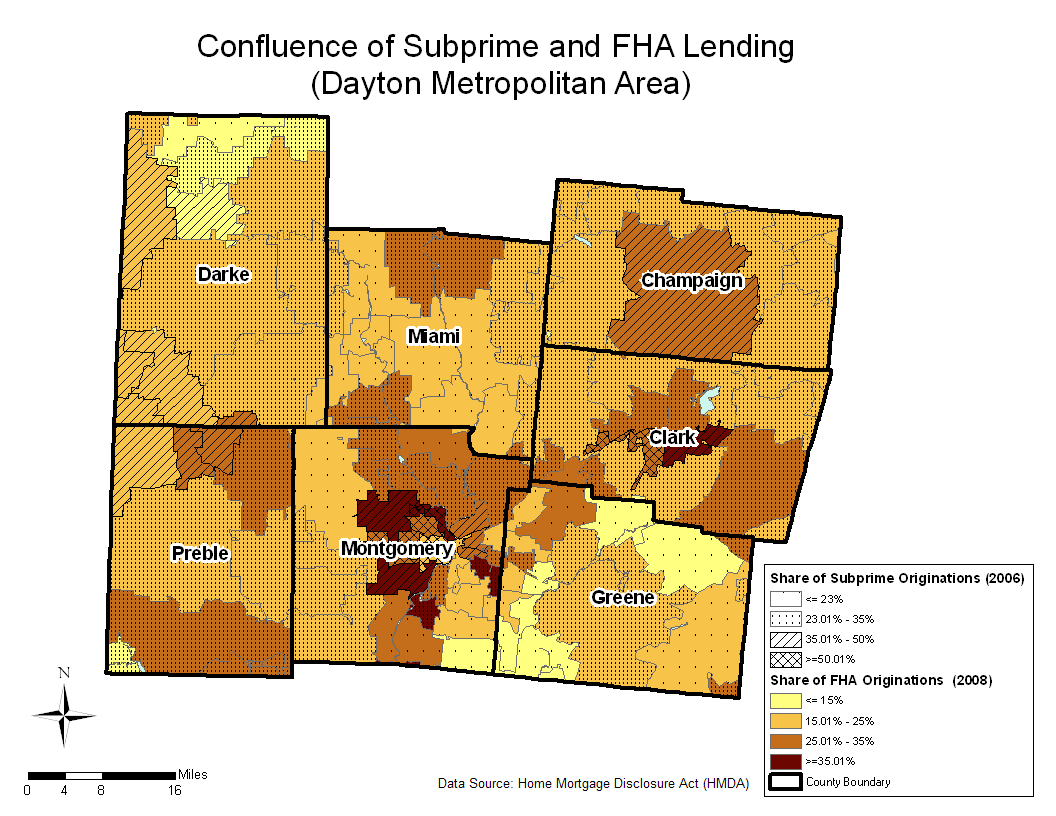
Finally, we looked at the geographic patterns of subprime lending and FHA lending. We were most interested in learning whether areas with higher rates of FHA lending in 2008 correspond with those areas that had higher rates of conventional subprime, or high-cost, lending in 2006.14 More specifically, we wanted to see whether FHA loans are the replacement for what were previously conventional subprime loans. Using the HMDA data, we illustrate the confluence of these two rates in four of Ohio's most populous Consolidated Metropolitan Statistical Areas (CMSAs) - Cleveland, Columbus, Dayton, and Cincinnati.
In Ohio, conventional high-cost originations peaked in 2006 and FHA originations peaked in 2008. Thus we've mapped data from those years only, in order to illustrate those instances where zip codes that had high rates of conventional subprime lending now have high rates of FHA lending. The darker color indicates a higher percentage of FHA-insured originations in 2008. The denser overlay indicates a higher percentage of conventional high-cost originations in 2006.
What is evident from the maps is that where there are areas of overlap, they are concentrated. The highest rates of FHA-insured lending (35 percent or higher) tend to be concentrated mainly within the major cities and counties in each of the metropolitan areas. Although fewer in number, the areas with the highest rates of subprime lending (50 percent or higher) are also concentrated in the urban cores of these areas.
Looking within Cuyahoga County, located in Cleveland's metropolitan area, we see several east side zip codes with subprime lending rates in excess of 50 percent in 2006 (illustrated by the crosshatch pattern), many of which had relatively high rates of FHA lending in 2008. This suggests some substitution of subprime loans by FHA loans. We note a similar pattern of lending in Summit County, specifically in the City of Akron. The convergence of these two lending rates is also seen within each of the metropolitan areas illustrated in the maps: in the urban core of Montgomery County, which is home to Dayton; within Franklin County, home to Columbus; and to a lesser degree in Hamilton County, home to Cincinnati.
Confluence of Subprime and FHA Lending (Cinncinnati Metropolitan Area)
Confluence of Subprime and FHA Lending (Cleveland Metropolitan Area)
Confluence of Subprime and FHA Lending (Columbus Metropolitan Area)
Confluence of Subprime and FHA Lending (Dayton Metropolitan Area)
Is seeing believing? To uncover patterns evident in the maps, we estimated the correlation between rates of subprime lending in 2006 and FHA-insured lending in 2008 at the zip code level.15 Turns out the relationship between these two variables in each of the CMSAs is positive, with correlation coefficients in the moderate range (between .50 and .60). Then we looked at FHA lending in 2008 and prime lending in 2006 and found a negative correlation, suggesting FHA is not playing as big a role in areas with previously high rates of prime loans. These correlations suggest that FHA lending may be substituting for conventional subprime, and not prime, lending.
Conclusion
Our look at FHA lending in Ohio documents the surge in FHA loan originations that occurred hard on the heels of the dramatic decrease in subprime lending. While concern surrounding FHA loans in Ohio was well-placed, given the level of devastation wrought by the collapse of subprime loans, our analysis does not bear out these concerns. In fact, we find little resemblance between the performance of Ohio's FHA-insured loans and subprime loans. Moreover, recent borrowers of FHA-insured loans have better credit scores. We do find some convergence among areas that once had high rates of subprime lending and are now areas with high rates of FHA lending, suggesting FHA may be filling some of the demand for mortgage credit in these areas. However, the current economic conditions could prove problematic for any borrower - regardless of the type of loan - especially if there is a job loss.
Future research could look take a more in-depth look at both borrower and loan characteristics to better explain the differences in default rates among the different loan types. Also, due to the fact that some subprime loans may have refinanced into FHA loans, future analysis could examine the differences in default rates between refinance and purchase loans.
The FHA has been promoting homeownership opportunities for individuals through government-insured loans since the 1930s. Its less restrictive requirements compared to prime loans may be helping to accommodate the demand for mortgages given the collapse of the subprime market and the tightening of credit markets. Because of its important role and increased share of mortgage loans nationwide, it will be important to continue to monitor the performance of these loans into the future.
Footnotes
- Steve Wartenberg and Jill Riepenhoff, "Are FHA loans next big risk?" The Columbus Dispatch, April 12, 2009. Available at www.dispatchpolitics.com/live/content/national_world/stories/2009/04/12/copy/FHA_UPDATE.ART_ART_04-12-09_A1_ABDHFD1.html?sid =101
- Information on FHA history available at www.hud.gov/offices/hsg/fhahistory.cfm.
- Albert Monroe, "How the Federal Housing Administration Affects Homeownership," Working Paper W02-4 (Cambridge: Joint Center for Housing Studies at Harvard, 2002).
- Information on FHA available at www.virtualref.com/govagency/364.htm.
- Monroe, "How the Federal Housing Administration Affects Homeownership."
- Information on FHA requirements available at www.hud.gov/offices/hsg/sfh/faqs/faqsmenu.cfm.
- Only when these two criteria have been met - the FHA loan is a minimum of five years old and the LTV reaches 78 percent or less - can the FHA insurance be cancelled.
- News release announcing increases in FHA loan limits can be found at www.hud.gov/news/release.cfm?content=pr0-174.cfm.
- Lender Processing Services, Inc. Applied Analytics (LPS) data cover about 18 percent of the subprime market nationally.
- Source of these data is the Mortgage Bankers Association (MBA)/Haver Analytics.
- For additional information about credit scores and credit scoring, see www.creditscoring.com/pages/bar.htm.
- Since FICO scores are a relative measure, caution should be used in comparing a score of 660 in one year to a score of 660 in a different year.
- Low income is defined as income that is less than 50 percent of the area's Metropolitan Statistical Area (MSAs) family income. Moderate income is between 50 and 80 percent of an area's family income. Middle income is between 80 and 120 percent of an area's family income. Upper income is defined as income of 120 percent or more of an area's family income.
- High-cost loans are defined as loans whose rates exceed by at least 3 percentage points the difference between the APR on a loan and the rate on Treasury securities of comparable maturity.
- Correlations examine the statistical relationship between two variables and tell us whether the variable moves in the same or a different direction and the strength of the relationship; the closer to 1 or 1 the coefficient is, the stronger the relationship between the two variables. Conversely, the closer the coefficient is to 0 from either direction, the weaker the relationship.