

- Share
How the Pandemic Has Reshaped Economic Inclusion in the United States
The pandemic brought unusually large and novel changes to the US labor market. Some sectors lost half or nearly half of their employment; others moved their workforces to home settings. Some workers lost their jobs, some left their jobs temporarily, and some left the workforce altogether. These changes have affected different demographic groups differently. We investigate how the pandemic affected workers of different ages, racial or ethnic backgrounds, and gender and the degree to which these effects have persisted after a year of recovery.


The views authors express in Economic Commentary are theirs and not necessarily those of the Federal Reserve Bank of Cleveland or the Board of Governors of the Federal Reserve System. The series editor is Tasia Hane. This paper and its data are subject to revision; please visit clevelandfed.org for updates.
The pandemic’s effects on employers and workers have not been evenly distributed. For instance, women have been more affected than men, and more so in this recession than during previous recessions. Front-line workers have been affected differently than those who could easily work from home, yielding some demographic patterns. And although no group was unscathed, Hispanic workers, for example, saw a particularly large drop in their employment-to-population ratio.
Many wondered how long these labor market changes would persist once the pandemic was over—or whether conditions would ever return to what they were. Perhaps businesses might retain the changes they had made when realigning their employment profiles in the face of the pandemic, or maybe women who had left the labor force to provide household support might not be able to easily return. Given the unprecedented size of the shock, many outcomes were possible and the consequences hard to predict.
With a year of improvements in labor market conditions behind us, we can begin to assess the persistence of pandemic-induced shifts in the labor market by demographic group. In this Commentary we examine this question, focusing on movements in the employment-to-population ratio, a measure that summarizes each group’s activity level in the paid labor market. We see three broad patterns in the data for three demographic categories—age, race or ethnicity, and gender. We find that the recovery has been swift for some demographic groups, while others are experiencing more persistent trends that warrant further research.
Employment-to-Population Ratios
To measure the pandemic’s effects on economic inclusion in the labor market, we might compare groups on any number of measures. The most well-known and followed measures of labor market conditions are payroll employment, the unemployment rate, the labor force participation rate, and the employment-to-population ratio. We focus on the employment-to-population ratio because it captures elements of the other measures and can thus summarize each group’s realized engagement in the current labor market. As such, it is a good choice for an initial look at some of the implications of the pandemic on demographic groups.
The employment-to-population ratio is a very simple statistic for measuring how actively engaged a group is in the economy: It is simply the fraction of a set of people who are employed. While simple, it allows for comparisons across distinct demographic groups of the degree to which they are actively engaged in the paid economy. The pandemic shook up the labor market and brought unusually large changes in employment-to-population ratios. Following this large shock, it is useful to examine the size of the shock and how temporary or persistent the shock has proven to be for any given demographic group. To dig a little deeper into the changes, a group’s employment-to-population ratio can be split into changes in the group’s unemployment rates and changes in the group’s labor force participation rates. Because people who are unemployed are typically actively looking for employment, that part of the change tends to be less persistent than the part of the change associated with lower labor force participation rates.
For our analysis, we explore trends in the employment-to-population ratios for three demographic categories: age, race or ethnicity, and gender. The age groups we consider are 16–19, 20–24, 25–34, 35–44, 45–54, 55–64, and 65 and older; the racial and ethnic groups are Asian, Black, Hispanic, and white; and the gender groups are women and men. When examining differences by racial and ethnic groups and gender, we also break the data down by age.
Some important differences and common patterns are observed in the employment-to-population ratios across these different demographic groups over time and in response to the pandemic. To illustrate, consider figure 1, which shows the employment-to-population ratios by age group since 2000. First, we see that employment-to-population ratios by age group are fairly constant over time, although the ratios tend to be procyclical in the sense that the fraction of the working-age population that is employed generally rises during expansions for most age groups. Next, we observe that wide differentials exist between distinct age groups. Finally, we see the unique impact of the pandemic: Not only was the shock to each group’s employment-to-population ratio greater than in past recessions, movements in the ratios were far larger for some groups than for others. While we do not show the historical ratios for race or ethnicity and gender, the pattern of the slowly adjusting series being abruptly altered by the pandemic and continuing to adjust distinctly for the different groups is the same for both demographic categories.
Figure 1. Changes in Employment-to-Population Ratios by Age Group
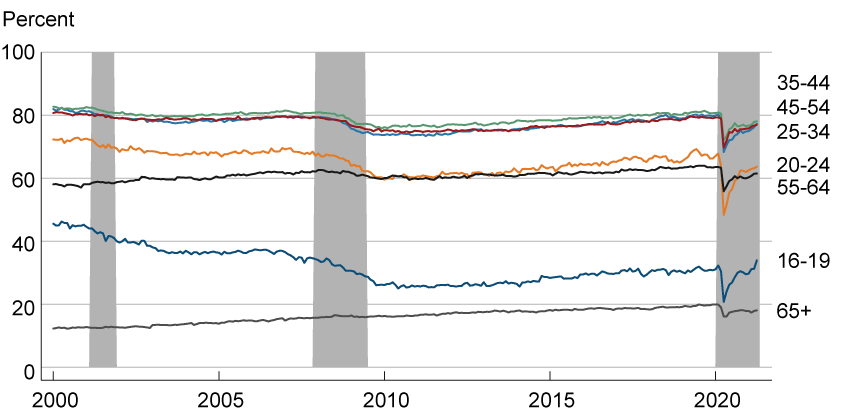
Note: Shaded bars indicate recessions. The Business Cycle Dating Committee of the National Bureau of Economic Research has determined that the business cycle peak occurred in the US economy in February 2020 but has not yet determined if the recession has ended.
Source: Bureau of Labor Statistics, retrieved by Haver Analytics; seasonal adjustment by Haver Analytics.
Shift 1: Pandemic Losses Were Larger for Young Workers, but the Recovery Has Been Strongest for Teenagers
We next explore the size of the initial labor market losses and how much of these losses have been recovered over the last 12 months by group. To do so, we plot the decline in employment-to-population ratios from April 2019 to April 2020 by group along with the portion of the decline that has been recovered as of April 2021. Figure 2 shows the data for age groups. The sum of the two bars for each age group indicates the size of the loss during the pandemic (April 2019 to April 2020), the dark blue bar shows how much of that loss was recovered by April 2021, the light blue bar shows the unrecovered portion, and the green bar shows any gain above what was lost during the pandemic.1 We make the year-over-year comparison to avoid seasonal patterns in the data, but most of the changes occurred in just a couple of months, as shown in figure 1.2 As a reference point, April 2019 represents a time when the labor market was relatively strong. The unemployment rate was low, and the national employment-to-population ratio was near its cyclical high.
Figure 2. Pandemic Losses in Employment-to-Population Ratios by Age Group
and Portion Recovered since April 2020
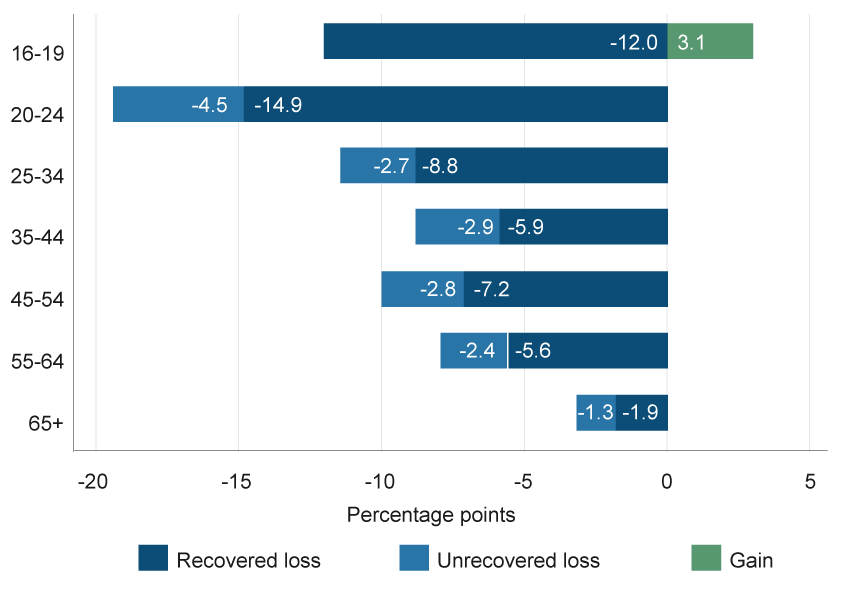
Notes: Losses and gains in employment-to-population ratios (E/P) were calculated as follows. Loss during the pandemic is E/P in April 2020 – E/P in April 2019; recovered loss is E/P in April 2021 – E/P in April 2020; unrecovered loss is E/P in April 2021 – E/P in April 2019. The 2021–2019 difference is less than the loss during the pandemic for all groups except those aged 16–19; that difference exceeds that group’s loss during the pandemic, and the excess above the loss is labeled a gain.
Source: Authors’ calculations based on Bureau of Labor Statistics data, retrieved by Haver Analytics.
Looking at figure 2, we see that despite a higher risk of severe illness when exposed to COVID-19, older workers (65+) had the smallest change in employment-to-population ratios during the pandemic. After a year’s recovery from the pandemic, the fraction of this age group that is working is only slightly lower than before the pandemic (−1.3 percentage points). We might have expected the pandemic’s effects to be largest among older workers or among age groups more likely to have children at home. Instead, both the largest decline and the largest remaining loss are among the 20–24 age group. As of April 2021, this group has recovered 14.9 percentage points of the19.4 percentage point decline it sustained during the pandemic, leaving a gap of 4.5 percentage points. The age groups with the next largest pandemic declines were25–34 years old (−11.5 percentage points) and 16–19 years old (−8.9 percentage points).
The losses among younger workers, and to a large extent their sharp recovery since April 2020, substantially reflects the concentration of the young in certain sectors: accommodation and food services; arts, entertainment, and recreation services; and retail trade. In 2020, 65 percent of employed 16- to 19-year-olds and 35 percent of employed 20- to 24-year-olds were employed in these three sectors. No other age group is more concentrated in these sectors, which together represent 18 percent of total employment nationally.
These three sectors were hard hit by the pandemic: From April 2019 to April 2020, arts, entertainment, and recreation services lost 52 percent of its employment; accommodation and food services lost 47 percent; and retail trade lost15 percent. Since April 2020, all of these sectors have recovered substantial amounts of the lost employment, but their employment levels remain below their 2019 levels: Arts, entertainment, and recreation services is still down22 percent; accommodation and food services is down13 percent; and retail trade employment is down3 percent from prepandemic levels. While some changes in these industries may be persistent, improvement is likely as vaccination rates rise and pandemic restrictions are lifted. Even with continued job losses in these sectors, the employment-to-population ratio for 16 to 19 year-olds has recovered fully; it is now 3.1 percentage points higher than it was before the pandemic and 12.0 percentage points higher than in April 2020.
Beyond the youngest workers, all other age groups still have unrecovered losses in their employment-to-population ratios. Given that employment levels have been recovering over the past year, it is worthwhile to examine how many of these unrecovered losses in employment-to-population ratios might reflect a reduced preference to work. To do that, we look more closely at the two underlying drivers of the employment-to-population ratio, the unemployment rate and the labor force participation rate. We calculate how much any changes in those two factors have contributed to the change in the employment-to-population ratio. The distinction between “unemployment” and “out the labor force” is important because those who are reported as unemployed are more likely to return to work shortly. Those who are out of the labor force may return to employment, too, but are significantly less likely to become employed in the short run.
Figure 3 shows that most of the unrecovered decline in the employment-to-population ratios between 2019 and 2021 for these age groups (with the exception of 16–19 and 65+) stems from an increased unemployment rate.3 The fact that these workers are actively searching for work supports a high likelihood of finding work and returning as the economy continues to recover. That said, the fact that most age groups still have unrecovered losses in their employment-to-population ratios associated with being out of the labor force indicates that there may be other activities such as caring for family members, attending school, and retirements that may more persistently reduce the fraction of the population working within these age categories. The declines in employment-to-population ratios caused by workers leaving the labor force are likely to be more persistent than if they were primarily the result of changes in unemployment. Workers can transition from out of the labor force to employment, too, but transition rates for many categories of people out of the labor force are low (Hornstein et al., 2014).
Figure 3. Sources of Change in Employment-to-Population Ratio
after Recovery by Age Group
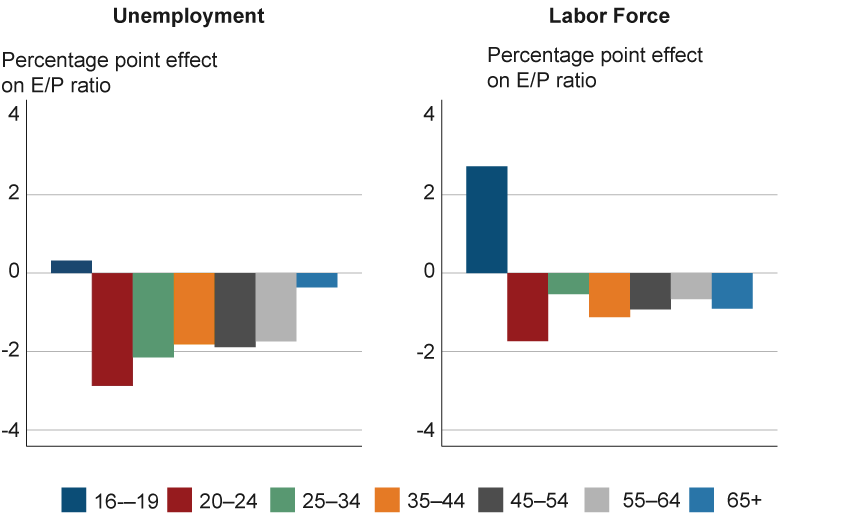
Note: The change in the employment-to-population ratio is the difference in the ratio between April 2021 and April 2019.
Source: Authors’ calculations based on Bureau of Labor Statistics data, retrieved by Haver Analytics.
Shift 2: The Pandemic’s Residual Effects Remain Larger for Hispanic and Black Workers
Next, we examine how the pandemic has impacted employment-to-population ratios by race and ethnicity. Racial (and gender) differences in employment-to-population are dampened by including people over the age of 65, who have a substantially lower employment-to-population ratios. So for this analysis, we focus on differences in the working-age population, ages 16–64. Figure 4 shows the declines in employment-to-population ratios and the portions recovered since April 2020 by race and ethnicity. Following Census procedures, Hispanic individuals can be of any race, so while they are reported on their own, they are also implicitly included in Black, Asian, and white racial groups. Still, given their distinct outcomes in the labor market, it is worthwhile to include a Hispanic category.
Figure 4. Pandemic Losses in Employment-to-Population Ratios by Racial or Ethnic Group,
Ages 16–64, and Portion Recovered since April 2020
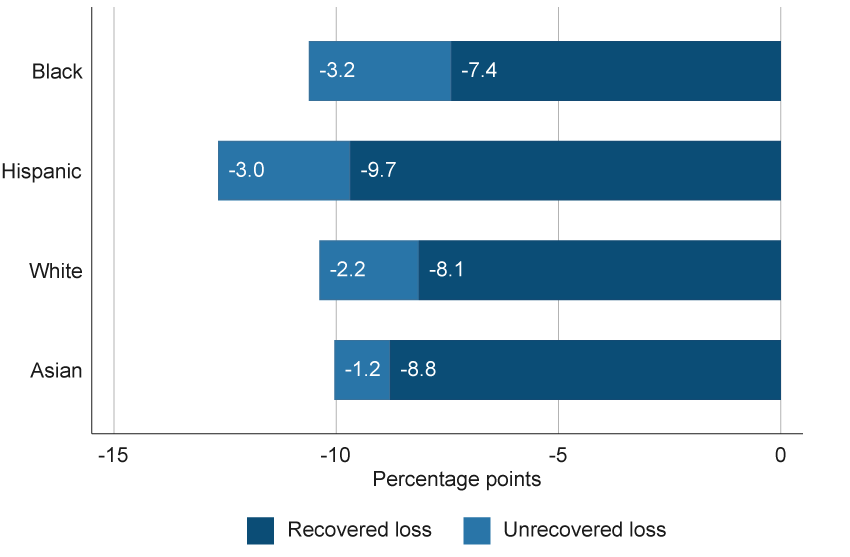
Note: See figure 2 note for how losses are calculated.
Source: Authors’ calculations based on Bureau of Labor Statistics data, retrieved by Haver Analytics.
The pandemic reduced each group’s employment-to-population ratio by more than 10 percentage points. This is an immense, economy-wide pull back in employment. While the challenges were shared across racial and ethnic groups, Hispanic workers saw the largest reduction at 12.7 percentage points. Hispanic workers have notable concentrations in sectors that were greatly affected by the pandemic: construction (−13 percent from April 2019 to April 2020) and accommodation and food services (−47 percent).
Since April 2020, employment gains have been strongest for Hispanic and Asian workers, a trend that has left some large differences by race and ethnicity in the recovery of prepandemic employment-to-population ratios. The sectors in which Hispanic workers are concentrated include some that bounced back rapidly: accommodation and food services and construction. Asian workers are concentrated in professional and technical services and finance and insurance services, both of which have fully recovered the employment lost between April 2019 and April 2020. The recovery in employment-to-population ratios has been particularly weak for Black workers; this group is still down more than 3 percentage points below its prepandemic level even after a year of recovery. Black workers are relatively concentrated in public administration (which is still weak); and transportation and warehousing (which has returned to growth but is still weak in several categories in which Black workers have concentrations).
Unemployment rates were a key factor in the declines in the employment-to-population ratio of all racial and ethnic groups. Between April 2019 and April 2020, the unemployment rate for those ages 16 to 64 increased by more than 11 percentage points for all groups and as much as 14.7 percentage points for Hispanic workers. Despite a sharp recovery in unemployment rates between 2020 and 2021, unemployment rates remain higher than before the pandemic, contributing more than a 2 percentage point decline in Black, Hispanic, and Asian employment-to-population ratios (figure 5). In contrast, there are very different movements in the labor force participation rate by race or ethnicity. The Asian labor force participation rate accounts for more than a 1 percentage point increase in the group’s employment-to-population ratio. Black workers have seen the largest decline in their participation rate. This trend should be an area of further analysis because it may suggest more permanent labor market setbacks.
Figure 5. Sources of Change in Employment-to-Population Ratio
after Recovery by Racial or Ethnic Group, Ages 16–64
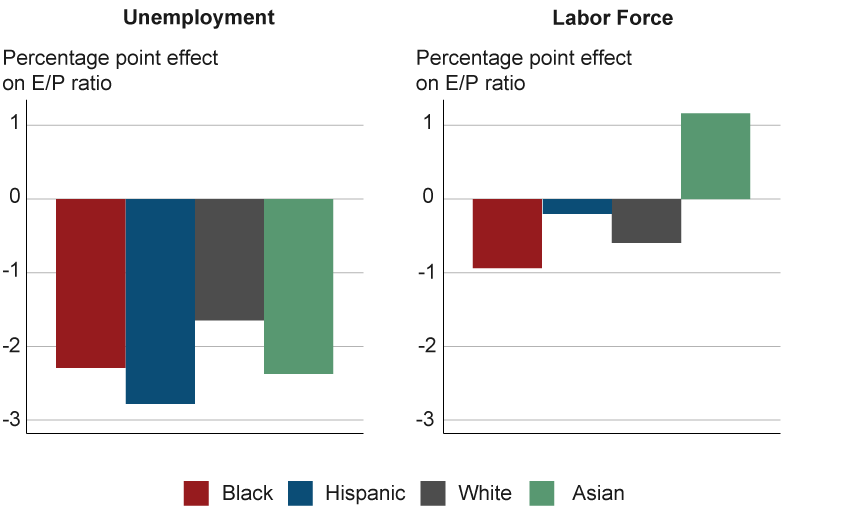
Note: The change in the employment-to-population ratio is the difference in the ratio between April 2021 and April 2019.
Source: Authors’ calculations based on Bureau of Labor Statistics data, retrieved by Haver Analytics.
Shift 3: Women’s Employment-to-Population Ratios Fell Broadly in the Pandemic but Have Recovered Well
As media reports have noted, women were more impacted in this recession than is typical. Their employment-to-population ratios fell more than 10 percentage points from April 2019 to April 2020, more than three times the loss during any past recession. But women’s postpandemic recovery in their employment-to-population ratio is more than 1 percentage point ahead of men’s, a figure that represents roughly 1 million more women returning to work than men (figure 6). This finding implies that women’s labor market outcomes were less persistently altered by the pandemic than men’s, but it is important to recognize that this pattern is not even across race or ethnicity.
Figure 6. Pandemic Losses in Employment-to-Population Ratios by Gender Group,
Ages 16–64, and Portion Recovered since April 2020
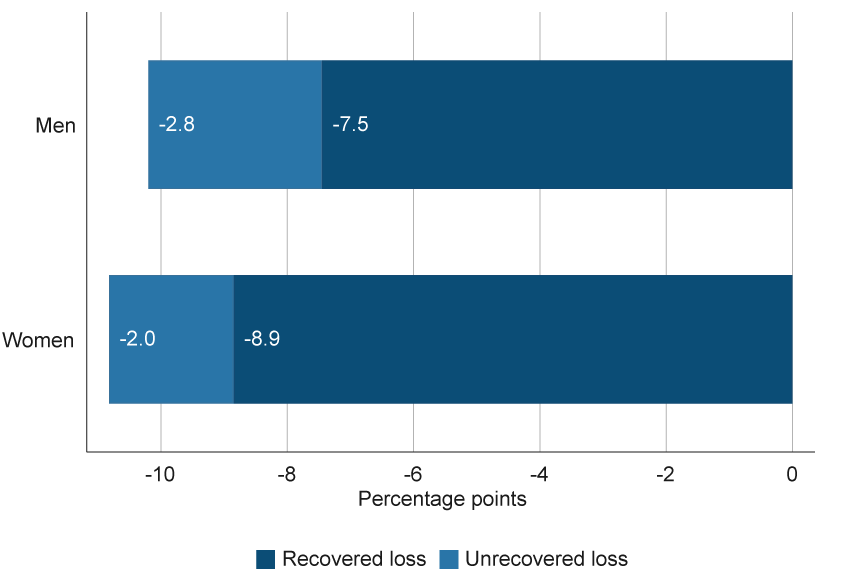
Note: See figure 2 note for how losses are calculated.
Source: Authors’ calculations based on Bureau of Labor Statistics data, retrieved by Haver Analytics.
Figure 7 shows the change in men’s and women’s employment-to-population ratios during the pandemic by race and ethnicity and the portions recovered in the past year. The initially larger effects of the pandemic on women are apparent primarily for white women. Black and Asian women saw slightly smaller impacts than Black and Asian men, while Hispanic women saw only a little higher initial effect than Hispanic men. The greater recovery for women is again a phenomenon primarily experienced by white women, who saw a 9.0 percentage point recovery versus 7.2 for white men. Overall, men and women experienced similar shocks and recoveries with the exception of whites.
Figure 7. Pandemic Losses in Employment-to-Population Ratios
by Gender and Racial or Ethnic Group, Ages 16–64,
and Portion Recovered since April 2020
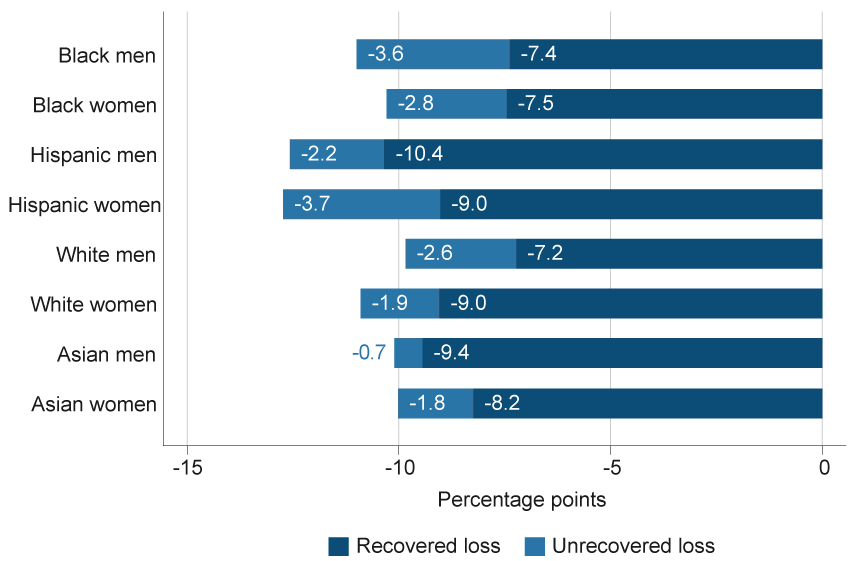
Note: See figure 2 note for how losses are calculated.
Source: Authors’ calculations based on Bureau of Labor Statistics data, retrieved by Haver Analytics.
Looking at the breakdown between unemployment and out-of-the-labor-market effects (figure 8), the improvement in labor market outcome of white women relative to white men is mostly as a result of a lower unemployment rate than men, but white women’s labor market participation rate has also recovered more than white men’s.
Figure 8. Sources of Change in Employment-to-Population Ratio
after Recovery by Gender and Racial or Ethnic Groups, Ages 16–64
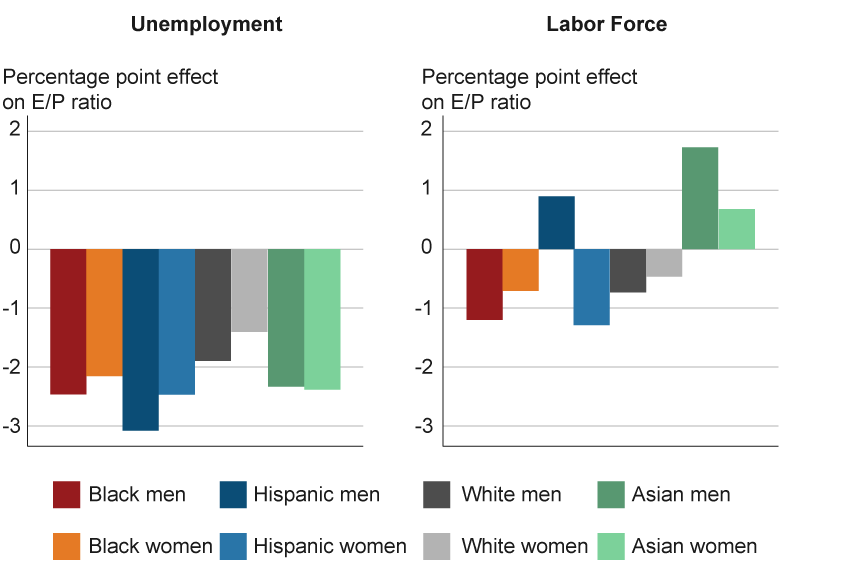
Note: The change in the employment-to-population ratio is the difference in the ratio between April 2021 and April 2019.
Source: Authors’ calculations based on Bureau of Labor Statistics data, retrieved by Haver Analytics.
Other racial and ethnic groups also see notable differences by gender. Black men have seen a larger drop in labor force participation than Black women. In contrast, labor market participation has recovered better for Hispanic and Asian men relative to their female counterparts. This is again an area in which more analysis would be valuable because these uneven drops and recoveries may indicate more persistent changes.
Conclusion
The patterns shown in this Commentary are a first look at some of the pandemic’s impacts on economic inclusion across demographic groups. Differences in how the recovery has progressed across demographic groups, in combination with the size of the shock, have determined the degree to which different groups have been impacted. The patterns we observe could change as the economy continues to open up and to adapt to changes made during the pandemic, but so far the pandemic’s effects on the labor market continue to be uneven. Importantly, in many cases the differences across groups are shrinking as the recovery has continued. We expect to see these patterns evolve as the economy continues its recovery, but there have been notable differences in the experiences of demographic groups for which more research may be warranted.
Footnotes
- While population growth and demographic changes gradually affect these numbers, over this two-year period most of the changes that we identify are the result of the pandemic and the recovery of the labor market. Return to 1
- Some of the series we include are not available from the BLS with seasonal adjustment. In addition, the seasonal patterns may be altered by the large changes seen in the series. Focusing on comparisons of April data in 2019, 2020, and 2021 provides a simple form of seasonal adjustment. Return to 2
- The decomposition of the change in the employment-to-population ratio (Δer) from the change in the unemployment rate (Δur) and the change in the participation rate (Δpr) is as follows:
Δer = (1 − ur1) × Δpr − 0.5(Δur × Δpr) − 0.5(Δur × Δpr) − (Δur × pr1).
The first two terms are the participation rate effects, and the last two terms are the unemployment rate effects. Return to 3
References
- Hornstein, Andreas, Marianna Kudlyak, Fabian Lange, and Tim Sablik. 2014. “Does the Unemployment Rate Really Overstate Labor Market Recovery?” Federal Reserve Bank of Richmond, Economic Brief, No. 14-06. https://www.richmondfed.org/publications/research/economic_brief/2014/eb_14-06.
Suggested Citation
Schweitzer, Mark E., and Emily Dohrman. 2021. “How the Pandemic Has Reshaped Economic Inclusion in the United States.” Federal Reserve Bank of Cleveland, Economic Commentary 2021-14. https://doi.org/10.26509/frbc-ec-202114
This work by Federal Reserve Bank of Cleveland is licensed under Creative Commons Attribution-NonCommercial 4.0 International

