

- Share
Interest Rate Risk and Rising Maturities
Banks have been steadily increasing their exposure to interest rate risk since the end of the financial crisis, though large and small banks are doing so in different ways. This Commentary examines the maturity structure of assets and liabilities to identify the underlying factors responsible for the rise in interest rate risk and the differences between large and small banks.
The views authors express in Economic Commentary are theirs and not necessarily those of the Federal Reserve Bank of Cleveland or the Board of Governors of the Federal Reserve System. The series editor is Tasia Hane. This paper and its data are subject to revision; please visit clevelandfed.org for updates.
Banks cannot avoid exposure to interest rate risk. A mismatch between the maturity structure of bank assets and liabilities lies at the heart of banking—banks loan money out for long periods, yet they finance those loans with short-term borrowing such as demand deposits. If rates fluctuate unexpectedly, banks can lose money. Managing the interest rate risk inherent in this mismatch is critical to bank survival.
Since the end of the financial crisis, banks have been steadily increasing their exposure to interest rate risk. Aggregate interest rate risk is now almost back to its pre-recession level, and the increase has been widespread, occurring at banks both large and small (Bednar and Elamin 2014). Bank regulators watch interest rate risk carefully, because interest rate spikes can cause damage to the entire financial system if banks are overexposed, as happened in the 1980s with the savings and loan crisis.
This Commentary examines the maturity structure of assets and liabilities to identify the underlying factors responsible for the recent rise in interest rate risk. The analysis identifies a common factor on the liabilities side of the balance sheet of large and small banks, but finds significant differences on the asset side. Interest rate risk has risen well past pre-recession levels at small banks, and the increased exposure comes from a dramatic increase in the maturities of their assets, both loans and securities. At big banks, interest rate risk has not yet reached pre-recession levels, and only a slight uptick in the maturity of loans and securities has occurred. Meanwhile, for both large and small banks, the maturities of liabilities have gotten shorter. The combination of increasing asset maturities and declining liability maturities is what is causing the big spike in interest rate risk at small banks.
Interest Rate Risk at Small Banks
This analysis uses data from Call Reports, financial statements that banks are required to file. We focus on US domestic commercial banks, dividing them into two groups: big banks and small banks. Big banks are the top 50 banks in terms of asset size in any reporting quarter. Small banks are the remaining banks. The data do not include information on the nonbank entities of bank holding companies or derivative positions.
Small banks have experienced a big spike in interest rate risk since 2009 (Bednar and Elamin 2014). Both sides of the balance sheet, assets and liabilities, increased the exposure to interest rate risk. The spike in exposure on the asset side is coming from an increased exposure in both securities and loans.
We explore two explanations for this spike. One is that small banks may simply have increased their holdings (as a percentage of total assets) of loans or securities, which would register as an increased exposure. Another is that the maturity structure of loans or securities may have changed toward those maturing over longer periods. Of course, both of these explanations could be true at the same time.
Figure 1 gives a bird’s eye view of the maturity structure of assets (loans and securities) over time at small banks. Assets are divided into four categories of maturity, and the maturity of each is plotted as a percentage of total assets. Around mid-2007, at the onset of the crisis, we see a big spike in small bank holdings of assets maturing in over five years, from around 15 percent of total assets to almost 30 percent in the last quarter.
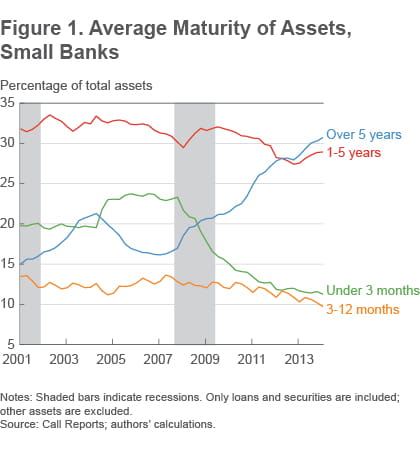
Notes: Shaded bars indicate recessions. Only loans and securities are included; other assets are excluded.
Source: call Reports; authors' calculations.
This increase is accompanied by a big decline in holdings of assets maturing in less than three months, and smaller declines in assets maturing in three months to a year and between one and five years. This shows that small banks have become more exposed to assets that have a longer maturity. These assets are generally riskier and more exposed to interest rate risk.
Figure 2 shows the volume of loan and security holdings at small banks since 2001. We see that loans and securities as a percentage of total assets have stayed almost constant since the crisis. Loans have declined slightly, and securities have increased slightly. (These series do not sum to 100 percent because of other items that enter total assets, like cash and some other intangibles.) Figure 2 shows that the spike in interest rate risk at small banks is not explained by an increase in loan and security holdings.
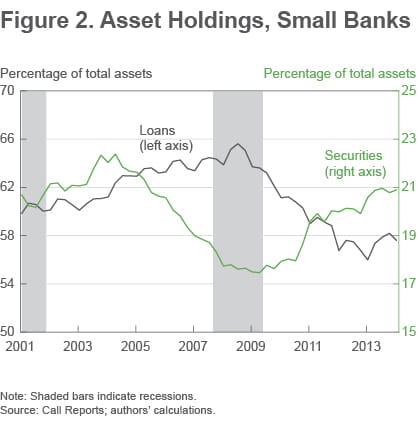
Note: Shaded bars indicate recessions.
Source: Call Reports; authors' calculations.
To investigate whether a changing maturity structure is responsible for the rise in risk, we divide loans and securities into the same four categories of maturity used above. Figure 3 plots holdings of loans at these different maturities since 2001 and shows that the main driver for the increased contribution of loans to interest rate risk after the crisis comes from the fact that small banks have been substituting loans that mature in more than five years for loans that mature in less than three months. In addition to the increased interest rate risk inherent in this substitution (because longer-maturity loans are more sensitive to interest rates), it is worth noting that this might pose some liquidity risk as well.
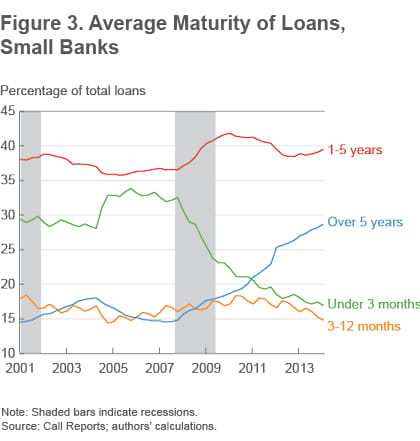
Note: Shaded bars indicate recessions.
Source: Call Reports; authors' calculations.
Similarly on the securities side, the main driver of the increased contribution of securities to interest rate risk comes from an increase in small banks’ holdings of securities maturing in more than five years (figure 4). On top of the interest rate risk in this kind of substitution, the liquidity risk inherent in longer-maturity securities is pronounced. Because they are more sensitive to a spike in interest rates, they provide a less stable cushion against the immediate liquidity needs of banks.
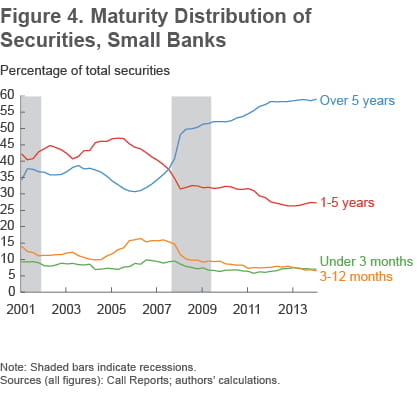
Note: Shaded bars indicate recessions.
Sources (all figures): Call Reports; authors' calculations.
Concurrent with the lengthening of maturities on the asset side of the balance sheet at small banks there has been a shortening on the liabilities side (figure 5). Small banks have been relying more on liabilities that mature in less than three months at the expense of liabilities than mature between three months and one year. Arguably, those two sources of funds are comparable, but once combined with the rising maturity of assets, the declining maturity on the liabilities side becomes a bigger threat. This increasing mismatch is what is driving the rise in interest rate risk at the small banks.
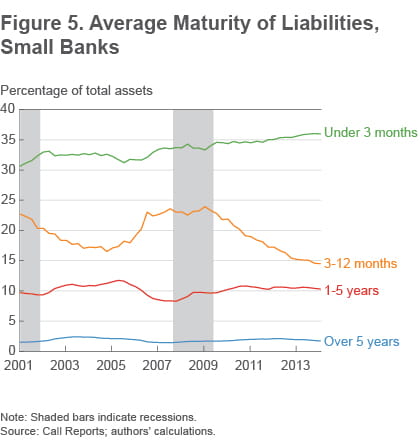
Note: Shaded bars indicate recessions.
Source: Call Reports; authors' calculations.
Big Banks
Interest rate risk at big banks spiked before the financial crisis but fell once it hit. Since 2011, interest rate risk at the big banks has reversed course again and been on an upward trend (Bednar and Elamin 2014). The asset side of big banks’ balance sheets seems to have leveled off in terms of interest rate risk, but that impression is the net effect of opposing trends in loans and securities: risk from loans fell while risk from securities increased. Exposure to interest rate risk has also increased on the liabilities side of the big banks’ balance sheets, with the pickup starting around 2010 and continuing to date.
Figure 6 shows the asset maturity structure of the big banks, with assets divided into the four categories of maturity. We can see that assets that mature in more than five years are displacing assets that mature between three months and a year.
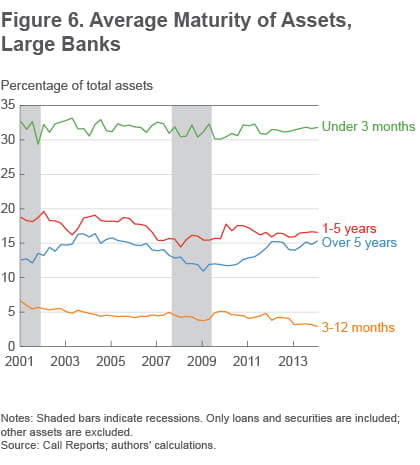
Notes: Shaded bars indicate recessions. Only loans and securities are included; other assets are excluded.
Source: call Reports; authors' calculations.
Loans as a percentage of assets have experienced a long period of decline since around the end of 2005, dropping from about 60 percent of total assets to around 54 percent (figure 7). The crisis registered a dip in loans, but a subsequent small recovery followed. Securities, on the other hand, seemed fairly flat before the crisis but increased from around 8 percent of total assets to about 15 percent after, where they have stayed up through the first quarter of 2013.
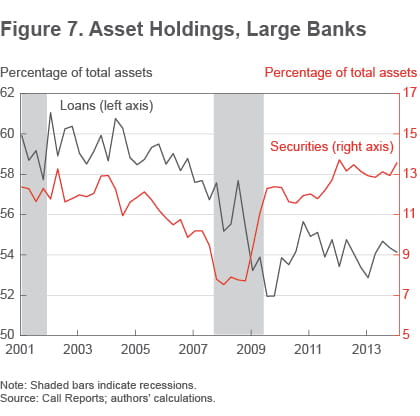
Note: Shaded bars indicate recessions.
Source: Call Reports; authors' calculations.
We don’t see any abrupt movements in the maturity structure of loans at big banks (figure 8). Short-term loans maturing in less than three months held steady as a percentage of total assets. Loans maturing in one to five years have declined gradually, as have loans maturing in three months to one year. Figures 7 and 8 show that the decrease in interest rate risk in the loans component at big banks is coming from a decline in loans as a percentage of total assets, coupled with a fairly steady maturity structure.
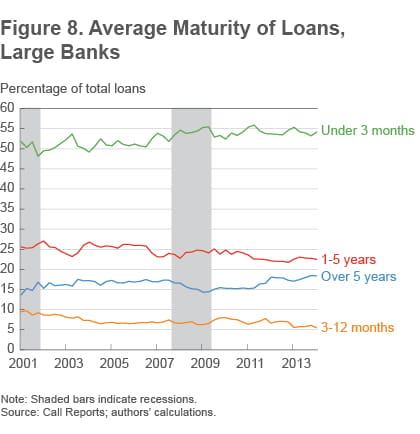
Note: Shaded bars indicate recessions.
Source: Call Reports; authors' calculations.
On the securities side, big banks have increased their holdings of securities that mature in one to five years and securities that mature in less than three months (figure 9). On the other hand, we see a V-shaped decline and recovery in the percent of securities maturing in more than five years. These results show that the increase in risk exposure on the securities side of big banks’ balance sheets comes from both an increase in security holdings as a percentage of total assets, as well as an increase in the maturity of those holdings. Similar to the small banks, large banks are increasing their holdings of shorter-term liabilities (figure 10).
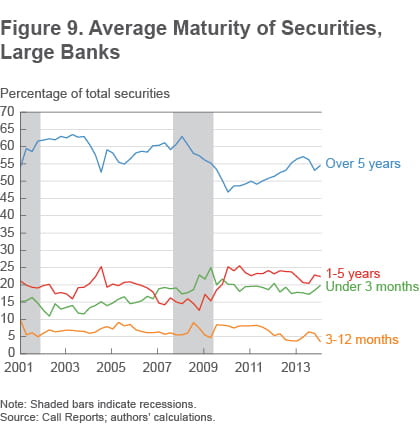
Note: Shaded bars indicate recessions.
Source: Call Reports; authors' calculations.
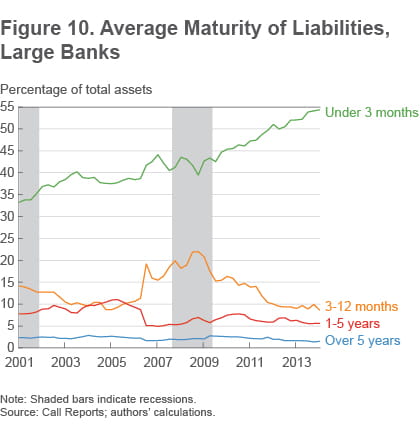
Note: Shaded bars indicate recessions.
Source: Call Reports; authors' calculations.
Conclusion
A look into the maturity structure of assets and liabilities shows that rising interest rate risk is coming from different sources for small and big banks. At small banks, asset maturities are getting longer and liability maturities are getting shorter, a worrisome combination. At big banks, asset maturities have been stable but liability maturities have gotten shorter, like at the small banks. This combination led to an increase in interest rate risk at big banks.
Reference
- Bednar, William, and Mahmoud Elamin, 2014. “Rising Interest Rate Risk at US Banks,” Federal Reserve Bank of Cleveland, Economic Commentary, 2014-12.
Suggested Citation
Bednar, William, and Mahmoud Elamin. 2014. “Interest Rate Risk and Rising Maturities.” Federal Reserve Bank of Cleveland, Economic Commentary 2014-22. https://doi.org/10.26509/frbc-ec-201422
This work by Federal Reserve Bank of Cleveland is licensed under Creative Commons Attribution-NonCommercial 4.0 International

