

- Share
Population Distribution and Educational Attainment within MSAs, 1980-2010
Though most people in the US live in metropolitan areas, they’ve been choosing to live farther and farther from the center of those areas since the 1950s. While that trend continues to this day, there are some dramatic changes. The exodus from the center of town is slowing down quite a bit, for one. For another, those residents who now live in the central city are better educated than they used to be.

The views authors express in Economic Commentary are theirs and not necessarily those of the Federal Reserve Bank of Cleveland or the Board of Governors of the Federal Reserve System. The series editor is Tasia Hane. This paper and its data are subject to revision; please visit clevelandfed.org for updates.
Metropolitan areas in the United States have changed dramatically in size and structure over the last half-century. Suburban sprawl and a hollowing out of residential neighborhoods near the traditional urban core have changed the distribution of the population within and around many US cities. This outward movement of the population, so prevalent in the 1960s and 1970s, has continued in recent decades, though some of its features have changed. In particular, the movement away from the city core has slowed down in the last decade, and the educational composition of residents near the urban core has changed strikingly.
In this Commentary, I document recent shifts in the distribution of human capital (as measured by educational attainment) within metropolitan statistical areas (MSAs) and relate these changes to those areas’ characteristics, including size, congestion, and initial levels of human capital. The data show clearly that the growth rate of college graduates near the central business district has accelerated sharply in the last decade. The same is not true for individuals without a four-year college degree. As a result of these trends, in many metro areas the residents of neighborhoods close to the central business district are now more educated than those in farther-away suburbs.
Data Sources
The data used in this analysis are from the 1980, 1990, and 2000 Decennial Census and the 2007–2011 American Community Survey. I focus on the country’s 100 largest metropolitan areas by population. Within each metropolitan area, population and population characteristics are measured at the census-tract level, using consistent geographical boundaries over time. (Census tracts are geographic areas defined by the Census Bureau which contain, on average, roughly 4,000 individuals.) Information on the longitude and latitude of each census tract’s center is available. For each metropolitan area, I identify the location of the central business district, based on definitions from the 1982 Economic Census. Using the longitude and latitude of the center of this district, the distance to any given census tract can readily be measured; thus, one can analyze how the geographic distribution of population shifts over time within metropolitan areas relative to the central business district. (More details about the dataset can be found in Fee and Hartley, 2012.)
In addition, these data can measure how characteristics of the population change within metropolitan areas. I focus on changes in human capital, using the share of the adult population that has a bachelor’s degree, often referred to as the BA attainment rate, to measure it. It is important to note that this measure of skill reflects the location of an individual’s home rather than his or her workplace.
Patterns within Metropolitan Areas
Figure 1 illustrates the central pattern dominating the growth of US metropolitan areas over the past 50 years—the population’s expansion away from the urban core. The figure shows population growth from 1980 to 2010 by distances of 1 to 30 miles from the core. Population growth rates generally increase as distance from the core increases up through 20 miles, and then they plateau in the outer suburbs. Also evident in the figure is that larger metropolitan areas grew their urban-core populations somewhat faster than smaller metropolitan areas over this period.
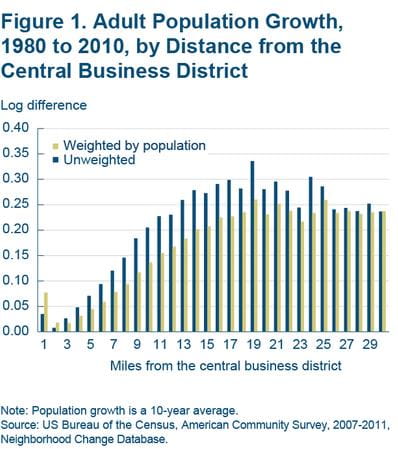
Note: Populations growth is a 10-year average.
Source: US Bureau of the Census, American Community Survey, 2007-2011. Neighborhood Change Database.
One can see the shift of population away from the core more clearly by looking at population shares. Figure 2 shows changes in population shares by distance from the city center for these 100 metro areas. Neighborhoods within 10 miles of the urban core have seen their population shares decline, while neighborhoods 10 to 30 miles from the core have seen their population shares rise. This outward shift of population shares is widespread across the 100 metro areas, with 96 percent of them seeing a decline in the share of the population within 5 miles of the urban core between 1980 and 2010.
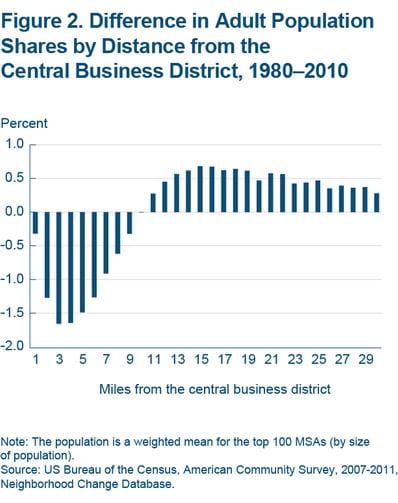
Note: The population is a weighted mean for the top 100 MSAs (by size of population).
Source: US Bureau of the Census, American Community Survey, 2007-2011. Neighborhood change Database.
The changes observed in the geographic distribution of the population are not constant over time or for people with different levels of educational attainment. Figure 3a shows the growth rate of the population without a BA at various distances from the city core over two time periods (2000-2010 and the two decades before). In both time periods, we see that growth rates for the non-BA population rise as distance from the urban core increases. The negative values close to the urban core indicate that population growth rates are below the metropolitan average. The positive values further out indicate that population growth rates are above the metropolitan average. For non-BAs, population growth was concentrated outside of the urban core.
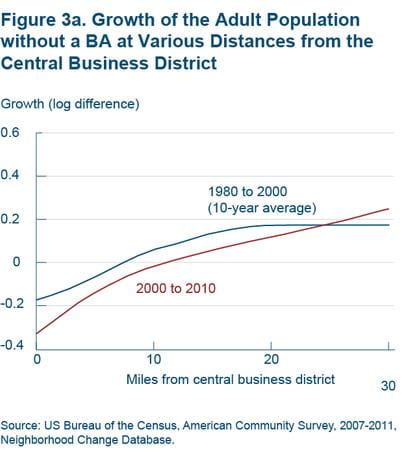
Source: US Bureau of the Census, American Community Survey, 2007-2011. Neighborhood change Database.
Stark differences are observed for those with a BA (figure 3b). The growth rate of this population near the core is much higher in the 2000-2010 period than in the 1980-2000 period. Indeed, the growth rate of this population is as high in the urban core as it is far away from the core, and this trend has noticeably slowed the overall movement of population shares away from the urban core.
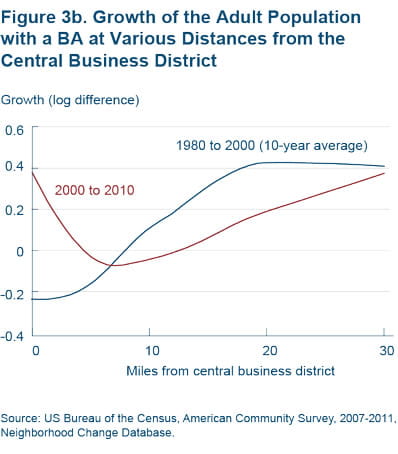
Source: US Bureau of the Census, American Community Survey, 2007-2011. Neighborhood change Database.
Source: US Bureau of the Census, American Community Survey, 2007-2011. Neighborhood change Database.
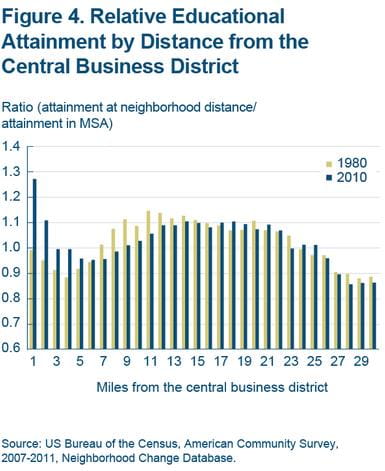
The different growth rates of these two populations have resulted in changes in the distribution of educational attainment within metropolitan areas. Figure 4 plots relative educational attainment by distance from the central business district. The relative educational attainment variable is the ratio of the BA attainment rate for each distance bin over the educational attainment rate for the entire MSA.
Converting the educational attainment variable into a relative value aids in comparisons of educational attainment over time by controlling for the general increase in educational attainment that occurred from 1980 to 2010. The key feature of the chart is the increase in relative educational attainment of the residents living near the central business district. Currently, areas near the central business district are the most educated parts of the metropolitan area.
Patterns across Metro Areas
While the shifts in population and human capital shares discussed above have occurred within most metropolitan areas, there are striking differences across metropolitan areas in the pattern of the educational attainment shift.
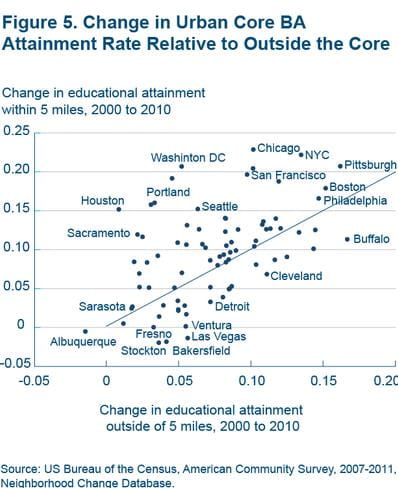
Figure 5 plots the changes in the BA attainment rate close to the urban core (within 5 miles) against changes in BA attainment outside the core, from 2000 to 2010. A metropolitan area that lies on the trend line experiences the same growth rate in BA attainment within its urban core as in its periphery. Metros above the line experience higher growth rates in BA attainment rates in the core, metro areas below the line, lower. Looking at the scatterplot, a clear overall pattern is present. Metropolitan areas with higher rates of growth on their peripheries have a tendency to have higher rates of growth in their cores as well. The strength of the positive correlation is relatively robust.
Source: US Bureau of the Census, American Community Survey, 2007-2011. Neighborhood change Database.
Metropolitan areas with high relative growth in BAs near the core are data points on the northern edge of the cluster. These include both technology-oriented areas like Portland, Seattle, and San Francisco and also very densely populated areas like Chicago and New York. These cities are also often thought of as sought-after living destinations because of the amenities they have to offer.
There were only a few metro areas where BA attainment rates actually declined close to the central business district, including Las Vegas and several metro areas in the interior of California. These areas anchor the southwest corner of the plot, having low rates of BA attainment growth on their peripheries, as well as in their cores.
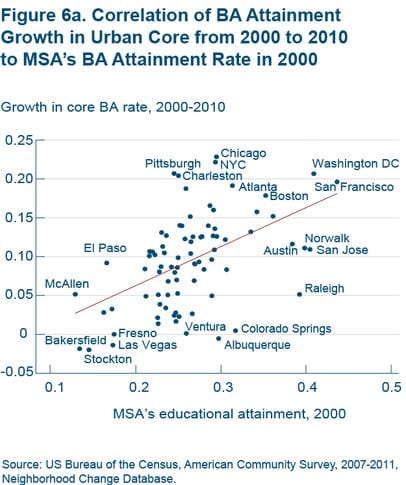
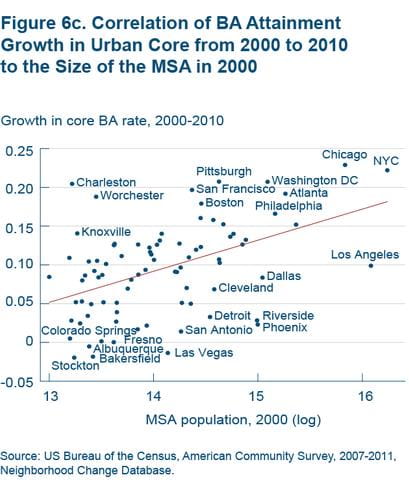
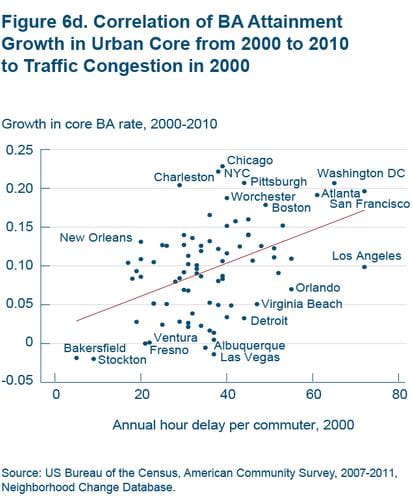
The growth in human capital in the urban core is related to the overall characteristics of the metropolitan area. Figures 6a-6d illustrate a few of these. They relate growth in educational attainment near the urban core from 2000 to 2010 to characteristics of the MSAs in 2000—the educational level of the MSA as a whole, the educational level of the core, the size of the MSA, and the degree of traffic congestion.
MSAs that were higher-skilled in 2000 tend to see more growth in BA attainment near the urban core than lower-skilled MSAs (figure 6a). As result, high-skilled MSAs generally have higher levels of educational attainment near the urban core, while the reverse is true for low-skilled MSAs (correlation = 0.68).
Note: Populations growth is a 10-year average.
Source: US Bureau of the Census, American Community Survey, 2007-2011. Neighborhood Change Database.
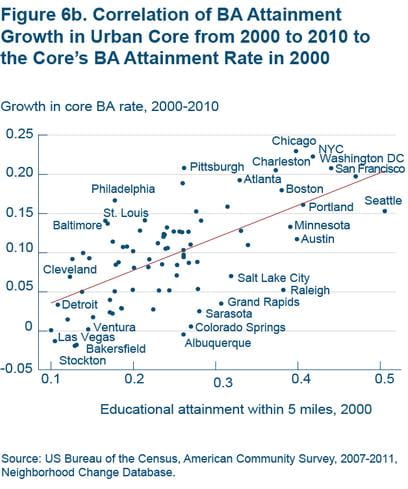
Metropolitan areas that had more educated urban cores in 2000 also experienced higher growth in BA attainment rates near the core (figure 6b). In addition, I find evidence of substantial persistence in BA attainment rates across metro areas over the decades. Metro areas with relatively high educational attainment in their urban cores in 1980 tend to be the locations with relatively high educational attainment in their urban cores in 2010, while the reverse is true for areas that had low attainment in their cores in 1980 (correlation = 0.77).
Note: The population is a weighted mean for the top 100 MSAs (by size of population).
Source: US Bureau of the Census, American Community Survey, 2007-2011. Neighborhood change Database.
Larger metropolitan areas also experienced greater growth in BA attainment rates near the urban core (figure 6c), while metropolitan areas with more commuter delays experienced higher relative growth in BA attainment rates closer to the central business district (figure 6d). This correlation likely reflects the fact that the opportunity cost for commuting in more congested areas leads higher-wage individuals that work in the urban core to reside near their workplaces.
Source: US Bureau of the Census, American Community Survey, 2007-2011. Neighborhood change Database.
Source: US Bureau of the Census, American Community Survey, 2007-2011. Neighborhood change Database.
Fourth District Metro Areas
Metropolitan areas in the Fourth Federal Reserve District also saw dramatic changes in their educational attainment rates near their central business districts. In 1980, the central business districts of Cincinnati, Columbus, and Pittsburgh all had educational attainment rates relatively close to their metropolitan average, so that the relative BA attainment ratio (BA rate within 5 miles/BA rate in metro) was close to one (table 1). Over the next 30 years, both Cincinnati’s and Pittsburgh’s relative educational attainment rose, so that in 2010 the BA attainment rates in the urban core exceeded the BA rates for the metropolitan area (within 30 miles). Pittsburgh’s BA attainment rate in the urban core—46.7 percent—was among the top 20 in the nation. Columbus also experienced a rise in BA rates in the urban core, though the pace was somewhat more muted than in Pittsburgh or Cincinnati.
| BA attainment rate in MSA (ranking among top 100 MSAs) |
BA attainment rate within MSA core (ranking among top 100 MSAs) |
Relative BA attainment rate (ranking among top 100 MSAs) |
||||
|---|---|---|---|---|---|---|
| 1980 | 2010 | 1980 | 2010 | 1980 | 2010 | |
| Cincinnati | 16.0 (67) | 34.6 (51) | 14.2 (62) | 35.9 (37) | 0.89 (57) | 1.04 (42) |
| Cleveland | 15.1 (75) | 34.1 (54) | 6.6 (100) | 19.0 (89) | 0.43 (100) | 0.55 (94) |
| Columbus | 18.4 (38) | 37.7 (33) | 17.0 (43) | 35.7 (38) | 0.92 (53) | 0.95 (52) |
| Pittsburgh | 14.5 (81) | 40.5 (23) | 14.4 (60) | 46.7 (16) | 0.99 (38) | 1.15 (26) |
Notes: Data for the BA attainment rate in the urban core for the 100 largest MSAs are listed here. The MSA core includes a 5-mile radius around the center of the central business district. The relative BA attainment rate is the rate in the central business district divided by the rate in the MSA.
Source: US Census Bureau, American Community Survey, 2010.
Of the four large metro areas in the Fourth District, Cleveland stands out on two dimensions. First, Cleveland started with a very low BA attainment rate in its urban core. In fact, it had the lowest BA attainment rate in 1980 of the top 100 metros, and while it has made improvements in both absolute and relative terms, it is still ranked very low (89th). Second, compared to its overall metropolitan BA attainment rate, Cleveland’s BA attainment rate close to the central business district is very low. Cleveland remains a metropolitan area where the skilled workers reside primarily outside the urban core.
Interestingly, Dayton and Toledo, two other historically manufacturing-intensive metro areas in our district, have a geographic distribution of skills within their metropolitan areas similar to Cleveland’s. One explanation for this pattern could be that the concentration of manufacturing activity close to the central city made suburban locations more attractive to skilled labor earlier in the twentieth century. And over time, the disamenities associated with the legacy of manufacturing (especially heavy manufacturing) continue to outweigh the costs of commuting for higher-income workers.
Conclusion
Over the last 10 years, central business districts have increasingly attracted highly educated individuals as residents. Today, the average educational attainment rate of the urban core is almost identical to the average educational attainment rate in neighborhoods away from the core (on a population-weighted basis), and much of the gap has been closed in the last 10 years. The reasons behind the shifts are likely multifaceted, but they may include rising congestion in large, dense metropolitan areas and improvements in public safety.
In addition, there is a growing body of literature that notes the location decisions of high-skilled individuals increasingly involve consumer amenities that reflect tastes and preferences along with lifestyle. In The City as an Entertainment Machine, sociologists Richard Lloyd and Terry Nichols Clark observe changes in Chicago’s neighborhood demographics that support this analysis and shed light on the modern personal location decision. “The local amenities are no longer schools and churches" A residential population of young professionals with high levels of education and lower incidence of children creates a social profile geared toward recreation and consumption concerns.” The emergence of skilled cores appears to be the manifestation of some cities becoming places that are more geared toward consumption rather than production.
Suggested Citation
Fee, Kyle D. 2013. “Population Distribution and Educational Attainment within MSAs, 1980-2010.” Federal Reserve Bank of Cleveland, Economic Commentary 2013-18. https://doi.org/10.26509/frbc-ec-201318
This work by Federal Reserve Bank of Cleveland is licensed under Creative Commons Attribution-NonCommercial 4.0 International

