

- Share
Lead Poisoning and the Children of Cuyahoga County
While lead poisoning caused by the water supply system in Flint, Michigan, elevated this issue into the national spotlight, lead poisoning has been a public health concern for decades. Water with high lead levels is only part of the problem. According to Environmental Protection Agency (EPA) estimates, drinking water accounts for up to 20 percent of the human exposure to lead. The biggest source of lead exposure is lead-based paint found primarily in homes built before 1978, housing stock that is more prevalent in the Midwest and Northeast. Lead paint was not banned in the United States until 1978, and, therefore, homes built before then can pose a very real risk for lead exposure and poisoning.

The views expressed in this report are those of the author(s) and are not necessarily those of the Federal Reserve Bank of Cleveland or the Board of Governors of the Federal Reserve System.
While lead poisoning caused by the water supply system in Flint, Michigan, elevated this issue into the national spotlight, lead poisoning has been a public health concern for decades. Water with high lead levels is only part of the problem. According to Environmental Protection Agency (EPA) estimates, drinking water accounts for up to 20 percent of the human exposure to lead. The biggest source of lead exposure is lead-based paint found primarily in homes built before 1978, housing stock that is more prevalent in the Midwest and Northeast. Lead paint was not banned in the United States until 1978, and, therefore, homes built before then can pose a very real risk for lead exposure and poisoning.1
Here in Cuyahoga County, 80 percent of the housing stock was built before 1978; in the City of Cleveland that share reaches nearly 90 percent.2 Though lead paint is no longer used in homes, it’s still present in older homes. Chipping and peeling paint and paint dust in these homes pose lead-exposure risks that have serious and irreversible consequences for children. Nationally, half a million children aged less than six have elevated blood-lead levels (5 micrograms per deciliter (μg/dL)), according to the Centers for Disease Control (CDC). It is at this blood-lead level that the CDC recommends public health interventions.3 Yet, the CDC also cautions that “no safe blood lead level has been found in children.”
Why is the Cleveland Fed interested in lead poisoning?
Where we live is inextricably linked to our health and well-being. For decades, community development efforts have focused on place—specifically, on the development and financing of affordable housing and ensuring access to credit and capital in low- and moderate-income communities. More recently, the industry’s focus has expanded to include the effects of place on individuals’ health and well-being. Exposure to lead has significant health and economic consequences for children exposed to it, their families, the communities where they live, and the broader region. While investing in human capital is critical to ensuring a strong, prepared workforce for a growing regional economy, such investments will fall short of expectations if individuals’ potential is curtailed due to their exposure to lead.
Lead poisoning and the consequences for children
Lead poisoning may cause brain and nervous-system damage resulting in behavioral and learning difficulties. There is a considerable amount of evidence linking elevated blood-lead levels with lower IQ levels, lower academic achievement, and increased criminal and delinquent behavior.4 Researchers consistently and repeatedly find an inverse relationship between elevated blood-lead levels and IQ scores even at relatively low lead levels (< 10 μg/dL). In a study published in 2003, Canfield and his co-authors find an increase in lifetime blood-lead levels from 1 to 10 μg/dL results in a drop of 7 IQ points.5 Further, they find that “the total lead-related impairment [among the children in the study] is due largely to the initial IQ loss at blood lead concentrations of 10 μg/dL or less.”6 Examining a number of studies that assessed the effects of lead exposure on intellectual capacity, Lanphear and his co-authors find blood-lead levels less than 7.5 μg/dL had larger negative impacts on IQ than lead levels at or above 7.5 μg/dL.7 Children with blood-lead levels less than 7.5 μg/dL lost, on average, 2.94 IQ points per 1 μg/dL increase in blood-lead levels, compared to children with blood lead levels at or above 7.5 μg/dL, who lost, on average, 0.16 points per 1 μg/dL increase.
In a study on the impacts of lead exposure on the academic achievement of children in the Detroit Public Schools, researchers find that students with elevated blood-lead levels before the age of six were more likely to be non-proficient in math, science, and reading in the 3rd, 5th, and 8th grades compared to those without elevated lead levels, even at blood lead levels below 5 μg/dL.8
Childhood lead exposure has also been linked to behavioral issues and crime. In recent research, Reyes finds elevated blood-lead levels are associated with significant increases in antisocial behavior, hyperactivity, and emotional issues among children. Her analysis also provides evidence of a relationship between criminal activity as a teen and elevated childhood blood-lead levels.9 Earlier research by Reyes finds that the significant declines in violent crime rates in the 1990s were associated with the large reductions in childhood lead exposure from gasoline in the 1970s and early 1980s.10
Lead poisoning and economic repercussions
The societal and economic costs of lead poisoning are substantial, according to a number of analyses. The impact on lifetime earnings due to a reduction in IQ has been the focus of many of them. Each study focuses on a different cohort of children and differing time periods, making it difficult to compare them; nevertheless, these studies estimate significant costs associated with lead exposure and significant benefits from reducing childhood lead exposure. A 2002 study estimated the costs of lead poisoning on lifetime earnings of children to be $43 billion annually.11 Another study also published in 2002 estimated the benefits of reduced childhood lead exposure on lifetime earnings to be between $110 and $318 billion based on the reduction in lead exposure since 1976.12 A more recent report estimates the social and economic benefits realized from remediating lead hazards to be between $182 and $269 billion. Put another way, spending one dollar on remediation returns $17 to $221 dollars in benefits through higher earnings and tax revenue, reduced spending on special education, and less criminal activity.13
Calculations of the costs of remediating lead paint in residences vary. The EPA estimates that lead abatement averages $8 to $15 per square foot, or roughly $10,000 to $30,000, for homes that are 2,000 sq. ft. and smaller. Encapsulation, which uses a special coating that bonds with and seals in the lead paint, is the lowest-cost option at around $1,000 to $2,000 per house. The national average for abatement is around $10,000 per home; the actual cost depends on the scope of the problem and the techniques used. In some of the reports we reviewed, average estimated costs to remediate lead in homes ranged from a low of $6,000 to a high of $10,000.
Lead-exposed children in Cuyahoga County
In Ohio, the law requires all children less than six years old be tested for elevated blood-lead levels if they meet any of the following criteria: the child lives or regularly visits a property built before 1978 (includes childcare centers and preschools); the child is on Medicaid; or the child lives in a high-risk zip code, defined as an area in which at least 12 percent of the children under six are predicted to have elevated blood-lead levels.14 While Ohio law requires lead testing to take place if any of these three criteria are met, it is unclear the extent to which this testing actually occurs. Once results of testing are known, state law requires contact from a health department when a child’s blood- lead test registers a confirmed elevated blood-lead level of 5 μg/dL or greater. At 10 μg/dL and above, the state requires an on-site public health investigation.
When looking across all 88 counties in the state, Cuyahoga County stands out as having the highest percentage of tested children with elevated blood-lead levels (EBLLs) in 2014, at 10.22%.15 Of the 22,054 children tested, 2,255 had EBLLs at or higher than 5 μg/dL. In comparison, Franklin County—home to the City of Columbus—tested 21,856 children and found 260 of them (1.19%) had elevated blood-lead levels; and in Hamilton County—home to Cincinnati—16,527 children were tested and 390 (2.36%) had elevated blood-lead levels. Further, nearly half of the Ohio children with elevated blood-lead levels in 2014 lived in Cuyahoga County. In the City of Cleveland, three neighborhoods had strikingly high rates of elevated blood-lead levels in the children tested: Glenville (26.5%), St. Clair–Superior (23.4%), and Collinwood (20.3%).16
In both Cuyahoga County and Cleveland the percentage of tested children with elevated blood-lead levels has been on the decline since 2004 (see Figure 1), which is encouraging. Despite this downward trend, however, it should be noted that in the Case Western Reserve University research discussed below, nearly 40 percent of the Cleveland Metropolitan School District (CMSD) preschoolers had elevated blood-lead levels at some point in their young lives. Again, the effects are irreversible and stay with them as they age.
As for remediation efforts here in Cuyahoga County, the news is also mixed. The declines in lead- exposure rates have been associated with increased efforts to remediate lead-based paint in the housing stock as well as surveillance of children identified with elevated blood-lead levels, both of which rely on funding from the federal government. However, in 2012 the CDC removed surveillance funds from the local health departments’ budgets; these funds are designated for activities such as identifying at-risk geographic areas, code enforcement, and public education campaigns. In 2014, neither the City of Cleveland nor Cuyahoga County was awarded lead-remediation funds from the Department of Housing and Urban Development (HUD). More recently, Cleveland did receive a $3.3 million grant from HUD in 2015 and will be investigating 220 homes in which at least three children have been lead poisoned by residing in the property. Cuyahoga County also received a HUD grant in 2015, of $2.9 million, to address lead hazards in 230 homes.
Figure 1. Lead Exposure Testing Rates: Cuyahoga County & City of Cleveland
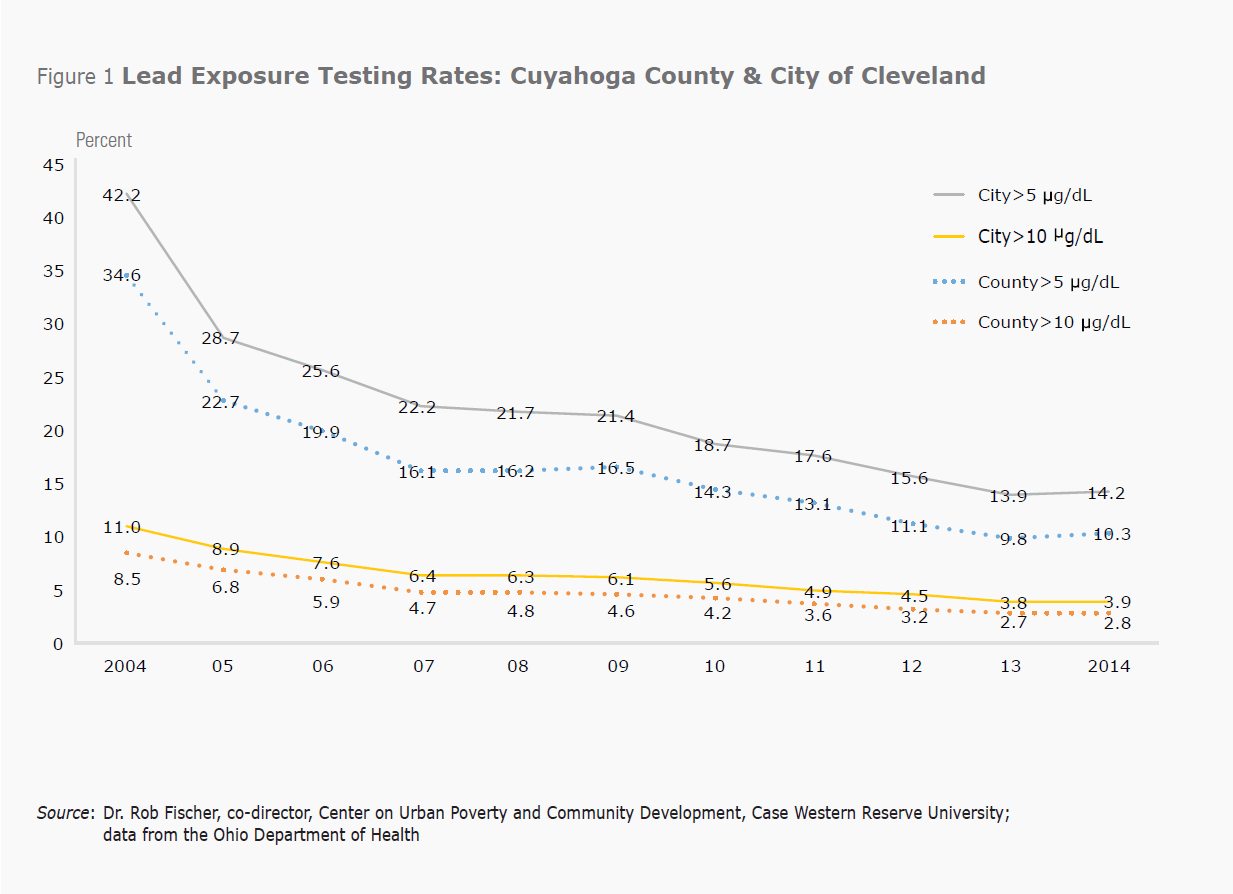
Source: Dr. Rob Fischer, co-director, Center on Urban Poverty and Community Development, Case Western Reserve University; data from the Ohio Department of Health
Complicating remediation efforts is the difficulty in identifying the number of homes that need to be addressed for lead. As an example, a 2011 report from the Cleveland Department of Public Health (CDPH) showed that 545 children had elevated blood-lead levels (>= 10 μg/dL), a fact that should have triggered on-site public health inspections for each child, per Ohio law. According to this report, only 99 of these cases were investigated, with 78 properties being deemed hazardous to the children’s health.17 It is not possible to determine how many of the remaining 450 children resided in homes that would be deemed hazardous as well. Local media have reported that the declining federal funds, coupled with staffing issues in CDPH, have negatively impacted the city’s investigations of lead-poisoned children over the past several years.18
Local research on impacts of lead exposure on educational outcomes
Nationally, the negative impacts of lead exposure on children’s educational outcomes are well known. But what do we know about the effects on children living in Cuyahoga County? Researchers at the Center on Urban Poverty and Community Development at Case Western Reserve University (CWRU) have undertaken a number of studies to understand and document these impacts. Examining the relationship between elevated blood-lead levels and school readiness among children attending Universal Pre-K (UPK) in Cuyahoga County, they found lead-poisoned children fare worse on assessment tests.19 Children in the study were tested on school readiness concepts in both the Fall of 2012 and in the Spring of 2013. Children were grouped in three categories based on lead levels: no lead test in Ohio Department of Health data; children with a confirmed elevated blood lead level greater than 0 μg/dL but less than 5 μg/dL; and children with a confirmed elevated blood lead level of greater than or equal to 5 μg/dL. Their analysis shows that while all three groups experienced gains on the school readiness tests from the Fall to the Spring, children with elevated blood lead levels (>=5 μg/dL) exited UPK behind their other two peer groups. In fact, children in the “high lead test” group (>=5 μg/dL) exited UPK in the Spring with lower scores than the “no lead test” group entered with in the Fall, for each of the five school-readiness concepts. For example, on the number component of the assessment, the “no lead” group scored 70.7 on the test in the Fall while the “high lead test” group scored 59.2 in the Spring test.
In a recently released report, Claudia Coulton and her CWRU co-authors examine the effects of a number of housing and neighborhood conditions on kindergarten readiness.20 A Childhood Integrated Longitudinal Data (CHILD) system developed and maintained by the Center on Urban Poverty and Community Development links administrative data from public health, public assistance, social services, and education at the individual child level. Housing data and the CHILD data are linked at the parcel level. The CWRU report looks at all children who entered kindergarten in the Cleveland Metropolitan School District (CMSD) during the 2007-2010 school years. Of interest here are the effects of elevated blood-lead levels on kindergarten readiness in Cleveland. Nearly 40 percent of the children entering kindergarten from 2007 to 2010 tested positive for lead (>=5 μg/dL). Moreover, they find children who are not tested for lead and those with elevated blood-lead levels score statistically lower on the Kindergarten Readiness Assessment–Literacy (KRA-L) compared to those children who test negative for lead.
The authors further explore the impact of neighborhood and housing characteristics on elevated blood-lead levels. They find the chances for lead poisoning are higher for children whose mothers are less educated, who spend more time in poverty, and who live in poor housing conditions and/or low-value homes. Children who have more exposure to tax-delinquent, foreclosed, and speculator-owned properties also have increased rates of lead poisoning. This is true for both the home the child lives in and surrounding properties. Children living in poor housing and near distressed housing throughout their pre-school years were 25 percentage points more likely to have an elevated blood-lead level than those who did not live in these circumstances.21
Targeting efforts to address lead exposure
Critically important to this research are the CHILD and property integrated data systems, which allow researchers to identify specific property characteristics linked to elevated blood-lead levels. Such data systems can be used to identify housing units with lead-related risk factors and target those homes for inspection in advance of children being exposed to lead by living in them. The University of Chicago in collaboration with the Chicago Department of Public Health developed such a tool. With access to 20 years of data on blood-lead levels and home inspections, the researchers and public health officials built a system to identify children at highest risk for lead poisoning and homes at the highest risk for lead hazards. Given limited resources, the city is prioritizing children and homes with the highest lead-related risks for outreach and inspection.22
Importantly, there are local ordinances that require Cleveland landlords to register rental properties and comply with nuisance laws; these include the removal of lead hazards. Yet, enforcement or compliance with these laws is problematic.23 It is unclear why. But declining funds, local budget constraints, and competing priorities may affect enforcement of and compliance with the laws. Environmental Health Watch (EHW), a local nonprofit, is advocating for enforcement of Cleveland’s rental registry, which could generate city revenue for lead-hazard identification and remediation. Additionally, EHW proposes making lead-safe maintenance certificates mandatory for rental properties as well as making a list of lead-safe homes available to the public. These efforts can go a long way toward enhancing primary prevention efforts.
The state of Rhode Island enacted a policy in 1997 requiring landlords to acquire “lead-safe” certificates in order to rent their properties. Working through local community organizations, the state targeted their efforts on four cities characterized by high rates of poverty and lead exposure which also had higher shares of African-American children. Researchers found this policy not only lowered lead levels in these targeted areas but also decreased the black– white gap in test scores, suggesting that African-American children’s disproportionate exposure to lead explains at least some of the differences in test scores among white and black children. In fact, the authors calculate that the decline in racial disparities in lead exposure, attributable to Rhode Island’s targeted lead-remediation efforts, explains nearly half the decline in racial disparities in test scores over the past 10 years.24
Local initiatives to address lead exposure: Two targeted approaches
Currently, collaborative efforts are underway to address the problem of lead exposure in a few of Cleveland’s neighborhoods with the highest rates of lead-poisoned children. Since 2015, the Cleveland Foundation has provided nearly $800,000 to support the Greater University Circle Community Health Initiative, an effort led by Neighborhood Connections and Case Western Reserve University. This initiative is focused on improving infant-mortality and lead-poisoning rates through the creation of community health action teams focused on innovative interventions in the neighborhoods surrounding University Circle. Some of this funding will be directed to lead-remediation efforts and lead-poisoning education in the Glenville neighborhood, which had the city’s highest rate of lead-poisoned children (26.5%) in 2014.
A partnership between Environmental Health Watch, Cleveland’s MetroHealth System, and the Cleveland Department of Public Health was awarded $250,000 by the BUILD Health Challenge, a national awards program, which supports community collaborations to improve health outcomes. The funded project, called Engaging the Community in New Approaches to Healthy Housing (ECNAHH), seeks to improve asthma, lead-poisoning, and chronic obstructive pulmonary disease outcomes related to unhealthy housing, as well as increase/promote injury prevention. The aim of ECNAHH is to reduce health hazards in homes through prevention-based maintenance and targeted home interventions. This effort will serve neighborhoods on the near-west side of Cleveland, including Stockyards, Clark-Fulton, and Brooklyn Centre.
While relatively new, these targeted interventions essentially serve as pilot programs to build evidence about what works and what doesn’t, with the goal of replicating the elements that do work throughout Cleveland and perhaps the county. The collaboration among the community organizations, funders, hospitals, public health departments and universities in these efforts is critical. While each entity has specific expertise in addressing health challenges, no one entity can tackle these issues alone.
Conclusion
The negative impacts of lead exposure on children are undisputed. Decades’ worth of research has linked lead poisoning with reductions in IQ, poor educational outcomes, behavioral challenges, attention disorders, and criminal activity. Once lead-poisoned, a child sustains irreversible damage. The costs associated with lead-exposed children estimated by economists, physicians, public health experts and others may differ, but there is considerable consensus that the societal and economic costs associated with lead-poisoned children are substantial.
Quantifying the extent of the lead exposure problem is difficult. We know how many children do test positive for elevated blood-lead levels; what we don’t know is how many more would if state laws requiring testing were enforced. Preventing exposure is the only way to avoid the negative effects associated with lead. Integrated data systems like the ones developed by CWRU’s Center on Urban Poverty and Community Development can be used to identify at-risk properties and, in turn, inform inspection and outreach efforts. The targeted and collaborative approaches in a few of Cleveland’s neighborhoods that are currently addressing childhood lead poisoning seem promising. We will learn more about these efforts as they progress.
While the declining rates in positive lead tests are encouraging, childhood lead exposure remains a significant problem in Cuyahoga County. Clearly funding is an issue, particularly with dwindling resources from the federal government and local governments’ budgetary constraints. But, eliminating lead poisoning from homes is the only way to ensure our children do not suffer the negative consequences from this preventable problem.
Footnotes
- According to the National Center for Healthy Housing, the highest levels of lead are found in paint produced up to 1950. However, house paint produced from 1950 to 1978 also contains harmful amounts of lead. Return
- American Community Survey, U.S. Census Bureau 2012 5-year estimate (2008-2012), extracted from NEO CANDO, neocando.case.edu. In Cleveland, 80% of the housing stock was built before 1950, and in Cuyahoga County, 62% was built before 1950. Return
- The CDC lowered the blood-lead levels for intervention in 2012 from 10 micrograms per deciliter (μg/dL) to 5 micrograms per deciliter (μg/dL). Cuyahoga County lowered the threshold to 5 micrograms per deciliter (μg/dL) in 2007. Return
- Educational Services for Children Affected by Lead Expert Panel. Educational Interventions for Children Affected by Lead. Atlanta: U.S. Department of Health and Human Services: 2015. Return
- Canfield R, Henderson C, Cory-Slechta D, Cox C, Jusko T, Lanphear B. “Intellectual Impairment in Children with Blood Lead Concentrations below 10 μg/dL per Deciliter,” The New England Journal of Medicine, 348(16) (April 17, 2003): 1517-1526. Return
- Ibid., pg. 1522. Return
- Lanphear B, Horung R, Khoury J, Yolton K, Baghurst P, Bellinger D, Canfield R, Dietrich K, Bornschein R, Greene T, Rothenberg S, Needleman H, Schnaas L, Wasserman G, Graziano J, Roberts R. “Low-Level Environmental Lead Exposures and Children’s Intellectual Function: An International Pooled Analysis,” Environmental Health Perspectives, 113(7) (July 2005): 894-899. Return
- Zhang N, Baker H, Tufts M, Raymond R, Salihu H, Elliot M. “Early Childhood Lead Exposure and Academic Achievement: Evidence From Detroit Public Schools, 2008-2010, “American Journal of Public Health” 103(3) (March 2013): 72-77. Return
- Reyes J. “Lead Exposure and Behavior: Effects on Antisocial and Risky Behavior among Children and Adolescents,” Economic Inquiry 53(3) (July 2015): 1580-1605. Return
- Reyes J, “Environmental Policy as Social Policy? The Impact of Childhood Lead Exposure on Crime,” The B.E. Journal of Economic Analysis & Policy 7(1): 1-41. Return
- Landrigan P, Schechter C, Lipton J, Fahs M, Schwartz J. “Environmental Pollutants and Disease in American Children: Estimates of Morbidity, Mortality, and Costs of Lead Poisoning, Asthma, Cancer, and Developmental Disabilities,” Environmental Health Perspectives 110(7) (July 2002): 721-728. Return
- Grosse S, Matte T, Schwartz J, Jackson R. “Economic Gains Resulting from the Reduction in Children’s Exposure to Lead in the United States,” Environmental Health Perspectives 110(6) (June 2002): 563-569. Return
- Gould E. “Childhood Lead Poisoning: Conservative Estimates of the Social and Economic Benefits of Lead Hazard Control,” Environmental Health Perspectives 117(7) (July 2009): 1162-1167. Return
- The Ohio State University Statistical Consulting Service developed the model to predict high-risk neighborhoods (for methodology, see Final Report on Targeted Testing Plan for Childhood Lead Poisoning, available at www.ohhn.org/docs/OhiosHighRiskLeadModelFinalReport2013.pdf). Return
- Lead poisoning reports for counties and major cities in Ohio are available at www.odh.ohio.gov/odhprograms/eh/lead_ch/lead_data.aspx. Return
- Neighborhood-level lead poisoning reports in Cuyahoga County can be found at www.ccbh.net/lead-level-maps. Return
- 2010-2011 Annual Lead Program Summary found at www.cleveland.com/healthfit/index.ssf/2015/11/clevelands_lead_program_plague.html. Return
- Articles accessible via www.cleveland.com/healthfit/index.ssf/2015/11/clevelands_lead_program_plague.html and www.cleveland.com/healthfit/index.ssf/2016/04/cleveland_hopeful_for_future_b.html. Return
- Anthony E, Fischer R, and Kim SJ. “The Association Between Elevated Blood Lead and School Readiness among Children Attending Universal Pre-Kindergarten in Cleveland,” June 2015. Center on Urban Poverty and Community Development: Mandel School of Applied Social Sciences. Return
- Coulton C, Richter F, Kim SJ, Fischer R, Cho Y. “Leveraging Integrated Data Systems to Examine the Effect of Housing and Neighborhood Conditions on Kindergarten Readiness,” April 2015. Center on Urban Poverty and Community Development: Mandel School of Applied Social Sciences. Return
- Ibid. Return
- Potash E, Majumdar S, Rozier E, Brew J, Reece A, Jorgensen E, Ghani R, Loewi A, Walsh J, Mansour R. “Predictive Modeling for Public Health: Preventing Childhood Lead Poisoning.” August 2015. Proceedings from the 21st ACM SIGKDD International Conference on Knowledge Discovery and Data Mining. Pages 2039-2047. Return
- Korfmacher K, Hanley M. “Are Local Laws the Key to Ending Childhood Lead Poisoning?” Journal of Health Politics, Policy and Law 38(4) (August 2013): 757-813. Return
- Aizer A, Currie J, Simon P, Vivier P. “Lead Exposure and Racial Disparities in Test Scores,” February 2015. Brown University Working Paper.Return