- Share
Distressed Loans in Ohio: Are Loss-Mitigation Tools Easing Distress?
In October 2010, not long after the Home Affordable Mortgage Program (HAMP) was implemented to help address the increasing numbers of distressed loans, we published an analysis of Ohio loan modifications that were performed between 2008 and 2010 (see "Mortgage Delinquencies in Ohio: Are Loan Modifications Stemming the Tide?"). We found in that earlier analysis that loan modifications in 2008 involved mostly increases in principal balances, but by 2010 modifications primarily were resulting in a reduced monthly payment for the borrowers. As a fraction of delinquent loans, modifications were higher for portfolio-held loans and lowest for privately securitized loans. Overall, however, the numbers of modified loans were minimal in comparison to the stock and inflow of delinquent loans. And about a third of Ohio loans modified in 2009 had re-defaulted within six months.
The views expressed in this report are those of the author(s) and are not necessarily those of the Federal Reserve Bank of Cleveland or the Board of Governors of the Federal Reserve System.
In October 2010, not long after the Home Affordable Mortgage Program (HAMP) was implemented to help address the increasing numbers of distressed loans, we published an analysis of Ohio loan modifications that were performed between 2008 and 2010 (see "Mortgage Delinquencies in Ohio: Are Loan Modifications Stemming the Tide?"). We found in that earlier analysis that loan modifications in 2008 involved mostly increases in principal balances, but by 2010 modifications primarily were resulting in a reduced monthly payment for the borrowers. As a fraction of delinquent loans, modifications were higher for portfolio-held loans and lowest for privately securitized loans. Overall, however, the numbers of modified loans were minimal in comparison to the stock and inflow of delinquent loans. And about a third of Ohio loans modified in 2009 had re-defaulted within six months.
Two years later, we update and extend this analysis to include both a broader set of loss-mitigation tools and the performance of underwater loans. Also referred to as loans with negative equity, underwater loans have an outstanding balance that is higher than the value of the home and are, therefore, considered to have a higher default risk than "above water" loans. One federal response to the housing crisis, the Home Affordable Refinance Program (HARP) of 2009, has become more flexible recently, allowing the refinance of a growing number of underwater loans.
Based on an analysis of loans in Ohio from 2008 to 2012, we find that:
- The share of Ohio loans entering delinquency continues to decline, as it has for most of the past three years. And exits out of delinquency or foreclosure - via recovery, sale, or change to REO status - outpaced entries into delinquency for most of 2012. However, the movement along the delinquency-foreclosure-liquidation path continues to be sluggish: Almost half of the loans entering delinquency in the first two quarters of 2011 are still either 60 or more days delinquent or in foreclosure one year later.
- The self-cure rate, which reflects the ability of borrowers to recover from delinquency without a modification, has increased since 2009. One-third (34%) of the loans that entered delinquency in the first four months of 2011 were current six months later without a modification.
- As in our earlier analysis, loan modifications continue to represent a path out of distress for a very small fraction of delinquent loans. In fact, of all loans entering delinquency in the first half of 2011, only seven percent had been modified successfully - meaning they remained current six months after modification. Furthermore, we do not find indications that the short sale of delinquent loans is emerging as a meaningful alternative loss-mitigation tool.
- The average share of loans estimated to be underwater has been above 20 percent for the last two years, although there is quite a bit of variation across Ohio counties, with higher rates in the north east region. Yet nearly 26 percent of loans paid off in 2012 were underwater and current, up from about just 11 percent in 2008. This suggests that refinances or sales of potentially distressed loans are picking up, and are likely contributing to lowering the inventory of delinquent loans in the state.
Federal tools to help ease distress
The federal government implemented the following programs over several years as the housing crisis unfolded and the nation struggled to maintain stability in its housing markets. Though their acronyms are similar, each program features distinct ways to address homeowners with loans at varying stages of distress.
- Home Affordable Mortgage Program (HAMP). Implemented in 2009, HAMP allows borrowers to lower their first-lien mortgage payment to an affordable level through a loan modification process. This program has eased eligibility requirements over time.
- Home Affordable Refinance Program (HARP). Implemented in 2009, HARP allows borrowers to refinance to a new, more affordable mortgage if they are unable to obtain traditional financing due to a decline in their home's value. In 2010 and 2011 the program was modified to eventually eliminate positive equity requirements altogether.
- Home Affordable Foreclosure Alternatives (HAFA) Program. HAFA provides distressed borrowers two options for transitioning out of a mortgage, deed in lieu of foreclosure and short sales.
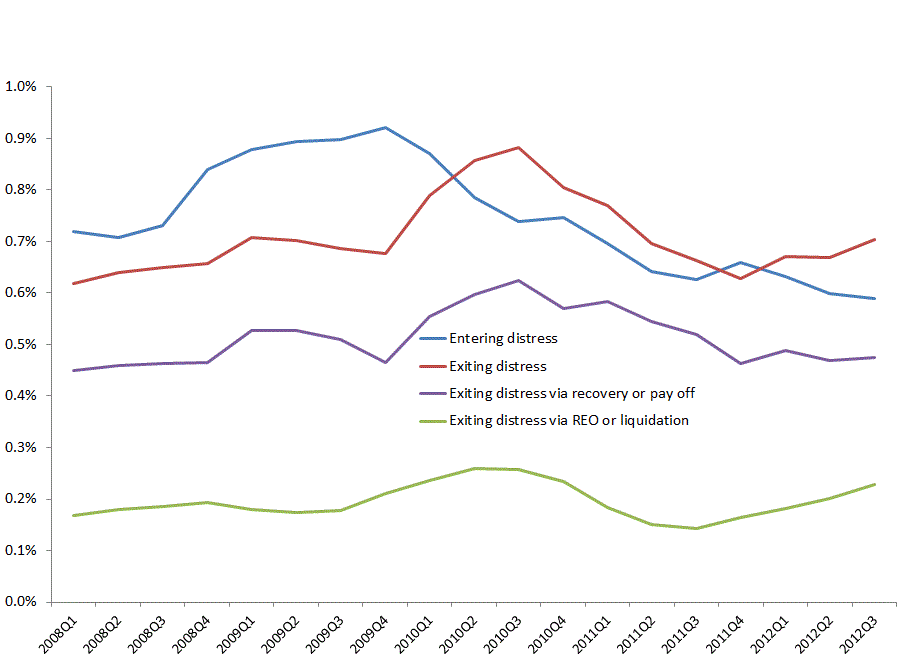
Share of active loans entering and exiting a distressed status in Ohio
Source: Lender Processing Services, Inc. (LPS) data; authors' calculations
Figure 1 shows trends in the share of all active loans entering and exiting a distressed state, which we define as 60 or more days delinquent or in foreclosure. Exits out of this state, or status, occur when a loan recovers (becomes current or 30 days delinquent), is paid off, or closes after the associated property transitions out of foreclosure and back into the market - liquidation - or back to the bank - REO, or real-estate owned, status. We see that for the most part, since 2010, entries into distress have been dropping as a share of all active loans. Furthermore, for the past year exits through recovery or payoff have remained stable while movement into REO or liquidation has increased.
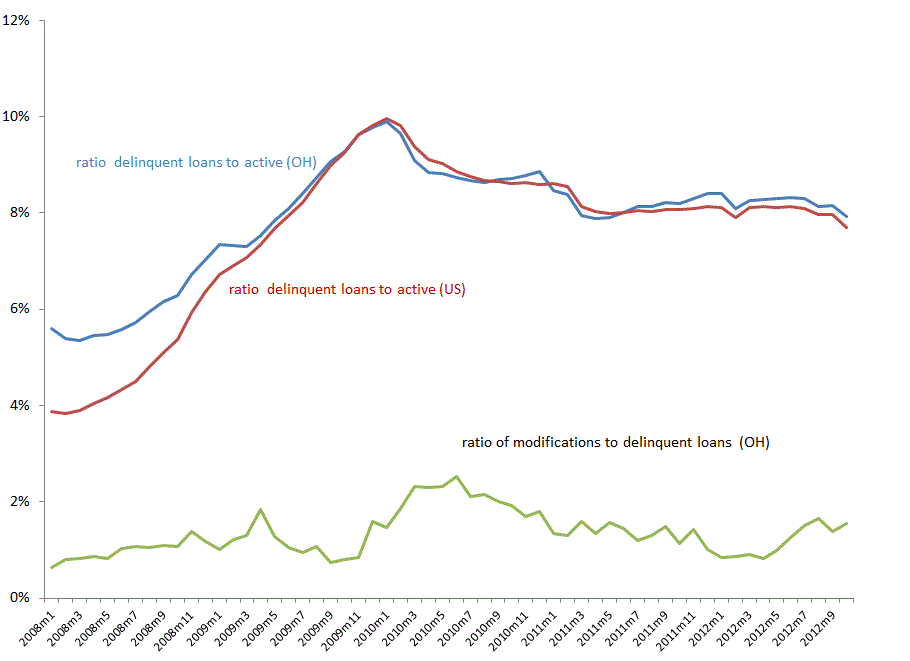
As illustrated in Figure 2, both Ohio's and the nation's delinquency rates have leveled off since the beginning of 2011, remaining at about 8 percent. Modification rates in Ohio reached their peak of 2.5 percent in mid-2010 and have remained below 2 percent ever since. In other words, fewer than two percent of all Ohio delinquent loans were modified in a given month. When examining the types of modifications being done, we see that those involving fixed-rate interest reductions and term changes continue to comprise the largest percentages of modifications, at about 41 and 33 percent respectively. While modifications involving a principal balance reduction remain quite low, they have nevertheless increased from roughly five percent to 10 percent between 2011 and 2012. The great majority of the more recent loan modifications we analyzed include a monthly payment decrease; in the third quarter of 2012, for example, nearly 85 percent reduced the borrower's monthly payment, compared to 15 percent that did so in the first quarter of 2007.
Ratio of delinquent loans to active loans
Source: Lender Processing Services, Inc. (LPS) data; authors' calculations
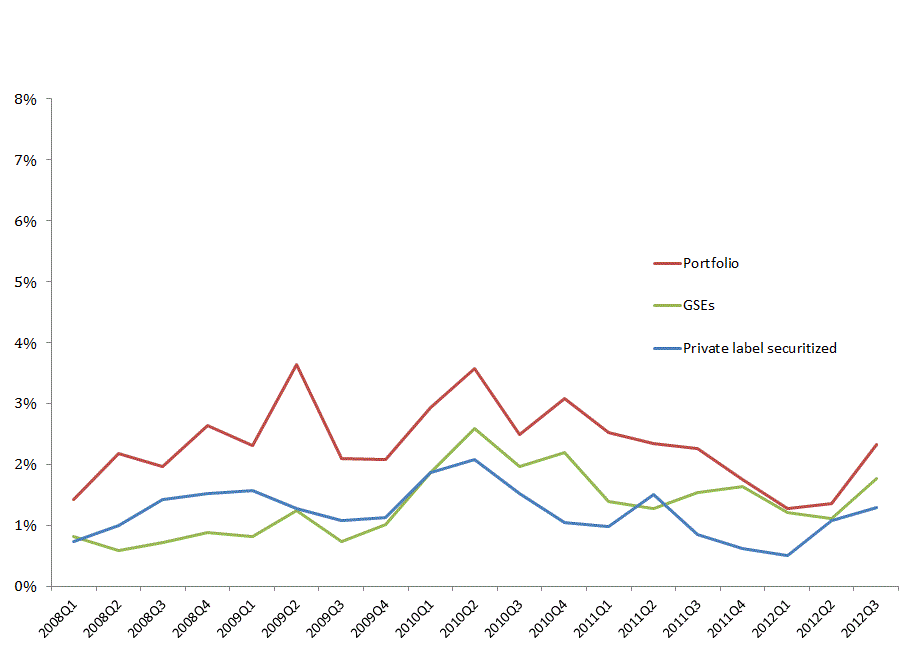
In Figure 3 we see trends in loan modifications as a share of all delinquencies by investor type. Investors are the entities that hold or own the mortgage note, and are not necessarily the servicer. While portfolio-held loans exhibited the highest modification rates for most of the period from 2008 through 2012, we also see that most recently, there are smaller differences in modification activity among the different investor types. Delinquent loans are shared almost evenly among the three investor types, compared to the beginning of the time period, when private label securitized loans comprised the highest delinquency share followed by GSE securitized loans. This change is consistent with the fact that in recent times economic conditions such as unemployment and housing prices are affecting the performance of loans across all investor types.
Ratio of modified loans to delinquent loans
Source: Lender Processing Services, Inc. (LPS) data; authors' calculations
Moral Hazard and Loan Modifications
Moral hazard is said to be a main issue preventing higher levels of loan modifications. In this context moral hazard refers to the risk of either incenting borrowers to become delinquent in order to obtain a modification or discouraging delinquent borrowers able to become current on their loans from doing so, because of the hope or expectation that they will receive a modification. While it is true that under certain conditions borrower and lender may both be better off reducing the loan principal or payments to avoid foreclosure, it is impossible to know a priori if the loan considered for modification could have avoided foreclosure without an intervention (self-cured) or if the intervention will fail in its goal of avoiding foreclosure (re-default). However, the possibility that potentially large numbers of borrowers who are current on their loan payments might be induced into delinquency in hopes of a modification could add a great deal more uncertainty and stress to the housing market.
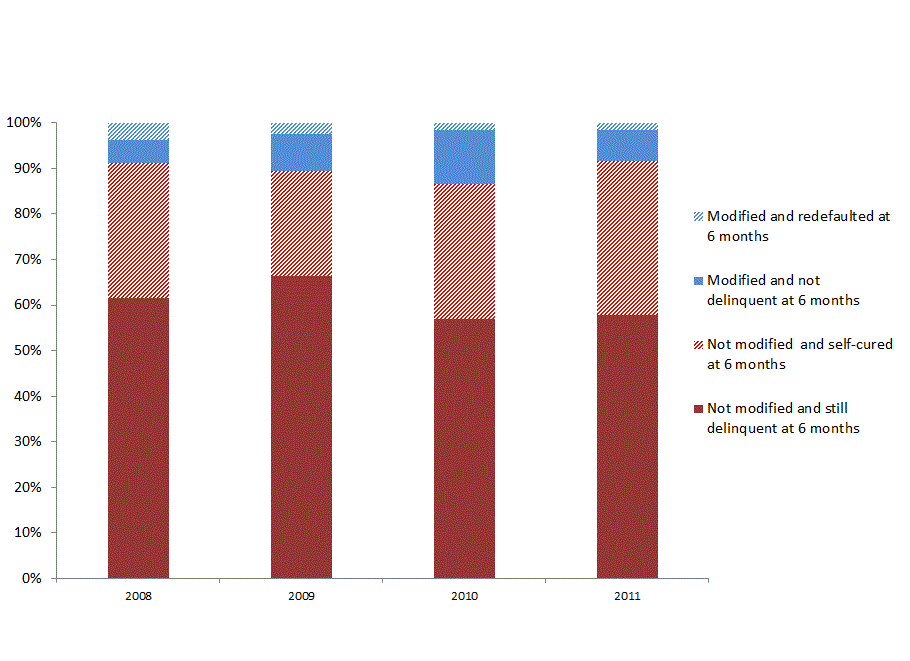
For a general idea of Ohio's self-cure and re-default rates over the past four years, we look at the status of loans becoming 60 days delinquent in the first four months of 2008, 2009, 2010, and 2011 (see Figure 4). For delinquent loans that are modified (share shown in blue), we look at their status six months after modification. For delinquent loans that are not modified (share shown in red), we look at their status six months after they enter delinquency. The red crosshatch corresponds to the share of non-modified loans that are able to self-cure within 6 months following delinquency. The blue crosshatch corresponds to those modified loans that re-defaulted 6 months following the modification.
Status of delinquent loans in Ohio at six months
Source: Lender Processing Services, Inc. (LPS) data; authors' calculations
The most encouraging sign in these trends is that self-cure rates have increased since 2009. In the first four months of 2011, one-third (34%) of the loans that entered delinquency became current without a modification. Unfortunately, modification rates declined in 2011 from their 2010 peak, and successful loan modifications - those that have not re-defaulted by the sixth month - accounted for just seven percent of all delinquent loans in the first four months of 2011.
As for the time between delinquency and modification, it has declined only slightly since 2008. For loans modified within a year of delinquency, we find that the average time has declined from seven to six and half months, suggesting little progress in the streamlining of the process. Overall, the modification rates on delinquent loans have declined from 2010 to 2011 (see Figure 2), but at the same time self-recovery rates without a modification have improved.
Leaving Delinquency via Other Exits
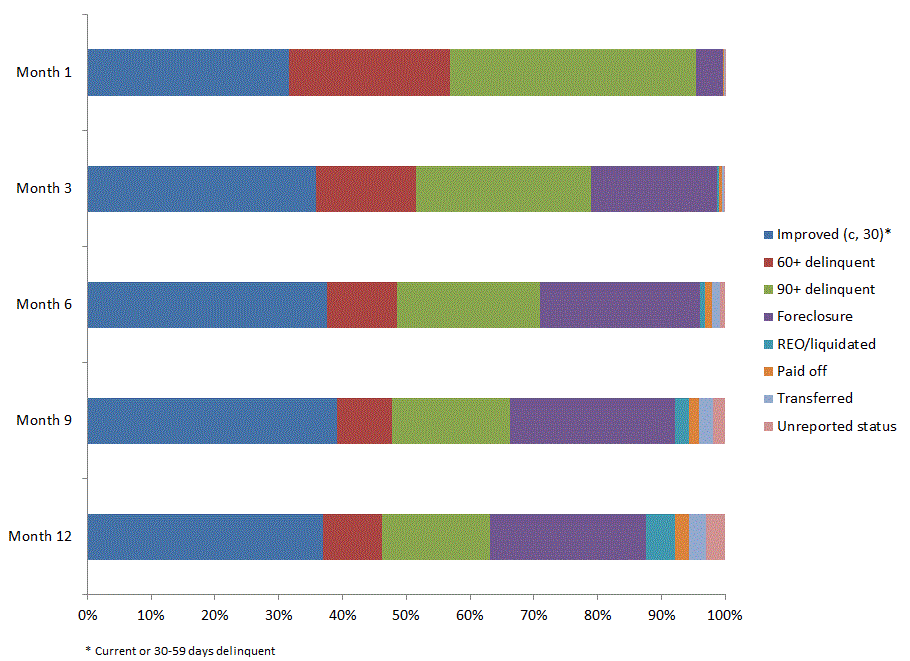
Payoff out of delinquency - via a short sale, for example, or through cash for keys - is a loss-mitigation tool that has been promoted more recently as an alternative to foreclosure. Unfortunately, here too we see that these outcomes seem to occur for only a very small fraction of all delinquent loans. Figure 5 shows the status of loans up to a year after entering delinquency in the first two quarters of 2011. The paid-off category (shown in orange) includes loans paid off via refinances, short sales, and other alternatives such as cash for keys. Just two percent of those entering delinquency during the first six months of 2011 had this outcome at 12 months.
Loans entering 60 days delinquency in Ohio
Source: Lender Processing Services, Inc. (LPS) data; authors' calculations
At 12 months, nearly 37 percent of these delinquent loans had an improved status (shown in dark blue) - that is, they are either current or 30 to 59 days delinquent. Note that the majority of recoveries take place in the first month. Unfortunately, about half of the loans (51%) entering delinquency in the first two quarters of 2011 are still in a distressed status - that is, either 60 or more days delinquent or in foreclosure - a year later.
Overall, the outlook for recovery past the first three months of delinquency is pretty grim. We see from the graphed data that a month after entering delinquency, only a small share of Ohio's distressed loans will recover either on their own or through loss-mitigation activities. Also troubling is that, although the number of loans entering delinquency is declining, loans at risk of entering the delinquent pipeline - such as underwater loans - are on the rise (see Figure 7). So we turn our attention now to the outcomes of these potentially distressed loans.
Treading Water: Homeowners with Negative Equity
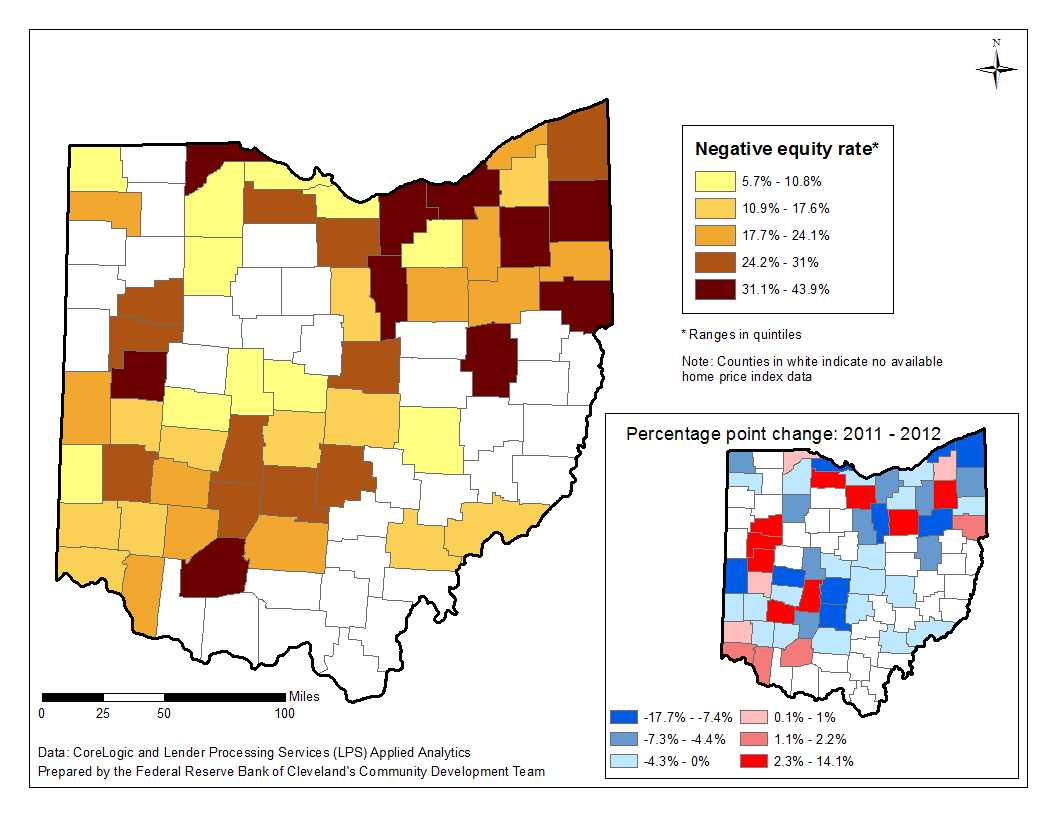
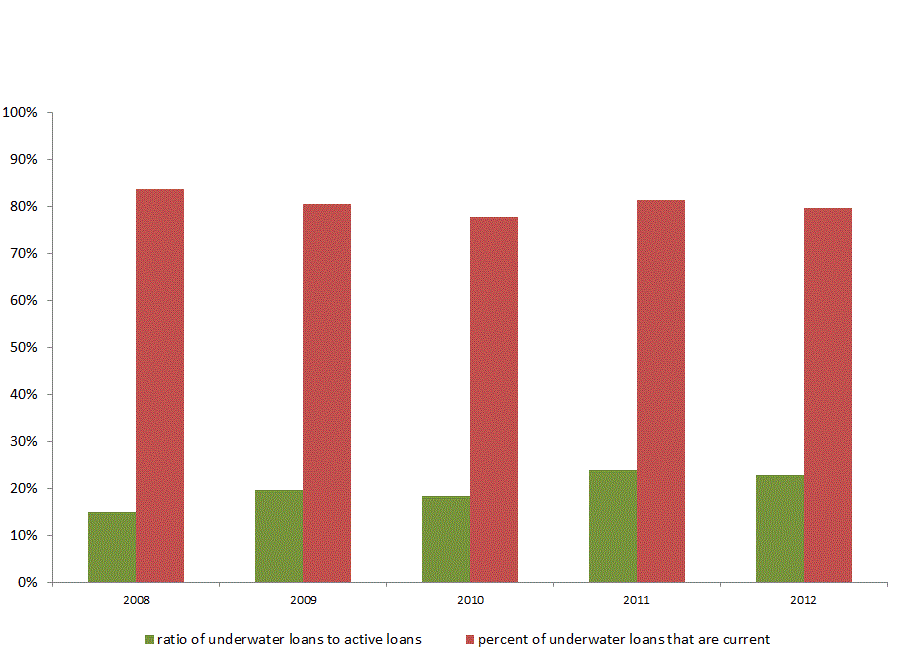
Our first task is identifying underwater loans. We estimate the current value of the home by applying the change in home price indices at the zip-code level to the appraisal amount at origination, and then compare this value to the current loan balance to determine if the loan is underwater. We see in Figure 7 that the share of loans estimated to be underwater has been above 20 percent for the past two years, although, as Figure 6 shows, there is quite a bit of variation across Ohio counties, with higher rates in the northeast region. Of all underwater loans, about 80 percent have remained current over the entire time period.
Relative to loans with positive equity positions, underwater loans are of concern in that they hold a higher risk of entering delinquency when borrowers are faced with a shock such as a job loss or illness. Furthermore, up until recently, borrowers with underwater loans could not take advantage of record-low mortgage rates through refinancing. Thus, facilitating the refinance or short sale of underwater loans - such as through HARP's now-more relaxed requirements - can be considered another loss-mitigation tool and a contributor to the reduction of new delinquencies.
Estimated rates of negative equity in Ohio counties, 2012
Source: Lender Processing Services, Inc. (LPS) and CoreLogic Home Price Index (HPI) data; authors' calculations
Negative equity and loan status in Ohio
Source: Lender Processing Services, Inc. (LPS) and CoreLogic Home Price Index (HPI) data; authors' calculations
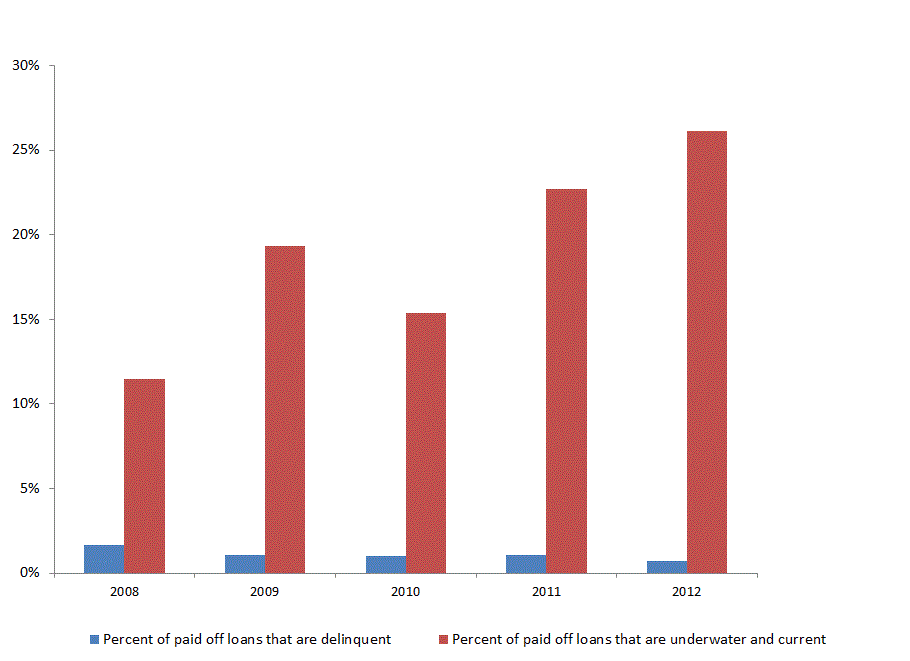
In that sense, it is encouraging to see that as adjustments to HARP are facilitating the refinance of more underwater loans, the share of payoffs on loans that are current but underwater is on the rise. Nearly 26 percent of loans paid off in 2012 were underwater and current, up from about just 11 percent in 2008 (see Figure 8). On the other hand, very few payoffs are being performed on delinquent loans, suggesting that loss mitigation strategies are harder to implement in the later of stages of distress.
Percent payoffs of delinquent loans and underwater loans in Ohio
Source: Lender Processing Services, Inc. (LPS) and CoreLogic Home Price Index (HPI) data; authors' calculations
Conclusion
While loan modifications continue to ease distress for a small fraction of delinquent loans in Ohio, the data suggests that the refinance of current underwater loans - a preventive loss-mitigation tool - may also be contributing to observed reductions in the distressed inventory. Furthermore, the increased rate at which distressed loans are recovering without a loan modification suggests that improved economic conditions are having a positive effect on housing market recovery.
By the Numbers: How We Calculate and Estimate
The Lender Processing Services (LPS) data used in this analysis included first liens originated in Ohio from 2003 through October 2012. The LPS data covers about 65 percent of the residential mortgage market and contains mainly servicing portfolios of the largest residential servicers in the US. The data contain information on loan status, loan terms, and some borrower characteristics such as loan-to-value ratios, debt-to-income ratios, and FICO scores. There is no flag in the LPS data indicating whether the loan has been modified; however, data are updated monthly and indicate changes to the terms of the loan. Using an algorithm developed by researchers from the Federal Reserve Banks of Atlanta and Boston, we flagged loans in the dataset as possible modifications when we see there are changes to the terms of loan, balances, and payments. A loan in our analysis is considered to be modified if it was at least 60 days delinquent in the previous 12 months and it had a change in one or more of the following variables: interest rate, remaining balance, monthly payment, and remaining terms.
Our estimates of underwater loans, or those with negative equity, are based on the method used by the Federal Reserve Bank of Minneapolis and described in an October 2012 report.1 Using a measure of home value in the LPS data and Core Logic's monthly home price indices at the zip-code level, we first estimate a monthly home value by multiplying the home value at origination to the change between the home price index at origination and the home price index in the current time period. Then, we compare this result to the current balance owed on the loan. If more is owed on the loan than the estimated value, the mortgage is considered to be underwater or in a negative equity position. We include only first-lien loans in the calculation since we are unable to determine in the LPS data whether there is a second mortgage or equity line of credit associated with the first lien. Consequently, these estimates may actually underreport the percent of underwater loans.


