

- Share
Foreclosure Patterns in Allegheny County, PA
This is the second report in a series that looks at the geographic distribution of foreclosures in counties located within the Federal Reserve’s Fourth District.

The views expressed in this report are those of the author(s) and are not necessarily those of the Federal Reserve Bank of Cleveland or the Board of Governors of the Federal Reserve System.
Introduction
This is the second report in a series that looks at the geographic distribution of foreclosures in counties located within the Federal Reserve's Fourth District. In this report we focus on Allegheny County, home to the city of Pittsburgh. While it appears that foreclosures have not cut as devastating a path through this county as through some others in the District, such as Cuyahoga County, Ohio, the subject of our initial report, they are nevertheless a problem. This report details patterns in the geographic distribution of foreclosures in Allegheny County and describes the demographic characteristics of neighborhoods where foreclosure rates are highest. In addition, we point out differences that we find distinctive between Allegheny and Cuyahoga Counties. The data sources used in our analysis include the Allegheny County Prothonotary foreclosure filing data, 2005 Home Mortgage Disclosure Act (HMDA) mortgage characteristic data, and U.S. Census Bureau demographic data.
Foreclosure patterns in Allegheny County
According to our analysis, 4,706 foreclosures were filed in Allegheny County in 2007, of which 1,361 were on homes in the city of Pittsburgh.1 The 2007 foreclosure filing rate in Allegheny County was 2.2 per 100 mortgaged units; in Pittsburgh, the rate was 3.2 per 100 mortgaged units.2 As illustrated in Table 1, the number of foreclosure filings dipped slightly from 2006 to 2007, with the rates remaining virtually the same. However, foreclosure filings in Allegheny County have tripled over the past decade, growing from just over 1,700 in 1997 to more than 4,700 in 2007.
| 2006 | 2007 | |||
|---|---|---|---|---|
| Number | Rate | Number | Rate | |
| Pittsburgh, city | 1,444 | 3.4 | 1,361 | 3.3 |
| Suburbs | 3,491 | 2.0 | 3,345 | 1.9 |
| Allegheny County | 4,935 | 2.3 | 4,706 | 2.2 |
Sources: U.S. Census Bureau and Allegheny County Prothonotary
In 2007, the municipalities of Penn Hills and McKeesport experienced the largest numbers of foreclosure filings in Allegheny County, with 327 and 148 respectively. Within Pittsburgh, two neighborhoods had the greatest numbers of foreclosure filings: Sheraden, with 69, and Perry South, with 67.
Map 1. 2007 Foreclosure Filing Rate per 100 Mortgaged Units in Allegheny County, PA
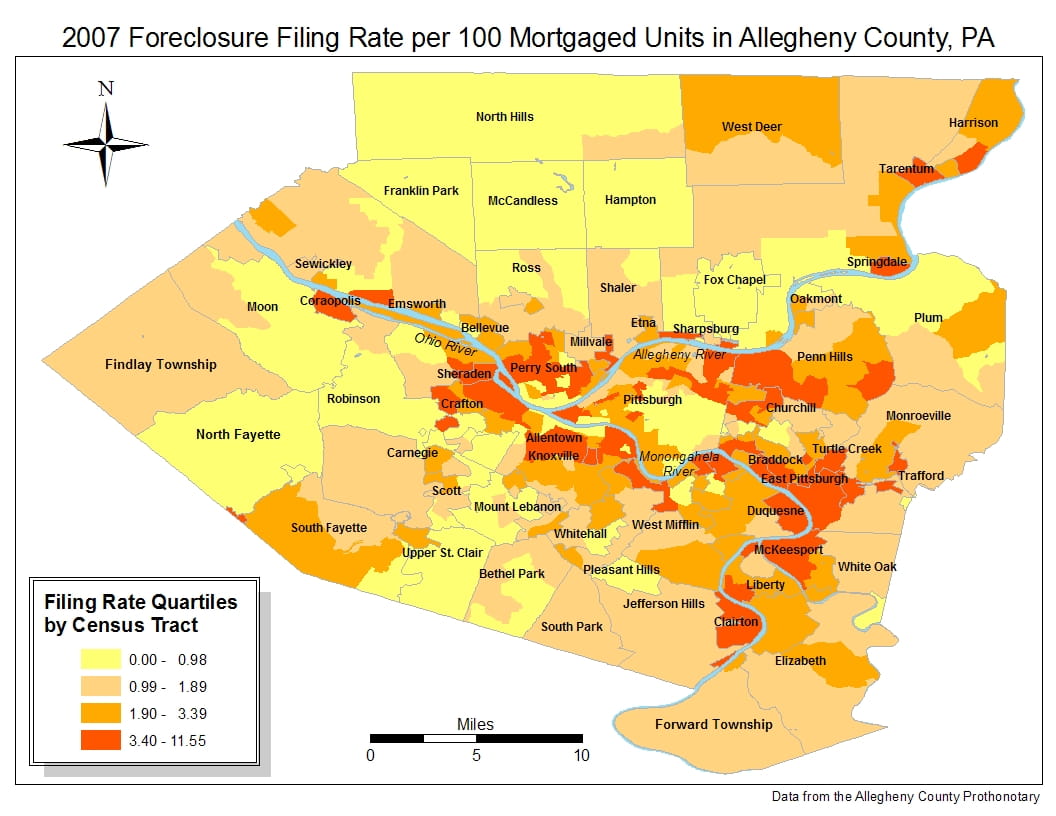
Sources: Data from the Allegheny County Prothonotary
As illustrated in Map 1, the highest rates of foreclosure are found in communities along the three rivers that define the local geography - the Ohio, Allegheny, and Monongahela Rivers - in both Pittsburgh and Allegheny County.3The very highest rates of foreclosure are found in four communities: Perry South, a neighborhood on Pittsburgh's north side (8.6 filings per 100 mortgaged units), the municipality of East Pittsburgh (8.1 filings per 100 mortgaged units), and the neighborhoods of Allentown (7.4 filings per 100 mortgaged units) and Knoxville (6.9 filings per 100 mortgaged units), both located just south of the Monongahela River in Pittsburgh. The map also shows high rates of foreclosure in the municipalities of Braddock, Clairton, Duquesne, McKeesport, and Turtle Creek.
In comparing the numbers of foreclosure filings in Allegheny County to those in Cuyahoga County, we do see large differences. Nearly three times as many homes were foreclosed upon in Cuyahoga County in 2007 than in Allegheny County, yet Cuyahoga County has only 13 percent more mortgaged units than Allegheny County.4
Tract characteristics by foreclosure filing rates
The Allegheny County foreclosure filing data do not provide information either on the demographics of borrowers in foreclosure or on the characteristics of loans in foreclosure. Lacking that level of specificity, we chose to examine selected demographic and loan characteristics within neighborhoods that have high rates of foreclosure. To do so, we aggregated the census data and HMDA data by tract, and then matched it with foreclosure filing data aggregated by census tract.
Tracts were ranked from highest to lowest based on their foreclosure filing rates and grouped into four equal parts, or quartiles (tracts with the highest foreclosure rates are in the highest quartile; tracts with the lowest foreclosure filing rates are in lowest quartile). As illustrated in Table 2, the foreclosure filing rate in the highest quartile was 4.9 filings per 100 mortgaged units, which is twice the rate of the third quartile, five times the rate of the second quartile, and approximately seven times the rate of the lowest quartile.
| Quartiles | ||||
|---|---|---|---|---|
| Tract characteristics | Lowest | Second | Third | Highest |
| Number of census tracts | 103 | 103 | 104 | 103 |
| Foreclosure filings | 499 | 1,013 | 1,261 | 1,744 |
| Foreclosure filing rate | 0.7 | 1.4 | 2.5 | 4.9 |
| Foreclosure rate (min-max) | 0-.98 | .99-1.89 | 1.9-3.39 | 3.41-11.55 |
| Percent African-American | 3.6 | 4.2 | 15.7 | 31.7 |
| Percent minority | 8.8 | 7.3 | 18.5 | 35.5 |
| Percent high-cost loans | 13.6 | 20.1 | 29.1 | 41.4 |
| Percent subprime lenders | 8.5 | 12.7 | 16.4 | 22.2 |
| Percent owner-occupied | 73.4 | 73.5 | 64.0 | 54.1 |
Sources: U.S. Census Bureau, Allegheny County Prothonotary, and HMDA 2005 data
Looking at selected demographics within each foreclosure-filing-rate grouping, we found that median household income is three times higher in the lowest quartile than in the highest quartile. Almost one-third (32%) of the population in the highest-foreclosure-rate tracts is African American, compared to 16 percent in the third quartile and 4 percent in the second and lowest quartiles. Tracts with the highest foreclosure-filing rates have an owner-occupancy rate of 54 percent, compared to almost 75 percent in the tract groupings with the lowest foreclosure rates.
When examining selected loan characteristics, we found that 41 percent of the loan originations in the highest-foreclosure-rate tracts are high-cost loans, compared to 29 percent in the third quartile and about 14 percent in the lowest quartile.5Subprime lenders originated 22 percent of the loans in the highest-foreclosure-rate tracts, compared to about 9 percent in the lowest-rate tracts.
Next, we correlated tract-level foreclosure filing rates in Allegheny County with selected demographic and loan characteristics. Correlations examine the statistical relationship between two variables and tell us whether the variables move in the same or different directions, as well as provide information regarding the strength of the correlation: The closer to 1 or -1 that a correlation is, the stronger the relationship between the two variables.
Figure 1. Correlations of foreclosure-filing rates with select variables
Sources: U.S. Census Bureau and Allegheny County Prothonotary
While correlation does not tell us anything about causation, it does characterize areas with higher foreclosure-filing rates. These rates in Allegheny County - as in Cuyahoga County - are positively correlated with the following variables: the percent of high-cost loans; the percent of loans originated by subprime lenders; the percent of loans made by nondepository institutions; the percent of the population that is unemployed; the percent of the population without a high school degree; and the percent of the population that is African American. However, the strength of the correlations varied across these two counties, with Cuyahoga County showing a statistically stronger relationship between these neighborhood characteristics and filing rates of foreclosure.6
Given that high rates of foreclosure filings are found in areas both within and outside the city of Pittsburgh, we also examined whether the relationship between neighborhood characteristics and filing rates was comparable within and outside the city. As illustrated in Figure 1, we found that the demographics we examined were more strongly associated with foreclosure-filing rates in the suburban areas of Allegheny County than in Pittsburgh, and that these differences were significant. Median household income was the variable most strongly correlated with foreclosure-filing rates in both the suburban areas and within the city of Pittsburgh.
Tract characteristics by income level
To further explore the characteristics of the tracts most affected by foreclosure, we grouped the data into four equal parts based on median household income. Tracts with the highest median incomes are in the highest quartile, and tracts with the lowest median incomes are in the lowest quartile. As illustrated in Map 2, the tracts with the lowest incomes align fairly closely with tracts that had the highest rates of foreclosure filings, except in some neighborhoods located near Pittsburgh's Central Business District, where we observed lower incomes but not high foreclosure rates. This may be attributable to the area's publicly subsidized housing as well as its lower levels of residential housing overall.
Map 2. 1999 Median Household Income for Allegheny County
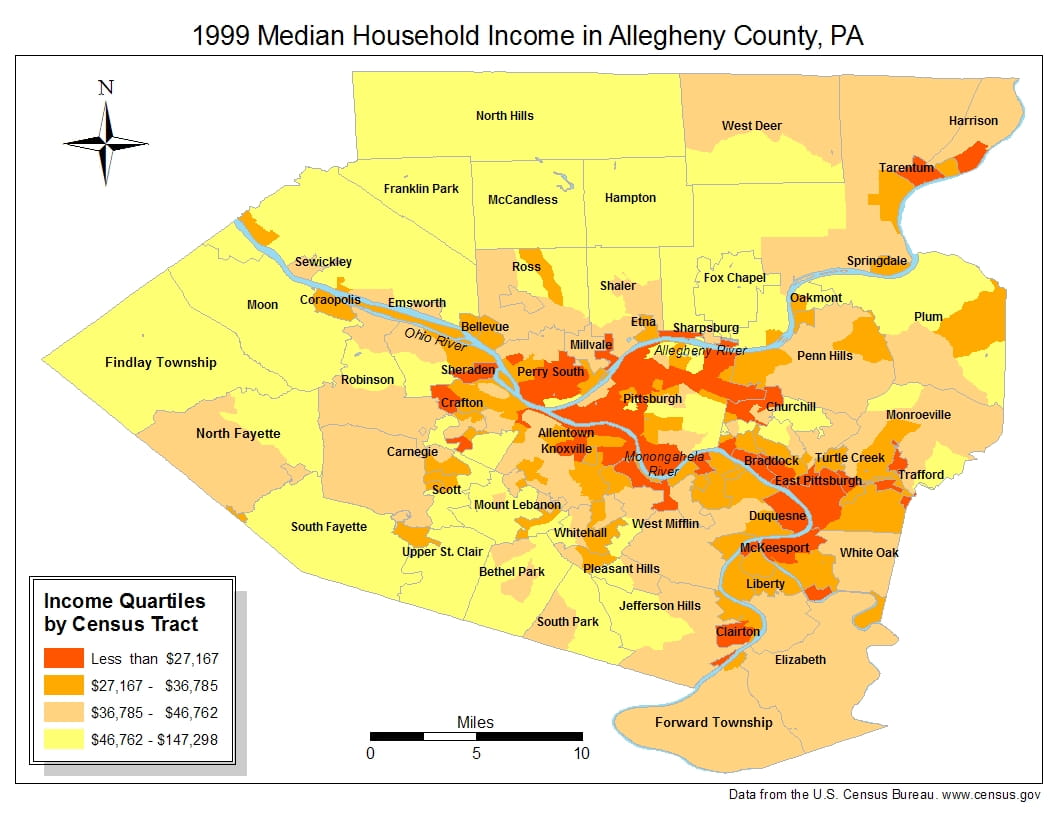
Sources: Data from the U.S. Census Bureau www.census.gov
As shown in Table 3, in the lowest-income quartile, the foreclosure-filing rate was 4.2 filings per 100 mortgaged units, compared to less than 1 filing per 100 mortgaged units in the highest-income quartile.
| Quartiles | ||||
|---|---|---|---|---|
| Tract characteristics | Lowest | Second | Third | Highest |
| Income (min-max) | $7,042-$27,159 | $27,160-$36,760 | $36,761-$46,737 | $46,738 or more |
| Foreclosure filings | 1,063 | 1,344 | 1,264 | 846 |
| Foreclosure filing rate | 4.2 | 2.8 | 1.9 | 0.9 |
| Percent African-American | 42.3 | 10.6 | 5.7 | 2.1 |
| Percent high-cost loans | 38.1 | 32.0 | 24.2 | 13.8 |
| Rate above prime for high-cost loans | 5.4 | 5.3 | 5.3 | 5.3 |
| Originations by nondepository institutions | 26.8 | 28.3 | 28.3 | 26.0 |
Sources: U.S. Census Bureau, Allegheny County Prothonotary, and HMDA 2005 data
African Americans make up a much larger percentage of the lowest-income quartile than the other quartiles (42 percent, versus 11 percent in the second-income quartile, 6 percent in the third, and just 2 percent in the highest-income quartile). Not surprisingly, a higher percentage of the loan originations in the lower-income tracts were high-cost when compared to the other income groupings. In the highest-income tracts, about 14 percent of the originations were high-cost, compared to 38 percent of originations in the low-income tracts.
To examine how Allegheny County compared to the rest of Pennsylvania with regard to high-cost lending as defined by HMDA, we grouped the data into the same income quartiles we used for Allegheny County. We found that the percent of high-cost lending in Allegheny County was similar to or slightly higher than the percent of high-cost lending in the state as a whole for every income group we examined. In the lowest-income tracts, for example, 38 percent of the loan originations were high-cost in Allegheny County, compared to 37 percent in the lowest-income tracts of the state. The largest difference between Allegheny County and the rest of the state was in the second-income quartile, where 32 percent of the county's originations were high-cost, compared to about 28 percent in the state.
The percent of originations by nondepository institutions varied little across the income quartiles in Allegheny County. No more than 30 percent of the loans were originated by nondepositories in Allegheny County, regardless of income quartile. At the state level, these percentages were even smaller; we found that no more than 26 percent of the originations were made by nondepositories, regardless of income grouping. The largest difference between Allegheny County and the state was found in the second-income grouping, where 28 percent of Allegheny County originations were made by nondepositories, compared to 23 percent in the state.
This finding was quite different when examining originations by nondepository institutions across income quartiles in Cuyahoga County. In the lowest-income quartile in Cuyahoga County, a majority (56%) of originations came from nondepository institutions. Compared to Allegheny County, only the highest-income quartile in Cuyahoga County had a smaller percentage of loans originated by nondepository institutions (25% for Cuyahoga versus 26% for Allegheny).
Table 3 also shows that lower-income borrowers were more likely to obtain a high-cost loan (although high-cost loans were provided to borrowers in each income quartile). The data show that in Allegheny County, high-cost loans were distributed across many lenders regardless of income grouping. No one lender originated more than 6 percent of the high-cost loans, which held true across each income quartile. Conversely, in Cuyahoga County's lowest-income quartile, a single lender originated 34 percent of all high-cost loans, and in its second-income quartile, the very same lender originated 21 percent of the high-cost loans.
Conclusion
Our analysis shows there are pockets of high-foreclosure-rate tracts throughout Allegheny County, both within and outside the city of Pittsburgh. Higher rates of foreclosure filings are found in Perry South, located in the northwest area of Pittsburgh; in the neighborhoods of Knoxville and Allentown; and in the municipalities of Duquesne, McKeesport, and Clairton. In areas with higher rates of foreclosure filings, we also found lower incomes, higher percentages of African-American residents, and lower rates of owner occupancy. Too, those areas with the lowest incomes had characteristics similar to areas with the highest foreclosure-filing rates: higher percentages of African Americans and greater incidences of high-cost loans.
These findings mirror what we found in Cuyahoga County. However, we also detected some notable differences between the two counties. For one, in Allegheny County, depository institutions were the dominant loan originators across every income grouping, while in Cuyahoga County the percentage of originations by depository institutions differed markedly depending on the income grouping. No single high-cost loan originator had a majority share of the market in Allegheny County - or in the state of Pennsylvania - regardless of income grouping; in Cuyahoga County, on the other hand, the lower-income groups were served by a very small number of high-cost lenders.
Subsequent work on this topic might include comparable analyses for other Pennsylvania counties to discern similarities and differences among the geographic patterns of foreclosure and the demographic and lending characteristics of high-foreclosure-rate areas of the state. Also, more remains to be learned about the differences we observed in the penetration of nondepository institutions within Allegheny and Cuyahoga Counties. Additional research to explore this issue may help to illuminate these distinct differences.
Footnotes
- The foreclosure filings counts represent an unduplicated count of parcels in each year.
- Foreclosure rates represent the number of foreclosure filings in a given year divided by the number of mortgaged units in that year, for a given geography. The number of mortgaged units in 2006 and 2007 is an estimate based on Census Bureau and American Community Survey data available in 2000 and 2006. The 2006 estimated foreclosure rate for each census tract is obtained by dividing the 2006 number of foreclosure filings in the tract by an estimate of the 2006 number of mortgaged units in that tract. The U.S. Census Bureau provides the 2000 census value for mortgaged units for the tract and for Cuyahoga County. It also provides an American Community Survey estimate of 2006 mortgaged units for the County. Given this information, we apply the County rate of increase to the 2000 census value of mortgaged units in the tract to obtain a 2006 figure of mortgaged units for the tract. To obtain an estimate of the 2007 mortgaged units, we apply the rate of increase between 2000 and 2006 of mortgaged units to the 2006 number of mortgaged units. The result of that calculation is then added to the 2006 number of mortgaged units to arrive at our estimate of 2007 mortgaged units.
- Allegheny County contains 80 neighborhoods within the city of Pittsburgh plus 130 municipalities outside Pittsburgh.
- There were 13,846 foreclosure filings in Cuyahoga County in 2007 and 4,706 foreclosure filings in Allegheny County in 2007. Estimates of the numbers of mortgaged units in 2007 were calculated based on the actual numbers of mortgaged units in both of these counties in 2000.
- High-cost loans are defined by HMDA as loans whose rates exceed by at least 3 percentage points the difference between the APR on a loan and the rate on Treasury securities of comparable maturity.
- Since correlation coefficients are a measure of a linear relationship, we used the logs of the variables to test for statistical significance to account for their nonlinear relationship.