- Share
Concentrated Poverty: Online Appendix
The online appendix has a technical discussion about the sample and the variables used in the construction of poverty rates in 1970 and 2000.
The views authors express in Economic Commentary are theirs and not necessarily those of the Federal Reserve Bank of Cleveland or the Board of Governors of the Federal Reserve System. The series editor is Tasia Hane. This paper and its data are subject to revision; please visit clevelandfed.org for updates.
In 1970 census tracts did not cover the entire area of the United States; only 73 percent of the U.S. population lived in census tracts. For the sake of consistency, we examined the populations living in the same set of 615 counties at each decennial census. These counties are determined as all counties with a census tract in 1970. In 2000 it was again the case that 73 percent of the U.S. population lived in our sample census tracts.
Another issue is that differences in poverty rates in 1970 and 2000 may simply reflect differences in measurement because the variables used to measure the number of poor and nonpoor in a census tract are different in these years. In 1970 the number of poor in each census tract is computed by adding the aggregate number of persons in families below the poverty level (this variable comes from the CNT4P file) to the number of unrelated individuals 14 years old and over under the 7 poverty level (this variable is also found in the CNT4P file). The number of nonpoor is found by subtracting this created variable from the 100 percent population count variable from the NT126 file.
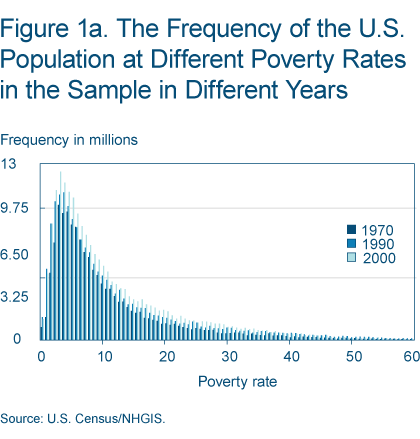
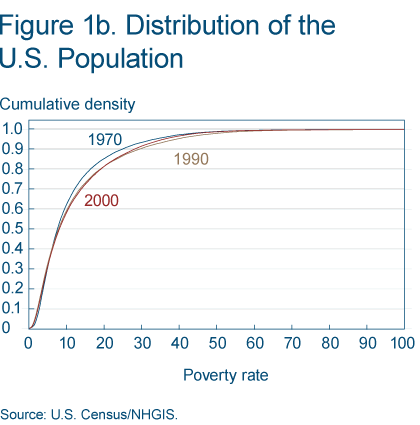
The number of poor and nonpoor are variables directly reported by the census in subsequent years. In 2000 there are two variables indicating the number of people living in families whose incomes were below or above the poverty level. These variables are from the 2000SF4 file, and are taken from the subpopulation of individuals for whom poverty status is determined. The distributions of these created variables are displayed in figures 1a and 1b.
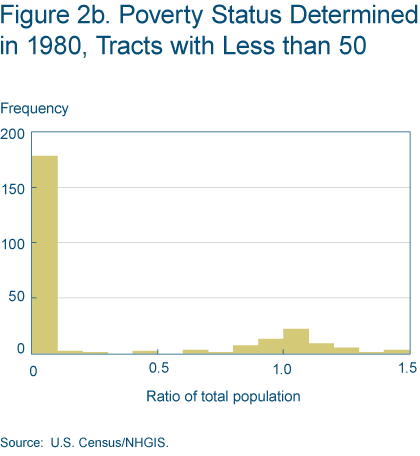
A first concern is that poverty status might not be determined for much of the total population. Figure 2a shows that this is not the case. In almost all census tracts poverty status is determined for most individuals. There is a group of census tracts for which no one’s poverty status is determined.
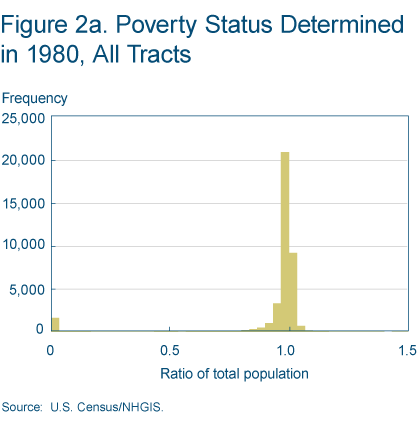
Figure 2b shows that census tracts with less than 50 inhabitants are disproportionately affected by this problem, so we drop such census tracts from our samples in both 1970 and 2000.
Figures 2d- 3b show results from 1980 using these different methods of constructing the number of poor and nonpoor in census tracts. Under the first definition we use the variables reported in the census (as in 2000), and under definition 2 we construct the numbers of poor and nonpoor as we did in 1970. Figure 2d shows that we might still be concerned that differences in results are being driven by discrepancies between these two definitions. As we can see in the figure, the second definition does in some instances under-report the poverty rate.
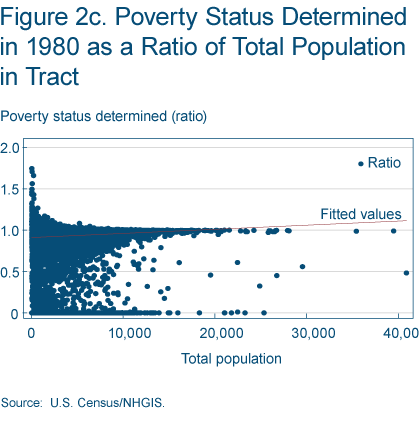
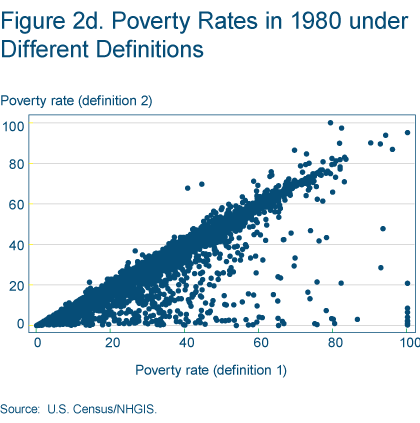
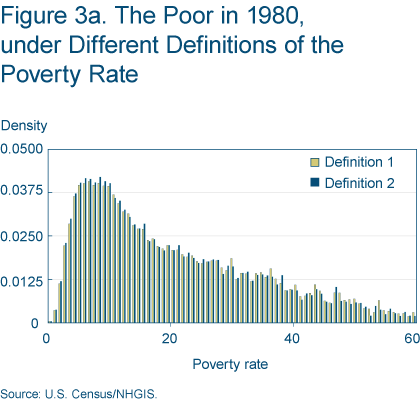
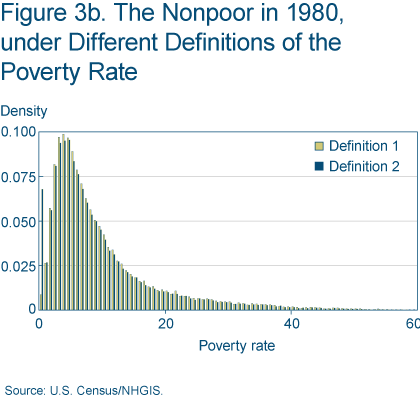
However, we do not believe these differences are large enough to have important consequences for our empirical results. The median census tract’s percentage of the total population for which poverty status is determined is 99.4 percent, and a regression of percentage determined on total population yields a regression coefficient of 4.15e-06 with a standard error of 4.31e-07 (figure 2c). A regression of poverty constructed under the first definition on poverty constructed under the second definition yields a coefficient of 1.0071 with a standard error of 0.0013 (figure 2d). And finally, figures 3a and 3b show that the distributions of the poor and nonpoor over neighborhoods vary only slightly under the different definitions for constructing the poverty variable. See Poverty and Place: Ghettos, Barrios, and the American City, by Paul A. Jargowsky (1997) for a detailed discussion of related issues.
Suggested Citation
Aliprantis, Dionissi, and Mary Zenker. 2011. “Concentrated Poverty: Online Appendix.” Federal Reserve Bank of Cleveland, Economic Commentary 2011-26. https://doi.org/10.26509/frbc-ec-201126
This work by Federal Reserve Bank of Cleveland is licensed under Creative Commons Attribution-NonCommercial 4.0 International


