

- Share
Assessing Layoffs in Four Midwestern States during the Pandemic Recession
We use WARN data to assess layoffs in four Midwestern states during the current pandemic-induced recession—Kentucky, Ohio, Pennsylvania, and West Virginia. The data come from the advance layoff notices filed under the Worker Adjustment and Retraining Notification (WARN) Act. We find that the number of workers affected by layoff announcements rose sharply in the second half of March and April, and unexpected changes in economic conditions meant that workers received little advance notice before layoff. Layoff announcements have affected workers across these four states, and workers in mining and leisure and hospitality have been affected the most. Most recently, the number of workers affected by WARN notices has almost returned to prerecession levels.

The views authors express in Economic Commentary are theirs and not necessarily those of the Federal Reserve Bank of Cleveland or the Board of Governors of the Federal Reserve System. The series editor is Tasia Hane. This paper and its data are subject to revision; please visit clevelandfed.org for updates.
The suddenness and depth of the current recession is unprecedented in modern US history. National nonfarm payroll employment fell by 20.5 million from March to April, and the unemployment rate increased by over 10 percentage points to 14.7 percent. Initial unemployment insurance (UI) claims, one indicator of layoffs, rose to almost 7 million in the week ending March 28, 2020. Although conditions have moderated—nonfarm payroll employment has increased by about 7 million since April, the unemployment rate fell to 11.1 percent in June, and initial UI claims have leveled off at about 1.5 million—labor market distress still appears worse than at the end of the twin recessions of the early 1980s and the 2007–2009 recession.
To assess quickly evolving economic conditions during the current recession, policymakers and analysts require timely and reliable labor market indicators. Unfortunately, such indicators are difficult to obtain, especially those that provide details about state- and industry-level conditions. While initial UI claims provide weekly data that are available at the state level, they do not typically provide industry information, and during the recent crisis, processing delays, duplicate claims, and fraud have made the indicator less accurate than in the past.1 Layoff measures in the Current Population Survey (CPS) are available only at a monthly frequency, and they reflect small sample sizes at the state level. Layoff measures in the Job Openings and Labor Turnover Survey (JOLTS) are also only monthly and unavailable at the state level.
In this Commentary we use advance layoff announcements filed by establishments in accordance with the WARN Act to study the onset and evolution of anticipated layoffs during the current recession. These data have four advantages. First, the WARN data are timely, with most states publishing their WARN notices on a daily or weekly schedule. Second, these data are geographically rich, with most notices including a company name and address. Third, because these data include company names, we can identify industries. Fourth, the amount of advance notice that businesses provide can proxy for expectations about economic conditions. We find that these features of the WARN data complement existing measures of layoffs well, even though the WARN Act does not cover smaller establishments. We focus on the impact of the current recession on states in the Federal Reserve’s Fourth District (4D) including Kentucky, Ohio, Pennsylvania, and West Virginia.
WARN Filing Requirements
Under the WARN Act, employers with 100 or more full-time workers (or 100 or more workers who work at least a combined 4,000 hours a week) are required to inform workers, as well as the local government and the state’s dislocated worker unit, with written notices at least 60 days in advance of a potential plant closure or mass layoff. WARN defines plant closures as shutdowns for more than six months at a single site of employment if the shutdown results in an employment loss for 50 or more employees. WARN defines a mass layoff as a layoff that lasts for six months or longer and affects 500 or more employees, or, for businesses with employment losses between 50 and 499, at least 33 percent of the workforce. For more details about the WARN data, please see Krolikowski, Lunsford, and Yang (2019).
There are exceptions that allow establishments to file notices with fewer than 60 days’ notice under certain circumstances, but these exceptions do not reduce the usefulness of the WARN data during the current crisis. Employers can provide fewer-than-60-day notices for the following exceptions: closing of a faltering company, unforeseeable business circumstances, or a natural disaster. During the recent crisis, many establishments can cite “unforeseeable business circumstances” due to the sudden and unprecedented nature of the pandemic. Even when an exception applies, the Department of Labor still requires employers to provide notice “as soon as it is practicable,” and the employer must provide a reason for why less than 60 days’ notice is given. In our data, employers often state that they are issuing less than 60 days’ notice due to the COVID-19 pandemic.
The Current Crisis and the 2007–2009 Recession
WARN data suggest that the onset of the current crisis was largely unexpected by businesses, that this surprise was larger during the current crisis than during the 2007–2009 recession, and that the most recent layoffs were also unexpected. These conclusions are suggested by the fact that the advance notice for these layoffs fell short of the 60 days’ requirement.
We compute the advance notice duration by taking the difference between the expected layoff date and the date of notification for each WARN notice. We depict how the monthly median advance notice duration changes over time in figure 1. The median advance layoff duration is typically no less than about 60 days, which is the advance notice duration required by the WARN Act. However, this advance notice duration fell to about zero at the onset of the recent crisis (in March, April, and May 2020), which suggests that the median business was issuing WARN notices about the same day it started laying off workers.
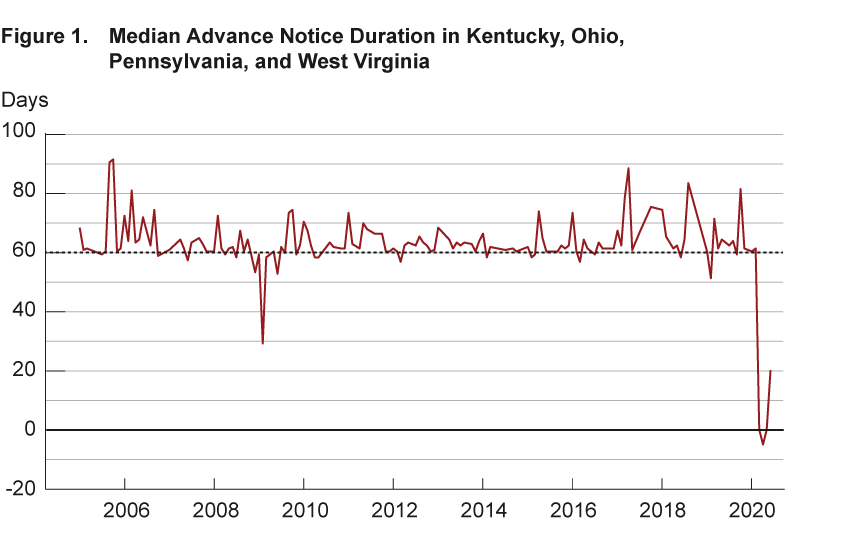
Source: Authors’ calculations with data from states’ labor agencies.
Notes: The WARN Act requires at least 60 days’ notice denoted with a horizontal dashed line. When the red line falls below the horizontal solid line at zero, layoffs begin before the notice date. The median is calculated if there are at least 15 observations per month. Prior to March 2011, the median calculation excludes West Virginia because the data for that state are not available. The last observation is June 2020.
During the 2007–2009 recession, the median advance notice duration was about 60 days, except in February 2009 when it fell to about 30 days. This was shortly before national nonfarm payroll employment declined by its largest amount during that recession in March 2009 (−800,000). As such, these data suggest that the pandemic caused a larger surprise to businesses than the 2007–2009 recession.
Finally, the median advance notice duration was about 20 days in June 2020, which falls short of the standard 60 days and suggests that businesses continue to face unexpected economic conditions and must lay off workers at short notice.
Another indication of the unexpected nature of the current crisis is the sharp rise in both WARN notices and initial UI claims, as shown in figure 2 (panel A). The figure depicts the 6-week moving averages of the number of workers affected by WARN notices and the number of initial UI claims in 4D states since mid-February 2020. The number of workers affected by WARN notices rose by about 5,000 (400 percent) from February to late April this year. Initial UI claims rose by about 300,000 (1,000 percent) during the same period. Initial UI claims peaked one week before the number of workers affected by WARN notices peaked, and both series have been declining since the end of April.
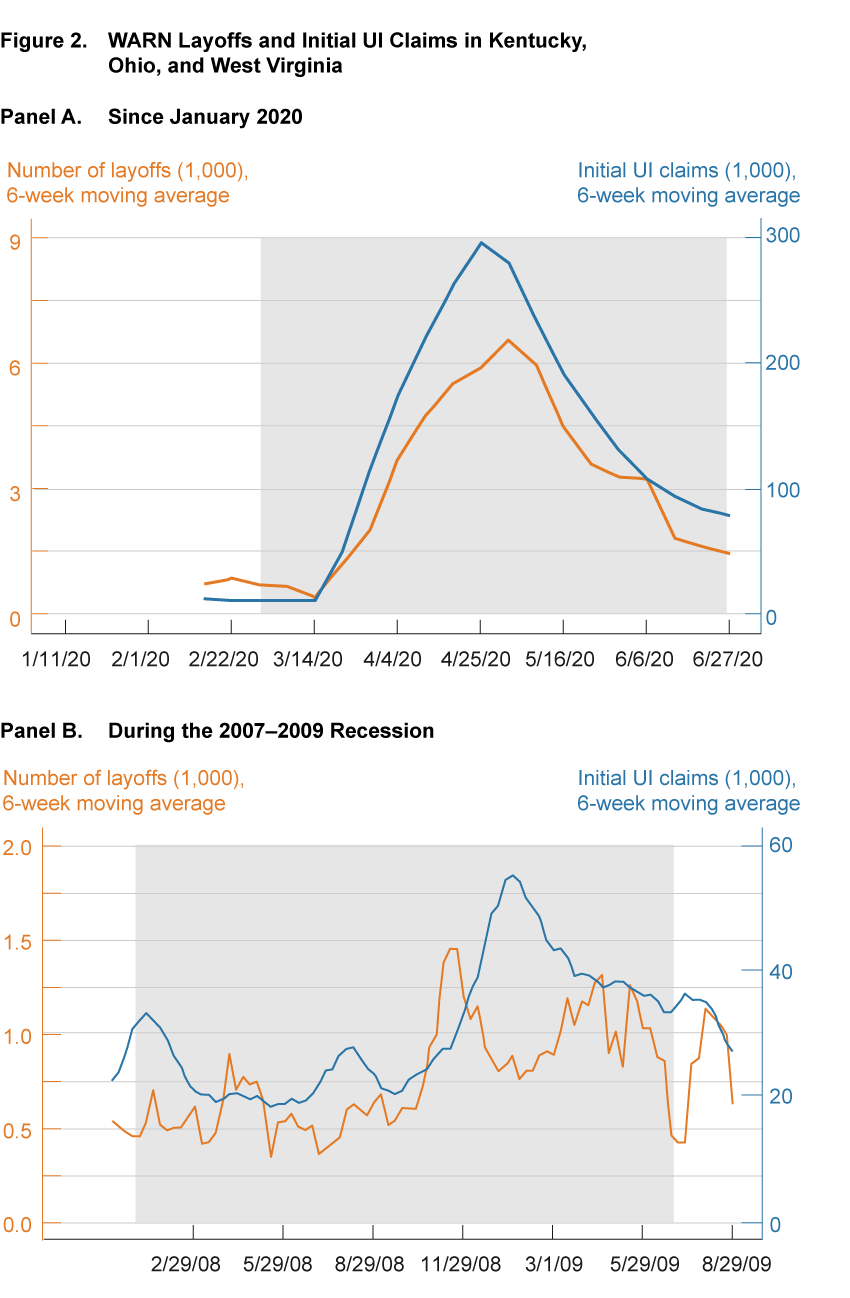
Source: Authors’ calculations with data from states’ labor agencies.
Notes: Pennsylvania is excluded because the state provides only monthly WARN data. The gray recession shading is based on the daily indicator from FRED, https://fred.stlouisfed.org/series/USRECD. The last observation in panel A is June 27, 2020. The last observation in panel B is August 29, 2009.
The sharp increases in these series at the onset of the current recession were much more dramatic than during the 2007–2009 recession and reached substantially higher levels, as shown in figure 2 (panel B). In particular, during the first few weeks of the 2007–2009 recession, the number of workers affected by WARN notices stayed roughly the same. And the number of workers affected by WARN notices peaked at the end of 2008 at only about 1,000 above their levels prior to the 2007–2009 recession. The initial UI claims data confirm that the onset of the current recession involved a much sharper increase and higher levels of layoffs than the 2007–2009 recession.
The most recent WARN data suggest that anticipated layoffs have almost returned to prerecession levels, in contrast to the initial UI claims data, as shown in figure 2 (panel A). As of June 27, 2020, the number of workers affected by WARN notices has almost returned to levels that we saw at the beginning of 2020 (about 1,500 workers per week). Because the median advance notice duration is about 20 days in June (figure 1), the WARN data suggest that anticipated layoffs over the next 20 days have presently subsided. By contrast, initial UI claims in 4D states continue to stay well above their prerecession levels. In particular, prior to the recession initial UI claims were about 11,000 per week, but at the end of June they were about 80,000. These different signals suggest that either initial UI claims data are currently overstating the number of layoffs, which would be consistent with processing delays and duplicate and fraudulent claims, or that initial UI claims will fall over the next few weeks.2
WARN Data by Geography
During the current recession, businesses from across 4D states have filed WARN notices, with some counties experiencing particularly high levels of distress. Figure 3 shows the cumulative number of workers affected by WARN notices as a fraction of annual average 2019 private county employment, from March to June 2020 across counties in 4D states.
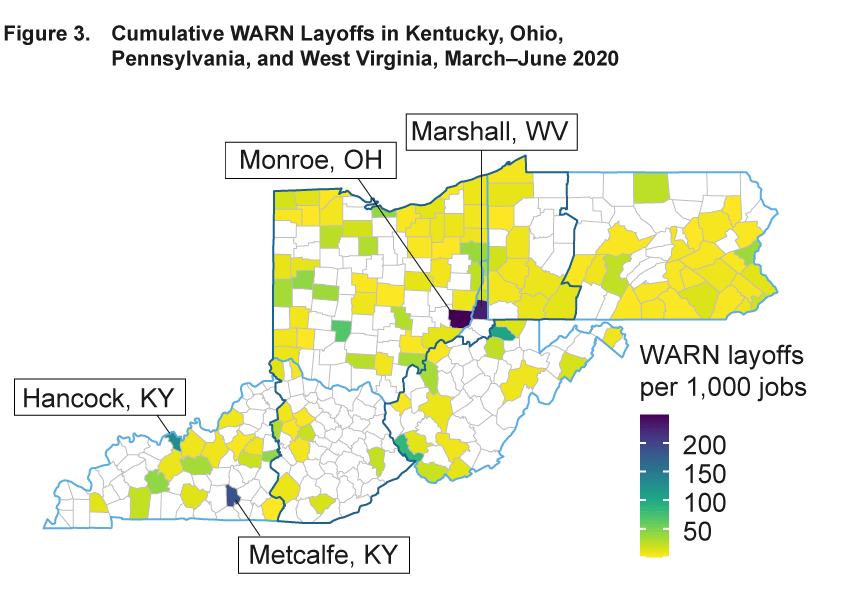
Sources: WARN layoffs are from the states’ labor agencies. 2019 annual average county jobs data are from the Bureau of Labor Statistics.
Notes: State boundaries are outlined in light blue, and the 4D boundary is outlined in dark blue.
The number of workers affected by WARN notices has increased in counties throughout the Fourth District, with sharper increases in central Kentucky, the west and southeast of Pennsylvania, the West Virginia panhandle, and throughout Ohio. Metcalfe and Hancock Counties in Kentucky, Marshall County in West Virginia, and Monroe County in Ohio have been particularly hard hit relative to the size of their workforces. WARN data indicate large layoff announcements by energy companies in Marshall, Metcalfe, and Monroe Counties. For example, on April 2 of this year, Marshall County Coal Company announced that it expected to lay off over 550 workers on June 6. On March 31, Sumitomo Electric Wiring Systems announced it had indefinitely furloughed 259 workers on March 23. Finally, on April 2, the American Energy Corporation in Monroe County announced that it expected to lay off over 100 workers on May 2.3 Only two companies have issued WARN notices in Hancock County since March (Domtar Paper Company, which laid off almost 400 workers, and Dal-Tile Corporation, which laid off almost 70 workers), but given the county’s small workforce, these were relatively large layoff announcements.
Both WARN data and initial UI claims data provide valuable information about the distribution of layoffs across Ohio. Both data sources suggest that the west, northwest, and northeast areas of Ohio have seen more layoffs than the rest of the state, as shown in figure 4. For example, both WARN data and initial UI claims data suggest that Crawford, Erie, Fayette, and Shelby Counties have seen a large number of layoffs. Along the I-77 corridor and slightly to the west of its intersection with I-70, the UI data also suggest more layoffs, although the number of workers affected by WARN notices was not particularly high in this area. As discussed above, a large proportion of workers were affected by WARN notices in Monroe County relative to its size. However, initial UI claims did not rise more in that county compared with other counties in the state. The WARN data are somewhat sparser than the initial UI claims data, mainly because only plants with at least 100 workers are required to file a WARN notice and some notices do not provide a unique address, preventing us from determining which county is affected.4
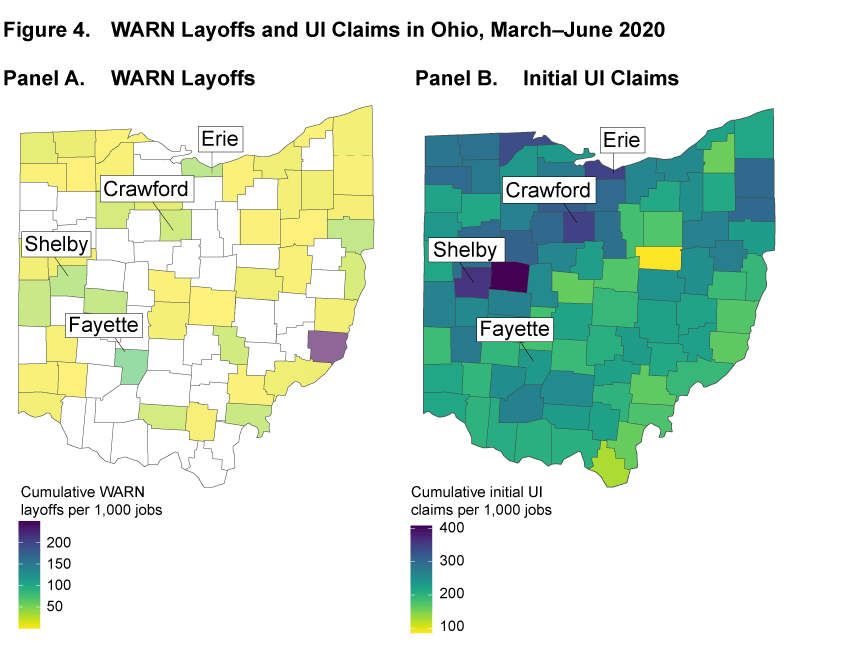
Sources: WARN notices and initial UI claims are from the Ohio Department of Job and Family Services. 2019 annual average county jobs data are from the Bureau of Labor Statistics.
WARN Data by Industry
As a fraction of employment, the number of workers affected by WARN notices has been concentrated in mining and leisure and hospitality, and, across many industries, most workers were notified in April. Figure 5 shows the number of workers affected by WARN notices in each industry as a fraction of average 2019 private employment in each industry and the timing of notices from March to June. Layoff announcements have affected workers in mining, quarrying, and oil and gas extraction the most, consistent with our geographical analysis above about Marshall and Monroe Counties. Consistent with national data on the rates of layoffs and discharges from JOLTS, layoff announcements have also heavily affected workers in leisure and hospitality, including accommodation and food services and arts, entertainment, and recreation.5 In most industries, layoff announcements peaked in April and have declined since then. Consistent with the timing of stay-at-home orders across 4D states, layoff announcements in arts, entertainment, and recreation peaked in March. Layoff announcements in this industry have remained high through June. Layoff announcements in the information industry rose from March to May before subsiding in June.
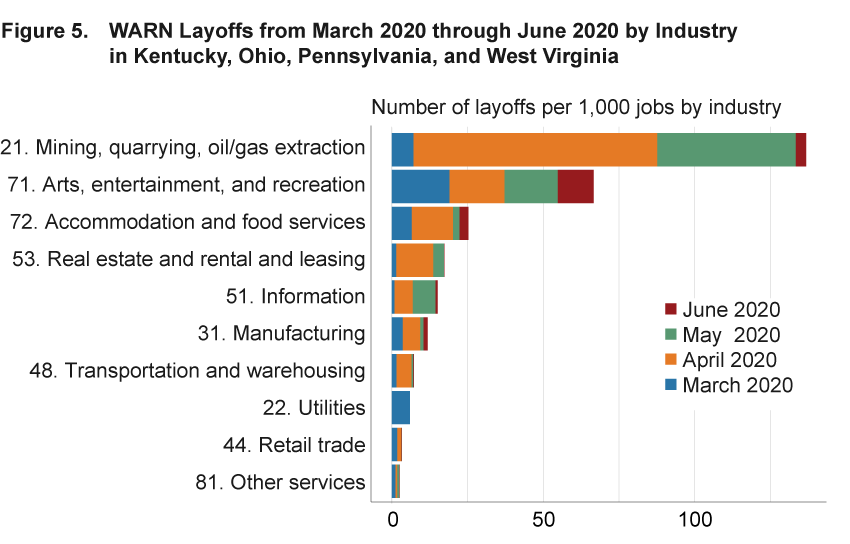
Sources: WARN layoffs are from states’ labor agencies. 2019 annual average state jobs data are from the Bureau of Labor Statistics.
Notes: The two digits in the industry label correspond to codes in the North American Industry Classification System. The rate is calculated as layoffs divided by private employment divided by 1,000. The last observation is June 2020.
Conclusions
In this Commentary we use WARN data to assess layoffs in 4D states during the current recession. The number of workers affected by layoff announcements rose sharply in the second half of March and April, and unexpected changes in economic conditions meant that workers received little advance notice before layoff. Layoff announcements have affected workers across the 4D states of Kentucky, Pennsylvania, Ohio, and West Virginia, and workers in mining and leisure and hospitality have been affected the most. Most recently, the number of workers affected by WARN notices has almost returned to prerecession levels. We find that WARN data complement existing measures of layoffs well. We think that these data may be useful to policymakers and labor market analysts as the pandemic continues to unfold.
Footnotes
- See Bernard (2020) and Romm (2020). In addition, only about 50 percent of laid-off workers file initial UI claims (Vroman, 2009). This take-up rate rose during the 2007–2009 recession (Hobijn and Șahin, 2011), but the take-up rate during the current crisis is not yet known. Return
- The national layoff and discharge rate in the JOLTS data has fallen to 1.4 percent in May, close to its 1.2 percent level in February (US Bureau of Labor Statistics, 2020), which is consistent with the WARN data. JOLTS layoff and discharge data are not available at the state level. Return
- Large layoffs in the energy sector are not surprising given the sharp declines in energy prices in March and April. For example, the consumer price index for energy in US cities fell by almost 20 percent from February 2020 to May 2020. https://fred.stlouisfed.org/series/CPIENGSL. Return
- About 9 percent of the number of workers affected by WARN notices between March 2020 and June 2020 across 4D states (primarily in Ohio) could not be associated with a county because the notices comprised multiple counties or the address of the establishment was not available. Return
- For example, the JOLTS layoffs and discharges rate in leisure and hospitality rose from 1.9 percent in February to 29.2 percent in March, stayed high at 20.1 percent in April, and fell to 2.7 percent in May. https://www.bls.gov/news.release/jolts.t05.htm. Return
References
- Bernard, Tara Siegel. 2020. “Fraudulent Jobless Claims Slow Relief to the Truly Desperate.” The New York Times (July 2), Section: Your Money. https://www.nytimes.com/2020/07/02/your-money/coronavirus-unemployment-fraud.html.
- Hobijn, Bart, and Ayş¨l Șahin. 2011. “Do Initial Claims Overstate Layoffs?” Federal Reserve Bank of San Francisco, Economic Letter, 2011–04. https://www.frbsf.org/economic-research/publications/economic-letter/2011/february/claims-layoffs-overstated/.
- Krolikowski, Pawel M., Kurt G. Lunsford, and Meifeng Yang. 2019. “Using Advance Layoff Notices as a Labor Market Indicator.” Federal Reserve Bank of Cleveland, Economic Commentary, 2019-21. https://doi.org/10.26509/frbc-ec-201921.
- Romm, Tony. 2020. “Unemployed Workers Face New Delays and Paused Payments as States Race to Stamp Out Massive Nationwide Scam.” The Washington Post (June 12). https://www.washingtonpost.com/business/2020/06/12/unemployment-benefits-fraud-delays/.
- US Bureau of Labor Statistics. 2020. Job Openings and Labor Turnover Survey (JOLTS). Public Data. Accessed July 24, 2020. https://www.bls.gov/jlt/.
- Vroman, Wayne. 2009. “Unemployment Insurance Recipients and Nonrecipients in the CPS.” Monthly Labor Review (October): 44–53. https://stats.bls.gov/opub/mlr/2009/10/art4full.pdf.
Suggested Citation
Hernández-Murillo, Rubén, and Pawel M. Krolikowski. 2020. “Assessing Layoffs in Four Midwestern States during the Pandemic Recession.” Federal Reserve Bank of Cleveland, Economic Commentary 2020-21. https://doi.org/10.26509/frbc-ec-202021
This work by Federal Reserve Bank of Cleveland is licensed under Creative Commons Attribution-NonCommercial 4.0 International

