- Share
PCE and CPI Inflation: What’s the Difference?
There are two common measures of inflation in the US today: the Consumer Price Index (CPI) released by the Bureau of Labor Statistics and the Personal Consumption Expenditures price index (PCE) issued by the Bureau of Economic Analysis. The CPI probably gets more press, in that it is used to adjust social security payments and is also the reference rate for some financial contracts, such as Treasury Inflation Protected Securities (TIPS) and inflation swaps. The Federal Reserve, however, states its goal for inflation in terms of the PCE.
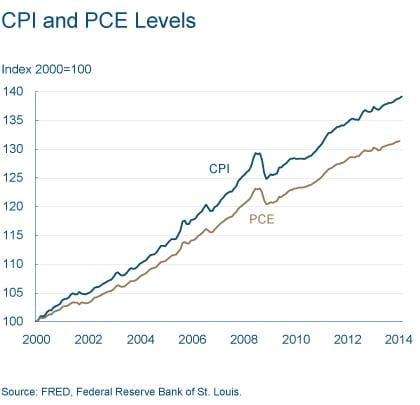
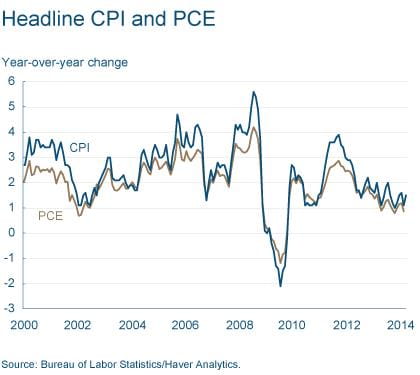
The two measures, though following broadly similar trends, are certainly not identical. In general, the CPI tends to report somewhat higher inflation. Since 2000, prices as measured by the CPI have risen by 39 percent, while those measured by the PCE have risen by 31 percent, leading to differing average annual inflation rates of 2.4 and 1.9 percent. In this century, then, CPI inflation has run about half a percentage point higher than PCE inflation. When calculated from 1960 the difference is almost the same, 3.9 percent for the CPI and 3.4 percent for the PCE. Since 2008, however, the difference has been smaller, 1.7 percent and 1.4 percent.

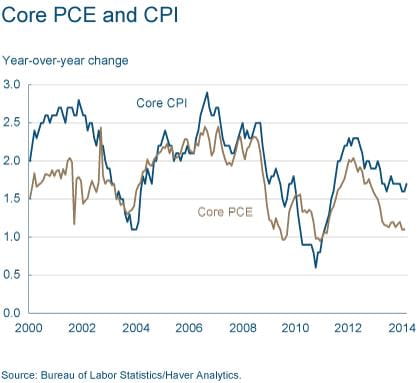
The CPI and PCE each come in two flavors, a so-called “headline” measure and a core measure, which strips out the more volatile food and energy components. Over the short term, the core measure may give a more accurate reading of where inflation is headed, but people do buy food, fill up their gas tanks, and heat their homes, so headline inflation more accurately represents people’s actual expenses. Like the headline measures, core CPI tends to show higher inflation than core PCE. Since 2000, core CPI has averaged annual increases of 3.9 percent, and core PCE has averaged 3.4 percent, the same half a percentage point difference as between the headline numbers. More recently, the differences have been smaller, with core inflation running at 2.0 percent for the CPI and 1.7 percent for the PCE since 2000, and 1.7 percent and 1.5 percent since 2008.


What accounts for the difference between the two measures? Both indexes calculate the price level by pricing a basket of goods. If the price of the basket goes up, the price index goes up. But the baskets aren’t the same, and it turns out that the biggest differences between the CPI and PCE arise from the differences in their baskets.
The first difference is sometimes called the weight effect. In calculating an index number, which is a sort of average, some prices get a heavier weight than others. People spend more on some items than others, so they are a larger part of the basket and thus get more weight in the index. For example, spending is affected more if the price of gasoline rises than if the price of limes goes up. The two indexes have different estimates of the appropriate basket. The CPI is based on a survey of what households are buying; the PCE is based on surveys of what businesses are selling.
Another aspect of the baskets that leads to differences is referred to as coverage or scope. The CPI only covers out-of-pocket expenditures on goods and services purchased. It excludes other expenditures that are not paid for directly, for example, medical care paid for by employer-provided insurance, Medicare, and Medicaid. These are, however, included in the PCE.
Finally, the indexes differ in how they account for changes in the basket. This is referred to as the formula effect, because the indexes themselves are calculated using different formulae. The details can get quite complicated, but the gist of the matter is that the PCE tries to account for substitution between goods when one good gets more expensive. Thus, if the price of bread goes up, people buy less bread, and the PCE uses a new basket of goods that accounts for people buying less bread. The CPI uses the same basket as before (again, roughly; the details get complicated).
There are a few more, mostly minor differences, related to items such as how seasonal adjustments are handled. These are usually referred to as other effects.
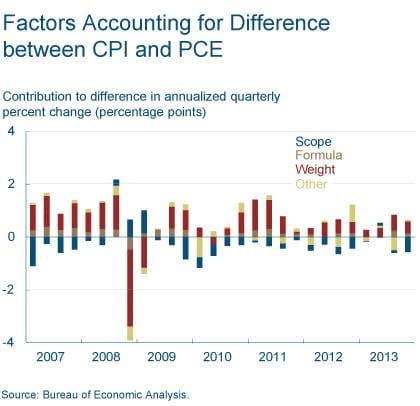
The chart below breaks down the differences between the CPI and PCE into these four effects for each quarter starting in 2007. The largest difference tends to be the weight effect, which contributes to bigger changes in the CPI, while the scope effect tends to lessen the difference.


Subscribe to receive the Center for Inflation Research newsletter
The Center’s newsletter provides inflation-related information from the Cleveland Fed. After submitting your email you'll receive the latest newsletter direct to your inbox. Learn more about the Center for Inflation Research.


