

- Share
Do Forecasters Agree on a Taylor Rule?
Forecasters’ projections of interest rates vary a great deal. We use a Taylor rule to investigate two possible reasons why. Namely, do differences arise because forecasters have different projections for output growth or inflation, or do they arise because forecasters follow different guidelines to predict what the Federal Reserve will do with the federal funds rate? We find evidence for both explanations. Forecasters appear to use very different projections for inflation and output growth, but they also seem to use dramatically different Taylor rule coefficients.
The views authors express in Economic Commentary are theirs and not necessarily those of the Federal Reserve Bank of Cleveland or the Board of Governors of the Federal Reserve System. The series editor is Tasia Hane. This paper and its data are subject to revision; please visit clevelandfed.org for updates.
Forecasters differ substantially in their projections of short-term interest rates (like 90-day Treasury bills) even over horizons as short as three quarters out. One reason for such differences could be that their interest rate forecasts are based on projections for other variables, such as inflation and real output, and the forecasters’ projections for those are different. Another reason could be that they differ about how these variables affect interest rates.
Short-term interest rates are largely determined by the Federal Reserve. Monetary policy traditionally targets the federal funds rate, an overnight interbank loan rate, to influence interest rates (currently it targets a range). It has become commonplace to think of the Fed in normal times (when the federal funds rate is above zero) as operating in terms of some type of a Taylor rule, where the funds rate is set as a function of inflation and output conditions. In most circumstances, when inflation or output growth increases, the federal funds rate would be raised to bring these indicators closer to their long-run averages or “targets.” While such a rule necessarily abstracts from the many complexities that factor into the Fed’s actual process for setting the federal funds rate, it can effectively capture the historical evolution of monetary policy.
We use the Taylor rule as a lens through which to explore the possible reasons for forecasters’ different interest rate projections. We can think of the differences as arising either because forecasters use different inputs to the same version of the rule or because they use different Taylor rules. There is evidence suggesting that forecasters do use something like a Taylor rule in making their projections, namely, that their interest rate projections are higher if output growth or inflation is higher. But this does not mean that they all use the same Taylor rule.
We try to answer two related questions in this Commentary. The first is how similar are forecasters’ estimated Taylor rules to each other? The answer to this question will help with the second question, which is does the variation observed in the one-year interest rate projections of forecasters come from largely from different forecasts for inflation and output growth or from different rules (or guidelines) that forecasters have for predicting what the Fed will do with the funds rate?
Assuming a Taylor Rule for Forecasters
We start by assuming that all of the forecasters we investigate use a Taylor rule to make their interest rate projections. First and foremost this means that the funds rate they project for one-year out is determined by the current funds rate, the long-run funds rate and the degree to which future inflation is expected to deviate from its desired long-run level and the degree to which future output growth is expected to deviate from its long-run level. (For details on the rule, see the box.)
This assumes that forecasters are working with a form of rule known as an inertial Taylor rule. With an inertial rule, the past funds rate is added to accommodate the observation that the Fed appears to move the funds rate slowly or partially toward the desired funds rate (the rate that is given by a Taylor rule without inertia).
There are four dimensions along which individual forecasters may differ in our simulation. They might have different views on what the long-run levels of output growth or inflation are. They may have different four-quarter-ahead forecasts for the inflation rate, output growth, or the fed funds rate. They may also differ about the amount of partial adjustment they believe is used. Finally, forecasters may differ on the degree to which they think the Fed adjusts the funds rate in response to inflation and output growth. That is, they might apply different coefficients on the output or inflation terms.
Note that the estimates of long-run output growth and inflation are the forecasters’ estimates of what the Fed thinks these variables will be. Although a misnomer, these are sometimes referred to as the central bank’s targets. It has only been since January 2012 that the Fed has explicitly stated an inflation target of 2 percent. During the time period we are estimating these rules, the Fed had no official long-run target for inflation, and it has never had a target for output growth.
Constructing the Forecasters’ Taylor Rules
Our sample consists of 14 forecasters from the Survey of Professional Forecasters (SPF). We have sufficient data since 1995 for these 14. The lack of earlier data is not a concern, given that Taylor did not propose his original rule until 1991. We end the sample at the beginning of 2008, since interest rates reached their implicit lower bound at the end of 2008. The Taylor rules are thus estimated from 1995:Q1 to 2008:Q1. These are the forecast dates of the SPF. The actual data used for aggregate estimates are therefore four quarters later.
We construct a Taylor rule for each forecaster, using each individual’s SPF projections as inputs. The coefficients are chosen such that they come closest to generating each forecaster’s projections. The SPF projections used as inputs include CPI inflation over the next four quarters, GDP growth over the next four quarters, the 90-day T-bill rate three quarters from now (which we use as a proxy for forecasters’ funds rate forecast four quarters from now). For the long-run estimates of inflation and real GDP growth, we use forecasters’ 10-year projections for each variable. For the long-run funds rate we use the 10-year government bond rate that forecasters anticipate in ten years.
We also estimate a “median Taylor rule” using the median interest rate, output growth, and inflation projections from the SPF. Note that this is different from the median forecaster since the median forecast of each variable likely comes from a different forecaster. It is frequently thought that median forecasts are a good measure of overall expectations.
A Wide Range of Forecasts
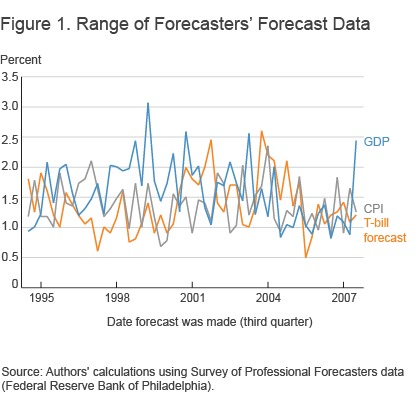
Figure 1 plots each forecaster’s projections from 1995:Q1 to 2008:Q1 for three variables: the 90-day T-bill three quarters ahead, inflation growth one year ahead, and output growth one year ahead. Notice the extreme range among forecasters. This is especially true for output growth, but there is also a lot of variability in the T-bill forecasts. Sometimes the forecasts for these variables differ by more than 2 full percentage points, and it is not uncommon for them to differ by 150 basis points. This suggests that the variation in interest rate forecasts might be driven by different output and inflation forecasts.
Individual Taylor Rule Coefficients
To explore whether forecasters’ different interest rate projections are due to different forecasts, we first look at the different Taylor rule coefficients implied by each forecaster’s projection of interest rates, inflation, and output. This helps us isolate whether different interest rate projections are mostly due to different forecasts or to different implied Taylor rules that are consistent with their forecast for interest rates, inflation, and output growth.
Figure 2 plots the Taylor rule output growth and inflation coefficients that we estimate for each forecaster using these projections. Even if we ignore the extreme outlier, where the GDP growth coefficient is almost 8, we have GDP coefficients ranging from slightly negative to around 5. Similarly, the inflation coefficient ranges from −1 to 2.5. A negative coefficient on either GDP or inflation might suggest that the forecaster does not even use a Taylor type rule in determining his or her year-out interest rate projections.
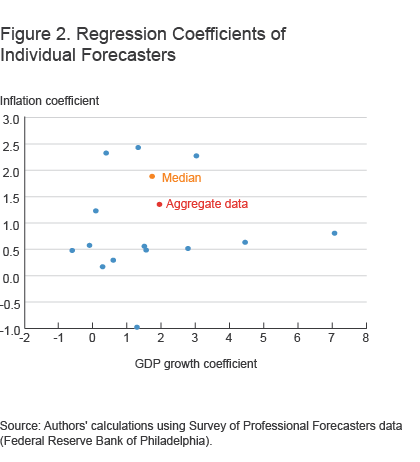
Most forecasters have an inflation coefficient around 0.5, but their output growth coefficients vary widely. The inflation coefficient of 0.5 is much smaller than that implied by the median Taylor rule or a Taylor rule estimated using aggregate data. There are certain periods in which we might expect forecasters to have not used a Taylor rule in making projections. For example, from August 2003 through mid-2004, the FOMC issued forward guidance in its post-meeting statements, saying “policy accommodation can be maintained for a considerable period of time” and that it “can be patient in removing its policy accommodation.” Statements like that indicate that the Fed will most likely keep rates constant even if in the past they might have moved given the data coming in. That is, they will not be responding to inflation and output, and the effect of that departure on forecasters’ Taylor rules would be to reduce their estimates on inflation and output growth.
Examining figures 1 and 2 we see the potential for both the variability in short-term forecasts for the input variables and the variability in Taylor rule coefficients to explain the dispersion of interest rate forecasts. The variability of anticipated output growth is potentially very important since forecasters place a great weight on it—on average.
Different Taylor Rule Coefficients or Different Forecasts?
To explore further whether it is the different forecasts for GDP growth and inflation that are responsible for the variation in interest rate forecasts or whether it is the different coefficients on output and inflation, we construct four different experiments, using different inputs to the Taylor rule:
- Median Taylor rule with individual forecasts: the coefficients for inflation and output in the Taylor rule come from the median forecasts, while the long-run and short-run projections for the input variables come from the individual forecasters.
- Individual Taylor rules with median forecasts: the coefficients for inflation and output in the Taylor rule are given by the individual Taylor rule regressions but the long- and short-run projections are assumed be the median forecasts.
- Median Taylor rule with individual short-run and median long-run forecasts: the coefficients for inflation and output in the Taylor rule are given by the median forecast, as are the long-run constants for inflation, output growth, and interest rates, but the year-ahead forecasts for these latter three variables are from the 14 forecasters.
- Median Taylor rule with median short-run and individual long-run forecasts: the coefficients for inflation and output in the Taylor rule are given by the median forecast, the long-run constants for inflation, output growth, and interest rates are from the individual forecasters, and the year-ahead forecasts for are the median forecast.
The median Taylor rule with individual forecasts and the individual Taylor rules with median forecasts are in a sense opposite experiments. For both, we look at the standard deviation (a measure of dispersion) of the Taylor rule interest rate projections across the 14 forecasters. If the variation is small when the forecasters use different Taylor rules but the same forecasts, it would suggest that it is the different forecasts that are driving a large fraction of the variation of forecasters’ interest rate projections.
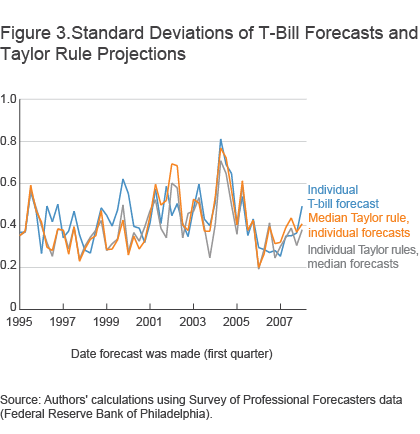
We find that the variation across forecasters when they have different Taylor rules but the same forecasts is half the size of the opposite experiment when they use different Taylor rules but different forecasts (figure 3). This result suggests that different forecasts and not different Taylor rules, or perceptions of what determines monetary policy, is the largest reason why forecasters’ interest rate projections vary so much.
This is surprising, because above we showed that there is tremendous variability in the different Taylor rule coefficients among forecasters. However, even though there is a lot of variability (especially for the output growth coefficient), there is not that much variability in the level of inertia. The standard deviation across the 14 forecasters is only 0.1 on the inertial component, while for the output growth coefficient it is 0.27.
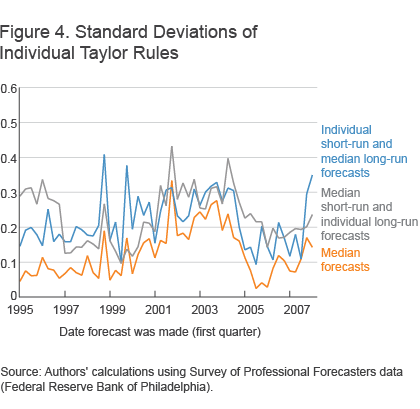
Given the importance of individual forecasts, we break the median Taylor rule with individual forecasts into two subcategories by constructing the other two experiments, the median Taylor rule with individual short-run and median long-run forecasts and the median Taylor rule with median short-run and individual long-run forecasts. This allows us to disentangle whether it is the variability in long- or short-term forecasts that is mostly driving our results.
The variability of Taylor rule predictions is nearly equal whether we have common long-run forecasts and different short-run forecasts or the converse (figure 4). Thus, while different forecasts are an important factor driving the differences in the variability of interest rate projections, both forecast horizons appear equally important.
Conclusion
Forecasters’ projections of interest rates vary a great deal. This Commentary investigated potential sources of that variability through the lens of the Taylor rule. In terms of explaining a forecaster’s projection of short-term interest rates, different inflation and output growth projections appear to be especially important. But that should not obscure the fact that there are dramatic differences across Taylor rule coefficients of the forecasters.
Box: Taylor Rule Details
Basic Taylor Rule
We assume that each forecaster (i) uses the following rule in forming his or her forecast of the federal funds rate at time t+4:

where
is the fed funds “target” that forecaster i at time t anticipates for t+4
FFRi,LRis the long-run federal funds rate
infi,t+4 is the inflation rate in four quarters
infi,LRis the long-run inflation rate
ΔGDPi,t+4 is the real GDP growth rate in four quarters
ΔGDPi,LR is the long-run growth rate of real GDP
a is the degree to which the fed funds rate responds to the gap in inflation
b is the degree to which the fed funds rate responds to the gap in output.
This Taylor rule says the federal funds rate “target” responds to what forecaster i anticipates inflation and real GDP growth will be in four quarters.
Partial Adjustment Factor
We assume that forecasters adjust the target given by the rule above so that the target is approached gradually:

where
TRi,t+4 is the funds rate at t+4 predicted by forecaster i at time t
ρi is the level of partial adjustment (or inertia) of forecaster i
FFRt is the funds rate at time t
That is, the predicted funds rate at time t+4 is an average of the target given by the basic Taylor rule above and the current time-t funds rate.
Suggested Citation
Carlstrom, Charles T., and Margaret Jacobson. 2015. “Do Forecasters Agree on a Taylor Rule?” Federal Reserve Bank of Cleveland, Economic Commentary 2015-10. https://doi.org/10.26509/frbc-ec-201510
This work by Federal Reserve Bank of Cleveland is licensed under Creative Commons Attribution-NonCommercial 4.0 International

