- Share
Wage Growth, Labor Market Tightness, and Inflation: A Service Sector Analysis
This Economic Commentary explores the connections among labor market tightness, wage inflation, and price inflation at the service sector level. Across most service sectors, sector-specific labor market tightness and nominal wage growth have been above prepandemic averages since 2022. The data suggest that a stronger positive relationship between labor market tightness and wage growth has emerged in the aftermath of the pandemic. The relationship between sector-specific wage growth and inflation is more varied. In the education and health services sector, higher wage growth is associated with higher inflation after about one year; in the leisure and hospitality services sector, the positive relationship is contemporaneous. I do not find a significant relationship between wage growth and inflation in the other service sectors, such as transportation or financial and business services.
The views authors express in Economic Commentary are theirs and not necessarily those of the Federal Reserve Bank of Cleveland or the Board of Governors of the Federal Reserve System. The series editor is Tasia Hane. This paper and its data are subject to revision; please visit clevelandfed.org for updates.
Following the pandemic, the US macroeconomy has been characterized by high inflation at values not seen since the early 1980s, tight labor markets, and elevated levels of nominal wage growth. This constellation of macroeconomic data revived an interest in investigating links between labor markets and inflation. The purpose of this Economic Commentary is to analyze the connections among labor market tightness, nominal wage growth, and inflation at the service sector level.
Since the aftermath of the pandemic, the four main service industries—namely, education and health services; financial and business services; leisure, hospitality, and other services; and trade and transportation services—have experienced elevated nominal wage growth and labor market tightness. Moreover, the data suggest that the relationship between nominal wage growth and labor market tightness became much stronger in the post-pandemic period. Using relatively standard regression techniques, I quantify the relationship between nominal wage growth and inflation at the service sector level and find that the relationship between current nominal wage growth and inflation varies substantially across service industries and across time horizons. Specifically, sector-specific wage growth is systematically related to sector-specific inflation only for education and health services and leisure and hospitality services. By contrast, I do not find evidence that sector-specific wage growth is associated with inflation in financial and business services or trade and transportation services. Second, in education and health services, higher wage growth today is associated with higher inflation after about one year. On the other hand, in leisure and hospitality services, higher wage growth today is associated with higher current inflation.
This sector-level analysis paints a nuanced picture of the implications that wage growth dynamics may have for inflation. In some service sectors, it is not clear that the observed decline in nominal wage growth since early 2023 will necessarily lead to lower inflation in those industries, either now or in the near future. In education and health services, elevated past readings on wage growth are likely to contribute to elevated inflationary pressures through 2024, before the disinflationary effects of more recent easing in wage growth start to materialize by the end of 2024 or the beginning of 2025. On the other hand, slowing wage growth in the leisure and hospitality services would be more likely to be associated with a faster slowing in inflation in that sector.
Labor Market Tightness and Wage Inflation
I start off by providing a broad overview of the relationship between labor market tightness and nominal wage growth across four main service ex housing sectors in the United States, namely, education and health services; financial and business services; leisure, hospitality, and other services; and trade and transportation services. The labor market tightness measure is constructed as the 12-month moving average of the ratio of the number of job postings at the sector level to the number of unemployed workers at the sector level, similar to in Birinci and Ngân (2023). Nominal wage growth is measured using the 12-month moving average of median nominal wage growth at the sector level as computed by the Federal Reserve Bank of Atlanta Wage Growth Tracker.

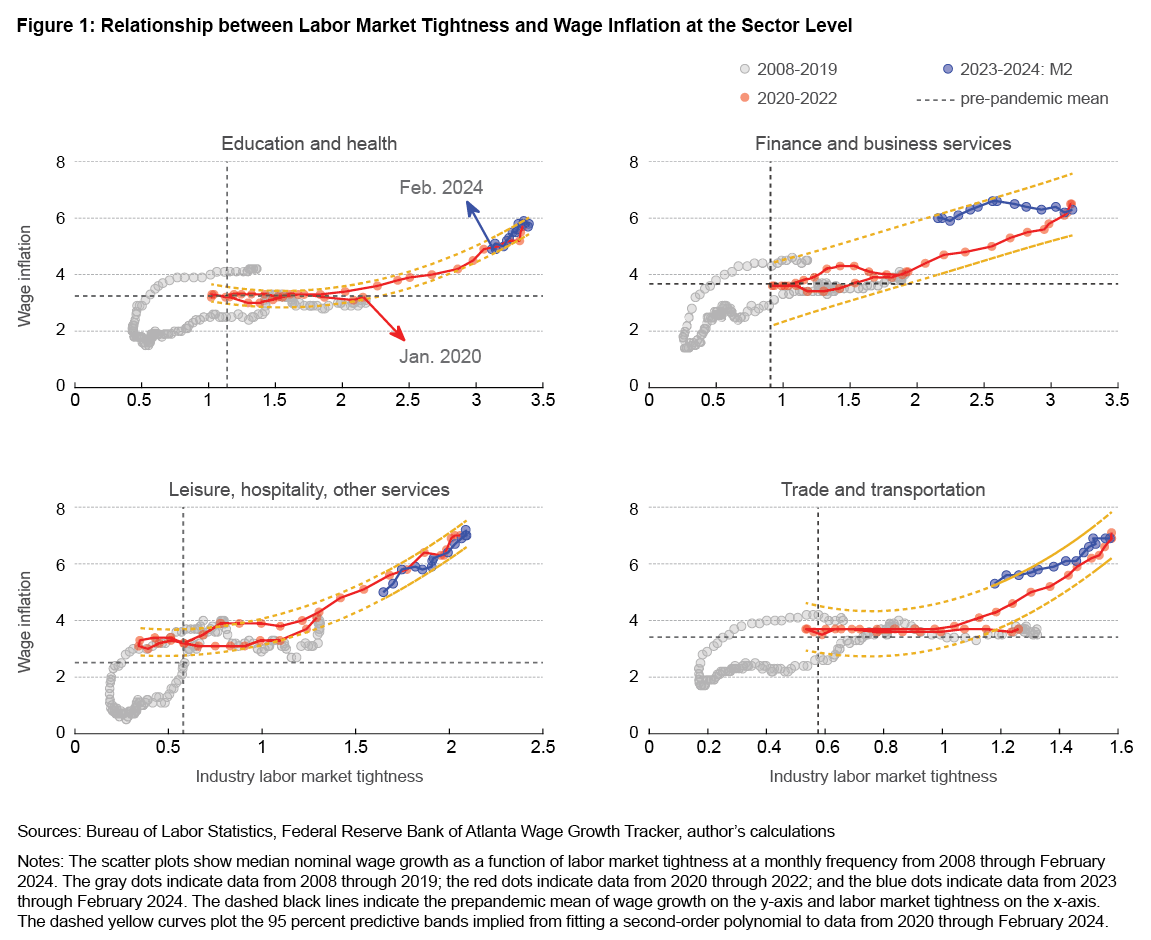
Figure 1 displays scatter plots of the relationship between labor market tightness and nominal wage growth. The figure shows that, starting from 2022, both labor market tightness and wage growth have been significantly above prepandemic averages for all the service sectors. However, there have been declines in both labor market tightness and wage growth starting from early 2023. Echoing the recent work of Benigno and Eggertsson (2024), the data are suggestive of a kink in the post-pandemic correlation between labor market tightness and wage growth, particularly for education and health services, leisure and hospitality services, and trade and transportation services. For instance, the correlation between labor market tightness and wage inflation in the education and health services sector became a lot stronger once tightness exceeded a value of about 2. The economy continues to be on the steeper side of the correlation, implying that a small decline in labor market tightness is associated with a much larger decline in nominal wage growth.
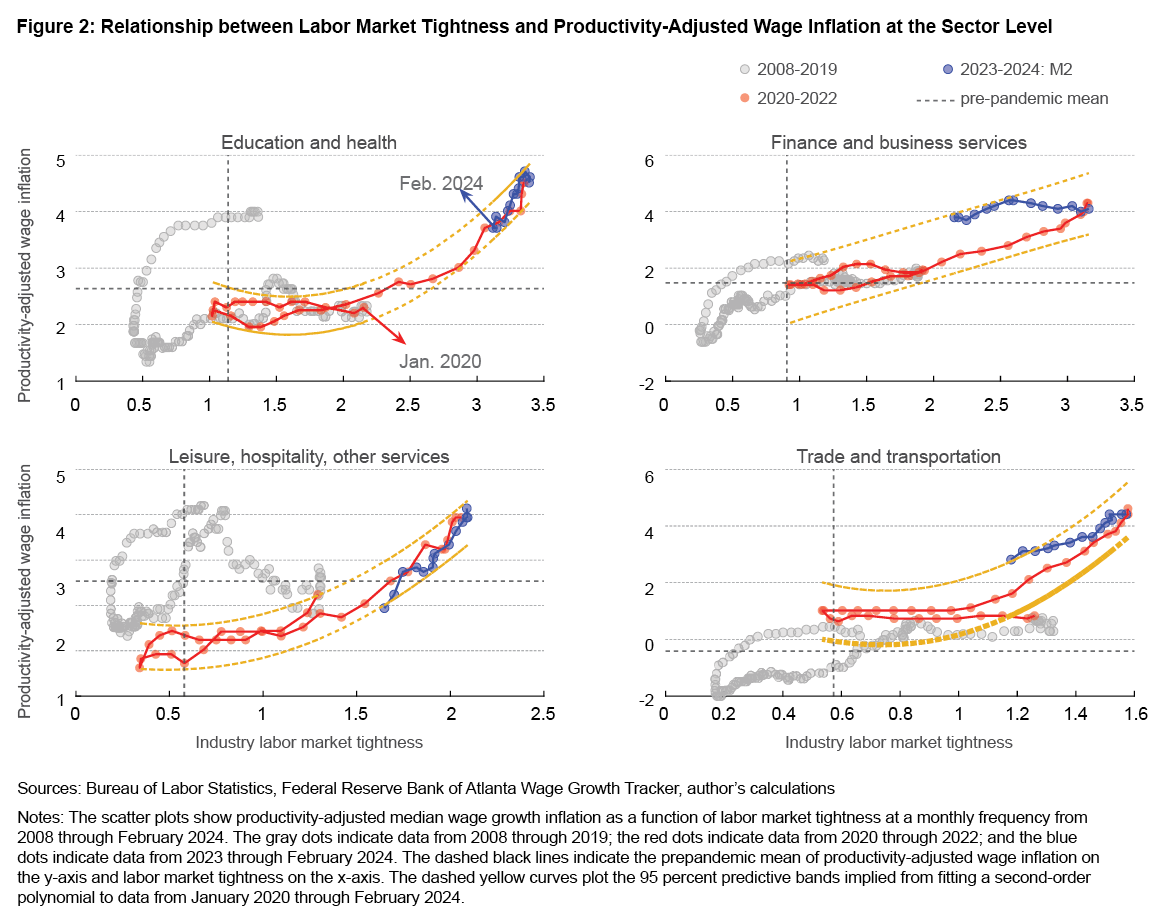
The heightened nominal wage growth might also reflect improvements in labor productivity growth. To account for this, I consider a measure of productivity-adjusted wage inflation, constructed by deducting trend labor productivity growth from nominal wage growth for each sector. Figure 2 emerges when nominal wage growth is adjusted for trend labor productivity growth at the sector level.1 The figure is generally similar to Figure 1. The only exception is for leisure, hospitality, and other services, for which productivity-adjusted wage growth has re-equilibrated back to its prepandemic average.

Implications for Services Inflation
Given persistently elevated inflation readings in the services sector following the pandemic, a key question is the extent to which nominal wage growth feeds into price inflation. To capture this relationship, I use the local projections methodology of Jordà (2005) and employ a specification like that in Heise, Karahan, and Şahin (2022) by running the following regression:
(1)
where is inflation in period t and sector i, is nominal wage growth, is the unemployment rate, is a measure of long-run inflation expectations, and is an error term.2 The estimation is performed on monthly data from January 2001 through February 2024, and I exclude data from the second and third quarters of 2020 in the cases of the education and health services and leisure, hospitality, and other services industries.3 Of interest for this Economic Commentary is the association between changes in current nominal wage growth and inflation in that sector h-months ahead, that is, the estimates of for h = 0, 1, ..., 36 months.
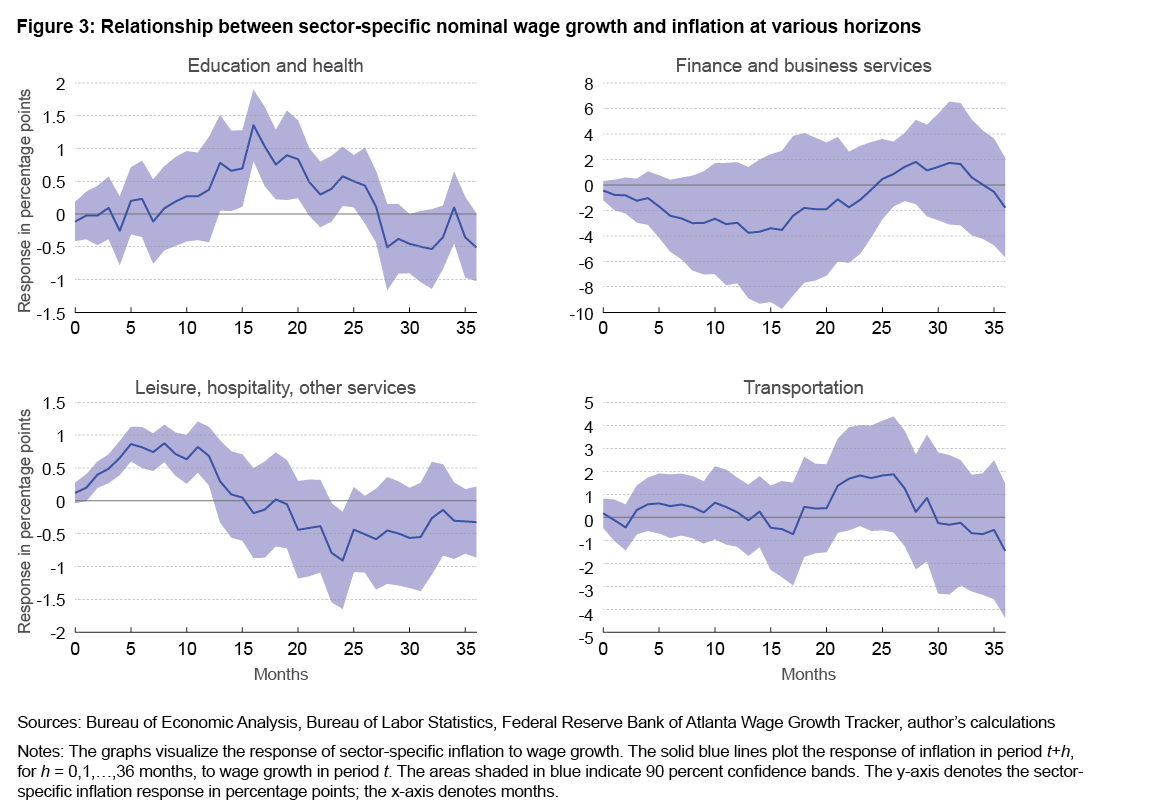
Figure 3 plots the point estimates of over a three-year horizon for all four sectors of interest. The figure shows that there is considerable heterogeneity in the estimates of . First, current wage growth is positively associated with sector-specific inflation only for education and health services and leisure, hospitality, and other services. By contrast, I do not find a statistically significant relationship between current wage growth and the inflation rate for financial and business services or for trade and transportation services at any horizon within three years. Second, there are important differences in terms of the timing for when wage growth is most strongly associated with future price inflation in the education and health services and leisure, hospitality, and other services. Specifically, in education and health services, higher wage growth today is associated with higher inflation after about one year, and, from that point, the elevated inflation persists for about one year. On the other hand, high current wage growth tends to be associated with high inflation almost immediately in leisure, hospitality, and other services, and that higher inflation lasts for about one year.
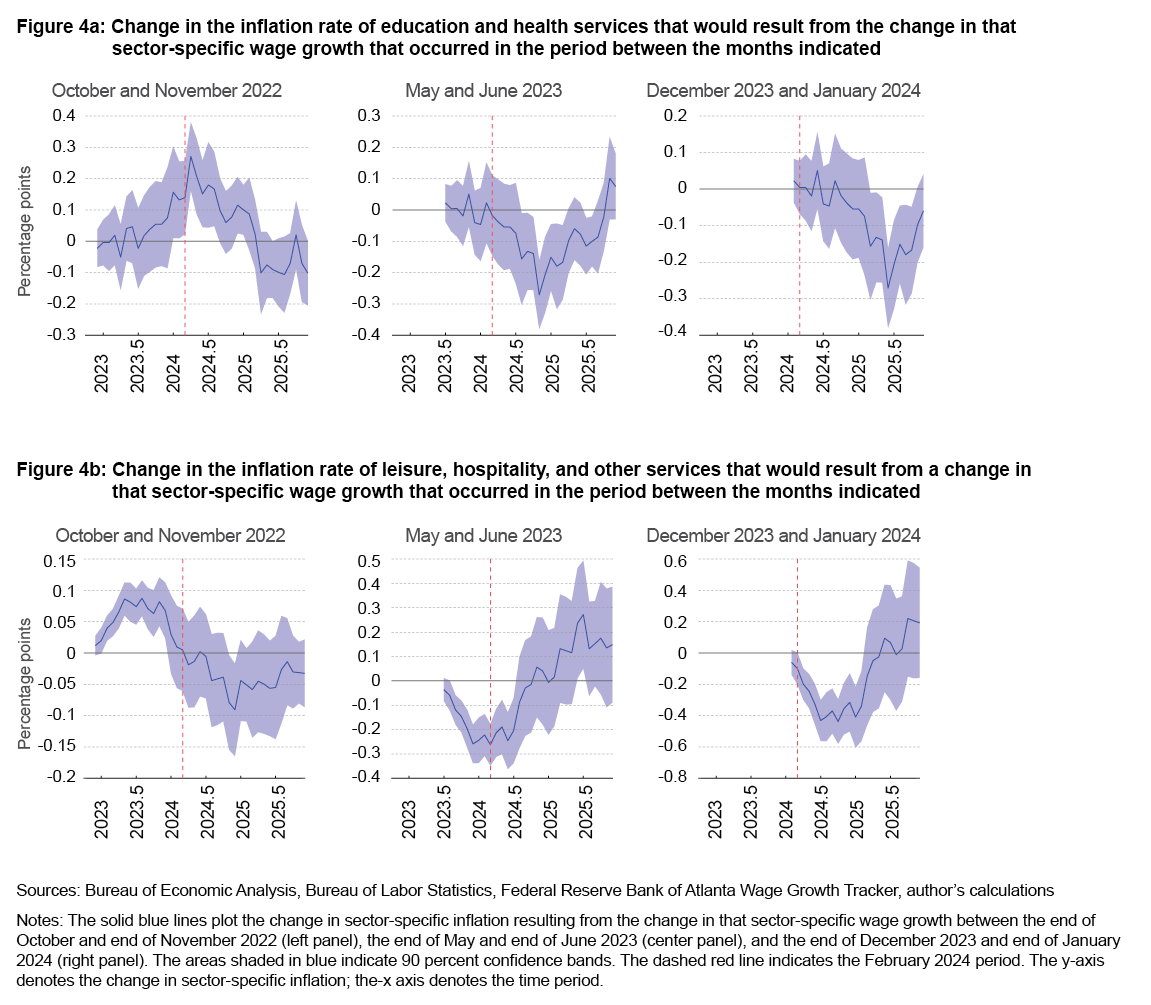
Figures 4a and 4b attempt to capture the implications that the recent slowing in sector-specific wage growth, as shown in Figure 1, will have for the corresponding sector-specific inflation rates going forward if the relationship in Equation (1) holds. Specifically, I compute the anticipated change in sector-specific inflation rates that would be expected to follow changes in wage growth within that sector that occurred at three particular points in time: between the end of October and end of November 2022 (left), the end of May and end of June 2023 (center), and the end of December 2023 and end of January 2024 (right). The panels in Figure 4a plot the changes in the inflation rate of education and health services, and the panels in Figure 4b plot the changes in the inflation rate of leisure, hospitality, and other services. The red dashed line indicates February 2024. Figure 4a shows that in education and health services, there is still some upward pressure on inflation expected to occur through the end of 2024 as a result of the earlier increases in wage growth in late 2022 and early 2023 in that sector. The analysis implies that it will take some time before the more recent easing in wage growth in this sector from mid-2023 onward is likely to pass through to lower inflation rates in late 2024 and into 2025. On the other hand, given the shorter time lag between wage growth and inflation in leisure and hospitality services, earlier upward pressure on inflation arising from increases in wage growth has already passed, and the more recent declines in wage growth that started happening from 2023 onward should help to reduce inflation in that sector.


This analysis highlights that the relationship between wage growth dynamics and inflation varies substantially across sectors. First, the decline in the wage growth in some service sectors will not necessarily lead to lower inflation in those sectors. Second, inflationary pressures resulting from wage growth are expected to be elevated in the education and health services sector through 2024 before the disinflationary effects of past wage growth declines start to materialize by the end of 2024 and into 2025. Third, the easing seen thus far in wage growth in the leisure, hospitality, and other services sector should soon help to moderate inflation in this sector. However, it is worth noting the earlier finding that wage growth adjusted for labor productivity in the leisure, hospitality, and other services sector has already returned to prepandemic levels, suggesting that to see even more disinflation in this sector would require a bigger reduction in labor market tightness.
Conclusion
This Economic Commentary investigates the connections among labor market tightness, wage growth, and price inflation at the service sector level. Sector-specific labor market tightness and nominal wage growth have been above prepandemic averages since 2022, and a stronger positive relationship between labor market tightness and nominal wage growth has emerged in the aftermath of the pandemic. The relationship between wage growth dynamics and inflation varies substantially by sector. Higher sector-specific wage growth is associated with an increase in inflation in the education and health services sector with a lag of about one year, whereas the relationship is almost immediate for leisure and hospitality services inflation. On the other hand, I do not find significant pass-through from wages to prices in financial and business services or trade and transportation services.
References
- Benigno, Pierpaolo, and Gauti B. Eggertsson. 2024. “The Slanted-L Phillips Curve.” AEA Papers and Proceedings 114 (May): 84–89. https://doi.org/10.1257/pandp.20241051.
- Birinci, Serdar, and Trần Khánh Ngân. 2023. “Labor Market Tightness after the COVID-19 Recession: Differences across Industries.” The Regional Economist. Federal Reserve Bank of St. Louis. https://fedinprint.org/item/fedlre/97364.
- Heise, Sebastian, Fatih Karahan, and Ayşegül Şahin. 2022. “The Missing Inflation Puzzle: The Role of the Wage‐Price Pass‐Through.” Journal of Money, Credit and Banking 54 (S1): 7–51. https://doi.org/10.1111/jmcb.12896.
- Jordà, Òscar. 2005. “Estimation and Inference of Impulse Responses by Local Projections.” American Economic Review 95 (1): 161–182. https://doi.org/10.1257/0002828053828518.
Endnotes
- Labor productivity growth data at the sector level are quite volatile, hence I construct a trend using HP filtering techniques and use that trend instead. The data are available until 2022; I assume that labor productivity growth for 2023 and 2024 is the same as in 2022. Return to 1
- PCE inflation at the sector level is constructed using nominal expenditure weights. For instance, the PCE inflation for education and health is the weighted average between the year-over-year PCE inflation rate for education and the year-over-year PCE inflation rate for health services. The weight assigned to education inflation is constructed by dividing the nominal PCE spending on education by the sum of nominal PCE spending on education and health. Similarly, the weight assigned to health inflation is constructed by dividing the nominal PCE spending on health services by the sum of nominal PCE spending on education and health. Return to 2
- The unemployment rate for these industries spiked up significantly higher than any value realized over the last two decades. Return to 3
Suggested Citation
Hajdini, Ina. 2024. “Wage Growth, Labor Market Tightness, and Inflation: A Service Sector Analysis.” Federal Reserve Bank of Cleveland, Economic Commentary 2024-15. https://doi.org/10.26509/frbc-ec-202415
This work by Federal Reserve Bank of Cleveland is licensed under Creative Commons Attribution-NonCommercial 4.0 International


