

- Share
The Evolution of Student Debt 2019–2022: Evidence from the Survey of Consumer Finances
In recent years, economists and policymakers have been interested in the burden of student debt across socioeconomic groups. In this Economic Commentary, we use the two most recent waves of the Survey of Consumer Finances, collected in 2019 and 2022, to study changes in the joint distribution of student debt and two measures of “ability-to-pay,” income and net worth. We find that between 2019 and 2022, both the fraction of families with student debt and real student debt per family were essentially unchanged, and aggregate student debt fell as a fraction of aggregate income and net worth. However, over the same period, the distribution of student debt shifted toward higher-income and wealthier families, with a rise in the average student debt in the highest quintile of both income and net worth. Further, this shift was not driven by changes in the distribution of debtors, but, instead, in the amount of debt per family.

The views authors express in Economic Commentary are theirs and not necessarily those of the Federal Reserve Bank of Cleveland or the Board of Governors of the Federal Reserve System. The series editor is Tasia Hane. This paper and its data are subject to revision; please visit clevelandfed.org for updates.
Introduction
Student debt is the third-largest category of consumer debt in the United States and currently stands at approximately $1.6 trillion.1 In recent years, the increasing magnitude of student debt has coincided with increased interest in student debt cancellation policies and subsequent debate over the burden of student debt across socioeconomic groups.2 In this Economic Commentary, we use the two most recent waves of the Survey of Consumer Finances (SCF) to explore changes from 2019 to 2022 in both the aggregate level and distribution of student debt across income and net worth for US families.
The SCF is a triennial survey conducted by the Federal Reserve Board designed to provide an overview of the balance sheets of a representative sample of US families. Conducted in its current form since 1989, the SCF collects information on family income, net worth, balance sheet components (including student loans), credit use, and other financial outcomes.
Before turning to our findings, we first recall three observations from Aladangady et al. (2023), who provide a broad overview of changes in family finances between the 2019 and 2022 waves of the SCF. First, between 2019 and 2022, median net worth grew by 37 percent in real terms, an increase that was more than twice as high as any past increase across consecutive waves of the SCF and much higher than the corresponding 3 percent growth in median income over the same period. Second, between 2019 and 2022, median income rose by less than mean income, suggesting an increase in income inequality, while the reverse was true for net worth, suggesting a decrease in net worth inequality. Third, between 2019 and 2022, the percentage of families with any student debt was unchanged at approximately 22 percent, and the median and mean amounts of debt among families with student debt remained at approximately $25,000 and $47,000, respectively.
These findings of Aladangady et al. (2023) illustrate that although the percentage of families with student debt and the average amount of debt per family were unchanged between 2019 and 2022, the change in the distributions of income and net worth was more subtle and warrants further analysis. In this Economic Commentary, we therefore extend the analysis of Aladangady et al. (2023) by exploring changes in the joint distribution of student debt, income, and net worth. We find that between 2019 and 2022, aggregate student debt grew by less than both aggregate income and net worth and that there was a shift in the distribution of student debt to the upper quintiles of both income and net worth. Further, most of this change was driven by changes in the amount of student debt held by student debtors in each quintile rather than by changes in the distribution of student debtors across quintiles.
Although SCF data do not permit us to ascribe causal effects to policy responses (as we are only looking at cross-sectional data three years apart), our analysis and focus are partly motivated by the COVID-19 pandemic and subsequent policy responses related to student debt. Indeed, there were several significant national policy responses to the pandemic. Most notably for our purposes, the federal government enacted a payment pause for most federal student loans from March 2020 through August 31, 2023.
During this time, certain kinds of student debt owed to the federal government were automatically considered to be in forbearance. For such loans, no payment was due for the duration of the pause (although borrowers could choose to continue to repay), and interest on these loans did not accrue.3 In present value terms, then, this payment pause therefore represented a net transfer to holders of student debt as interest on these loans was not retroactively applied for the duration of the pause. Interest began accruing on these loans on September 1, 2023, and student debt payments resumed in October 2023, and so the payment pause was in effect during the period in which the 2022 SCF was conducted.4
Analysis
Our analysis consists of three distinct parts. First, we document changes in the aggregate amount of student debt, income, and net worth recorded in the SCF and provide summary statistics for income and net worth for families with student debt (“student debtors”) and for the whole population. Second, we examine how the average amount of student debt varies across quintiles of income and net worth. Third, we explore the extent to which these changes in averages by quintile represent changes in the incidence of student debt; we do this by computing analogous figures for the population of student debtors. Note that in this Economic Commentary we record all figures in 2022 dollars.
Aggregate figures and summary statistics
In the 2019 SCF, approximately 21.4 percent of families recorded any student debt, and the aggregate amount of this debt was $1.29 trillion. For the 2022 SCF, the corresponding figures were approximately 21.7 percent and $1.34 trillion, respectively.5 Although the aggregate amount of student debt grew slightly, as did the percentage of households with student debt, as a fraction of aggregate income recorded in the SCF, aggregate student debt fell from approximately 8.15 percent to 7.21 percent. Similarly, aggregate student debt fell from approximately 1.16 percent to 0.96 percent as a fraction of aggregate net worth as recorded in the SCF.
Before turning to analysis of distributions, we first study how families with student debt (student debtors) differ from the population as a whole. Of the different notions of financial well-being recorded in the SCF, we focus on income and net worth. Table 1 records the median and mean income and net worth for the whole population and for families with student debt.
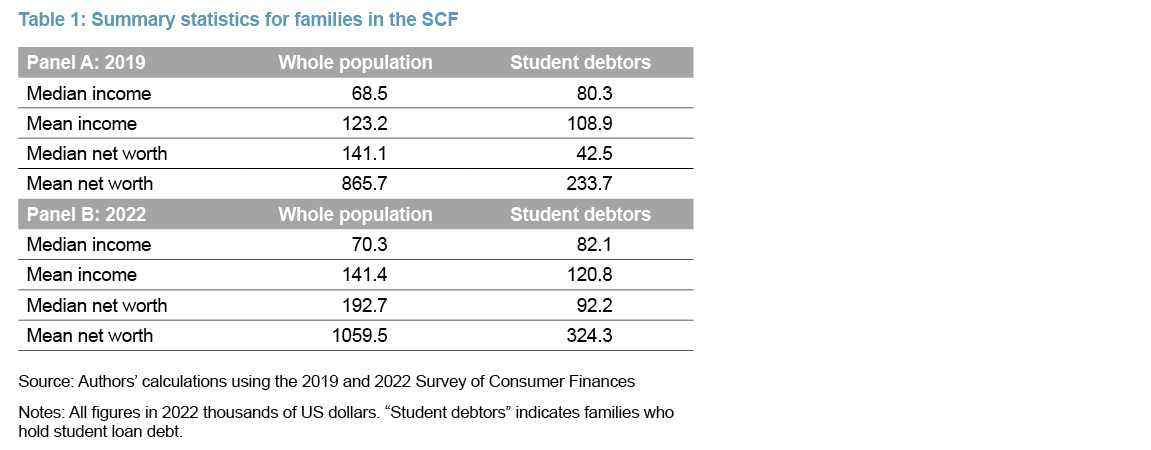
The statistics in Table 1 illustrate the difficulty in making a simple comparison between student debtors and the general population without controlling for other attributes. For both waves, student debtors have higher median income but lower mean income and lower median and mean net worth when compared with the general population. The low net worth of student debtors relative to the general population is unsurprising because student debt is typically incurred to finance education early in life before debtors have accumulated much wealth (net worth). Indeed, the median ages for SCF respondents in the whole population and the population of student debtors were 52 and 37, respectively, in 2019, while for 2022 the corresponding ages were 52 and 39, respectively. Motivated by this last point, Table 2 complements Table 1 by providing summary statistics for the population of families in which the respondent is under the age of 35.
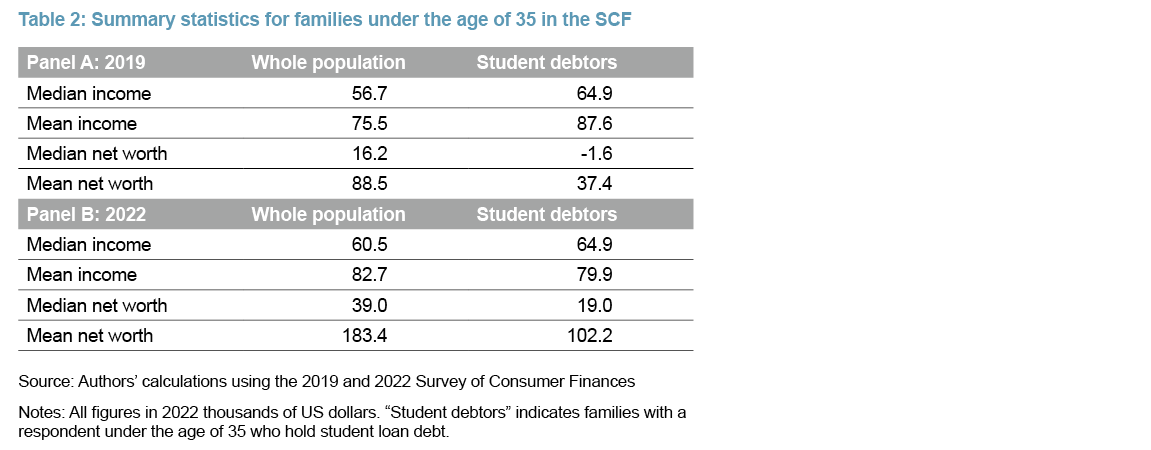
Table 2 again illustrates the difficulty in making simple comparisons of financial well-being between student debtors and the whole population: young student debtors have higher median income than the whole young population in both waves, but lower median and mean net worth. Further, the mean income of young student debtors exceeded that of the general population under the age of 35 in 2019 but not in 2022. However, note that for both the whole population and the population of young families, we see a sharp difference in net worth between student debtors and nondebtors.
Table 1 and Table 2 therefore show that both the median and mean net worth of student debtors are below that of families without student debt, regardless of whether one considers the whole population or restricts attention to families in which the SCF respondent is below the age of 35. However, the comparison between debtors and nondebtors is more subtle when considering income, with the relative magnitudes between student debtors and families without debt depending on the metric employed (median or mean) and the particular wave of the SCF considered. We now take a closer look at the incidence and burden of student debt by studying its distribution across quintiles of income and net worth.
Student debt by income and net worth quintiles
Figure 1 illustrates the variation of the average student debt held by quintiles of income and net worth across the 2019 and 2022 waves. As seen in the left-hand side of Figure 1, between the two waves there was a significant increase in the average student debt owed by families in the highest quintile of income and a change in the shape of student debt’s distribution across income quintiles. In 2019, the distribution was slightly hump-shaped, rising for the first four quintiles before falling for the highest, but, in contrast, in 2022 the average rose across income quintiles.
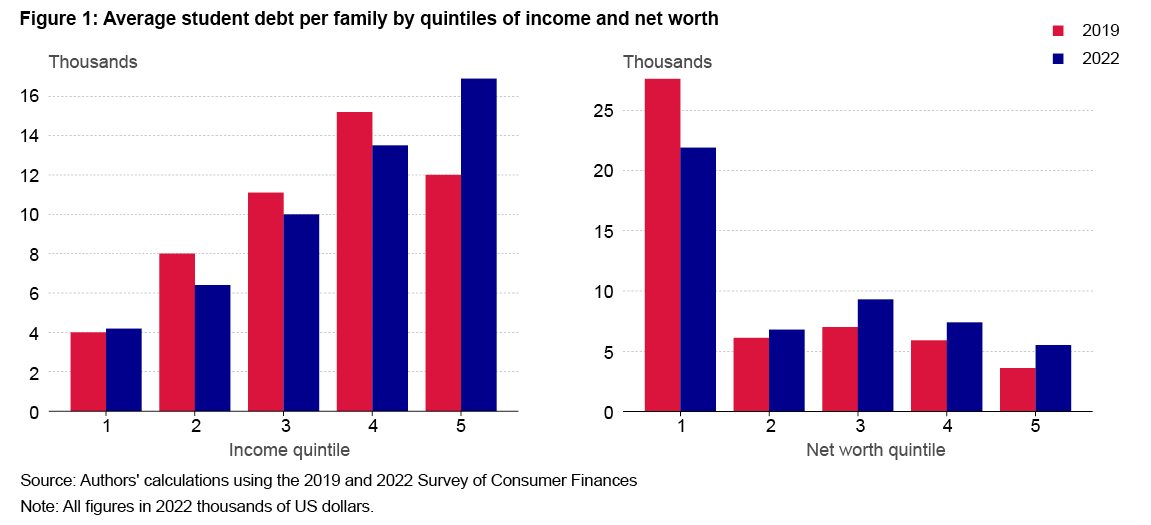
As seen in the right-hand side of Figure 1, in both 2019 and 2022 the distribution of average student debt by quintiles of net worth was qualitatively different than that for income and was highest in the lowest quintile. As noted above, this concentration in the lowest quintile is not surprising given the lifecycle nature of debt accumulation: student debt is typically accrued by young people who have yet to accumulate much wealth (net worth). However, even though the distribution of student debt differed between income and net worth, for both variables between 2019 and 2022 there was an increase in the average debt held by families in the highest quintile. Further, for net worth, the highest proportional increase in average student debt occurred in the highest quintile. Thus, although median and mean student debt were almost unchanged between the 2019 and 2022 waves, Figure 1 shows that the distribution of student debt shifted rightward toward higher-income and wealthier families.6
Intensive versus extensive margin
As noted above, less than a quarter of families in the 2019 and 2022 waves of the SCF hold any student debt at all. An exclusive focus on averages (even broken down by quintiles) can potentially obscure distributional changes. For instance, the increase depicted in Figure 1 in the average student debt held by the highest income quintile could be a result of changes in the levels of debt held by student debtors in this quintile (intensive margin changes) or a change in the percentage of families with any student debt (extensive margin changes).
To explore this point, Figure 2 depicts the percentage of families in the SCF who hold any student debt within each quintile of income or net worth. The left-hand side of Figure 2 shows that there was essentially no change in the incidence of student debt within any income quintile. The situation with net worth on the right-hand side of Figure 2 is more complicated, with a decrease in the first quintile and increases in the middle three quintiles. However, as with income, the change in incidence for the highest quintile between 2019 and 2022 was slight.
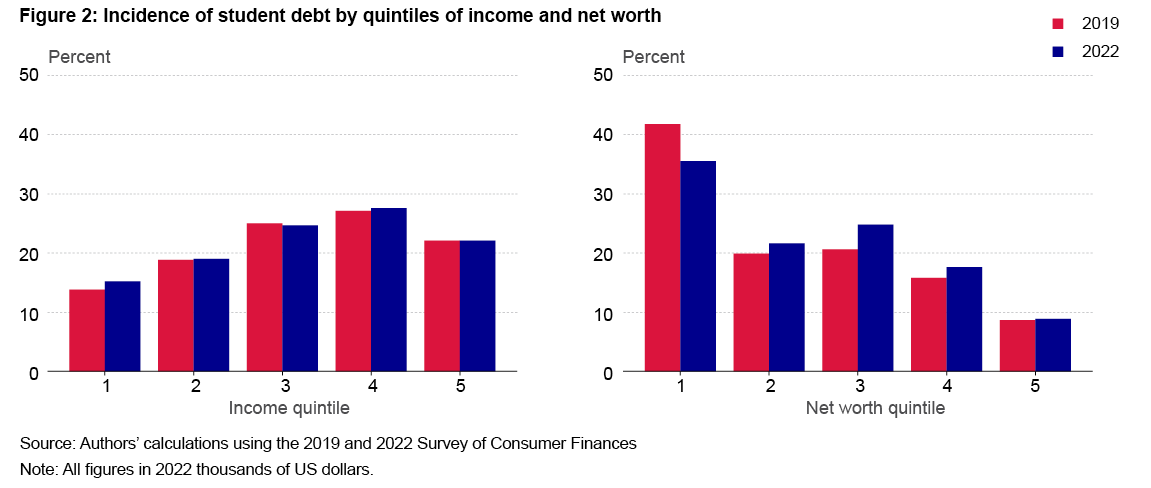
Figure 2 shows that the rise in the average student debt held by the highest quintile of income and net worth in Figure 1 was not a result of changes in the percentage of families with student debt as this is the same across the two SCF years.
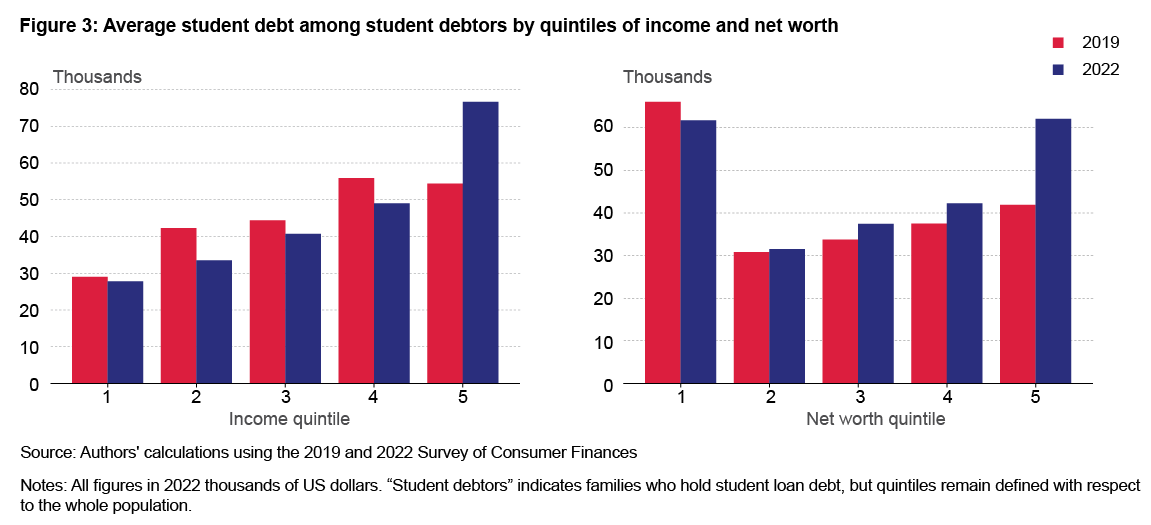
Figure 3 complements this analysis by depicting the average student debt held among student debtors, again broken down by quintiles of income and net worth. Figure 3 shows that the sharpest rises in the average student debt among student debtors occurred for the fifth quintile in both income and net worth. Indeed, in 2022 the average student debt held by student debtors in the highest quintile of net worth was essentially the same as that held by the lowest quintile, a noteworthy change relative to 2019’s average in which the student debt held by the lowest quintile far exceeded that of the top quintile.
Mean-to-median ratios and the role of outliers. Figure 2 and Figure 3 show that the increase depicted in Figure 1 in the average student debt held by the highest quintiles of income and net worth primarily represents an increase in the average debt per student debtor family in these quintiles and not a reallocation of such families across the distribution for either measure. Was this a uniform increase in the debt held by families in the top quintile, or was it driven by an increase in the number of families with high debts? To examine this question, Figure 4 plots the ratio of the conditional mean to the conditional median for each quintile of income and net worth.
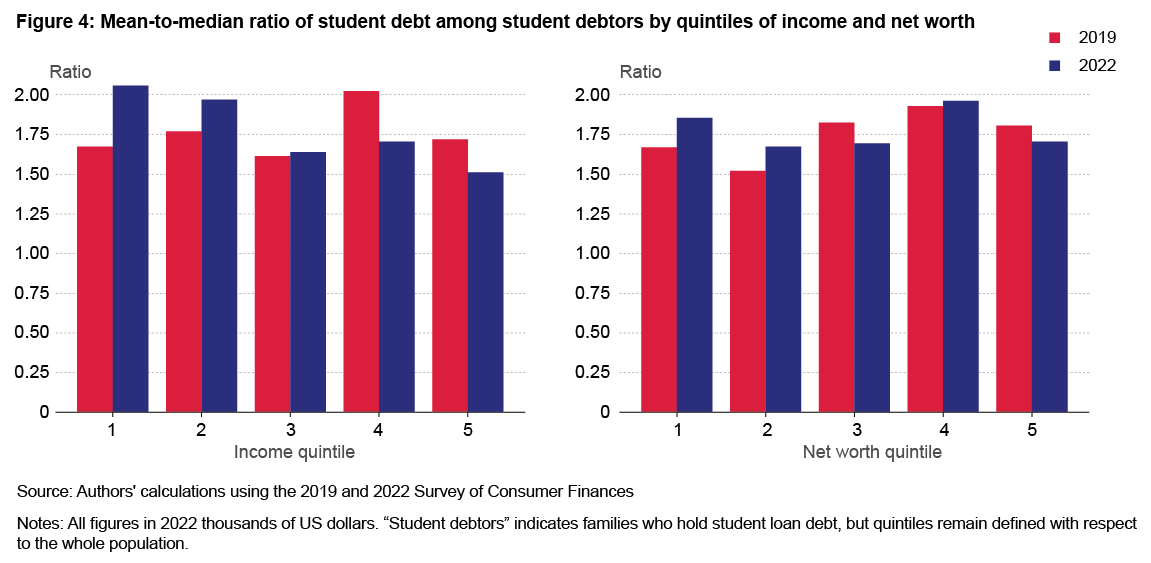
If the increases in the averages in any quintile were driven by a small fraction of outliers, we would expect the mean-to-median ratio to rise. However, Figure 4 shows that for both income and net worth, in the highest quintile this ratio fell between the 2019 and 2022 waves of the SCF. This suggests that the rise in the average debt held in the highest quintile of income and net worth was broad-based throughout the quintile.
Conclusion
The SCF offers a snapshot into the balance sheets of families in the United States. In this Economic Commentary, we have documented several facts regarding the change in the distribution of student debt between the 2019 and 2022 waves. First, aggregate student debt rose in terms of aggregate amount owed but fell as a fraction of aggregate income and net worth. Second, the average amount of student debt per family rose most, in proportional terms, for the highest quintiles of income and net worth. Third, the incidence of student debt in the highest quintiles of income and net worth was essentially unchanged, implying that the rise in the average debt held in these quintiles was not a result of changes in the number of student debtors in each quintile. Fourth, the mean-to-median ratio in student loans in the upper part of the distributions of income and net worth fell slightly, suggesting that this was a broad-based increase in debt and not driven by a small number of outliers within each quintile. These findings are potentially of interest to social scientists and policymakers because they have implications for the marginal effect of cancellation on social welfare. The more student debt balances are positively correlated with measures of ability to repay (such as income and net worth), the lower the welfare gains of debt cancellation are likely to be.
References
- Aladangady, Aditya, Jesse Bricker, Andrew C. Chang, Sarena Goodman, Jacob Krimmel, Kevin B. Moore, Sarah Reber, Alice Henriques Volz, and Richard A. Windle. 2023. “Changes in U.S. Family Finances from 2019 to 2022: Evidence from the Survey of Consumer Finances.” Washington: Board of Governors of the Federal Reserve System. https://doi.org/10.17016/8799.
- Bricker, Jesse, Meta Brown, Simona Hannon, and Karen M. Pence. 2015. “How Much Student Debt Is Out There?” FEDS Notes, August. https://doi.org/10.17016/2380-7172.1576.
- Catherine, Sylvain, and Constantine Yannelis. 2023. “The Distributional Effects of Student Loan Forgiveness.” Journal of Financial Economics 147 (2): 297–316. https://doi.org/10.1016/j.jfineco.2022.10.003.
- Goss, Jacob, Daniel Mangrum, and Joelle W. Scally. 2023. “Assessing the Relative Progressivity of the Biden Administration’s Federal Student Loan Forgiveness Proposal.” Staff Report 1046. Federal Reserve Bank of New York. https://fedinprint.org/item/fednsr/95425.
Endnotes
- Based on data from the Consumer Credit Panel (CCP); see the 2023 Q4 Quarterly Report on Household Credit and Debt available at https://www.newyorkfed.org/medialibrary/interactives/householdcredit/data/pdf/HHDC_2023Q4 for further information on aggregate quantities of debt. Return to 1
- See, for example, Catherine and Yannelis (2023) and Goss et al. (2023). Return to 2
- See the official release available at https://studentaid.gov/announcements-events/covid-19 for further details on eligible loans. Return to 3
- See the FAQ section at https://studentaid.gov/manage-loans/repayment/prepare-payments-restart for further details on the restarting of student loan payments. Return to 4
- These aggregate quantities are lower than those reported in the Quarterly Report on Household Credit and Debt quoted in endnote 1. This is, in part, because the SCF will not record the financial outcomes of economically independent people living at the same address as the respondent. See Bricker et al. (2015) for further discussion. Return to 5
- This is consistent with Aladangady et al. (2023), who document an increase in the share of debt held by the upper two quintiles of the variable “usual income” as measured in recent waves of the SCF. Return to 6
Suggested Citation
Moschini, Emily, and Tom Phelan. 2024. “The Evolution of Student Debt 2019–2022: Evidence from the Survey of Consumer Finances.” Federal Reserve Bank of Cleveland, Economic Commentary 2024-10. https://doi.org/10.26509/frbc-ec-202410
This work by Federal Reserve Bank of Cleveland is licensed under Creative Commons Attribution-NonCommercial 4.0 International

