

- Share
Disability, Immigration, and Postpandemic Labor Supply
We study the large labor force increases since 2020 among disabled workers and among foreign-born workers in the United States. We show that the increase in the disabled labor force largely reflects a change in self-reported disability status among those already in the labor force rather than an actual increase in labor supply. We conjecture that immigration will likely contribute more to labor supply in 2024 than it did before the pandemic, but less than in 2020–2023.

The views authors express in Economic Commentary are theirs and not necessarily those of the Federal Reserve Bank of Cleveland or the Board of Governors of the Federal Reserve System. The series editor is Tasia Hane. This paper and its data are subject to revision; please visit clevelandfed.org for updates.
Introduction
The combination of strong job gains, moderating wage growth, and only small increases in the unemployment rate during 2023 surprised many analysts and forecasters.1 Some policymakers have suggested that increases in labor supply can help explain these observations, but that these increases are unlikely to persist much longer. For example, minutes from the December 2023 Federal Open Market Committee meeting report that “[Participants] assessed that the contribution of improved supply had come from. . . boosts to labor supply due to a higher labor force participation rate [LFPR] and immigration. [But] several participants assessed that healing in…labor supply was largely complete.”
In this Economic Commentary, we study labor force increases among disabled workers and among foreign-born workers since 2020. We show that the increase in the number of disabled workers in the labor force reflects little increase in the number of additional people in the labor force. Rather, this increase mostly reflects a change in self-reported disability status among those already in the labor force. Based on our analyses of the foreign-born labor force, we conjecture that immigration will likely contribute more to labor supply in 2024 than it did before the pandemic, but less than it did in 2020–2023. All else being equal, if further large increases in labor supply are unlikely, that could imply some downward pressure on employment growth going forward.
Some Facts about the Labor Force since 2020
Employment—as measured in the Current Population Survey (CPS)—has risen by about 11 million persons between October 2020 and October 2023. In the meantime, the labor force has risen by about 7 million.2 In particular, the labor force has expanded markedly among workers with disabilities and foreign-born workers: The disabled labor force has risen by about 2 million persons, and the foreign-born labor force has risen by about 4 million.3 Our analysis focuses on these large labor force increases.
The Disabled Labor Force
Some research has noted the recent labor force increases among disabled workers and related these increases to remote work. For example, Ne’eman and Maestas (2022) find that “the employment rate of people with disabilities has grown more quickly [than those without disabilities] in 2021Q4 through 2022Q2, driven by increased labor force participation.” And Schur, Ameri, and Kruse (2020) find that workers with disabilities are more likely to work from home than workers without disabilities. Relatedly, Barrero, Bloom, and Davis (2023) write that remote work creates “new job opportunities for. . . people with mobility impairments that make it hard to commute. . . . And these opportunities will draw some of these people in the labor force, expanding labor supply.”
Our analysis suggests that the rise in the disabled labor force since 2020 reflects little increase in labor supply, but, rather, changes in self-reported disability status among those already in the labor force.
The Disabled Labor Force since 2020
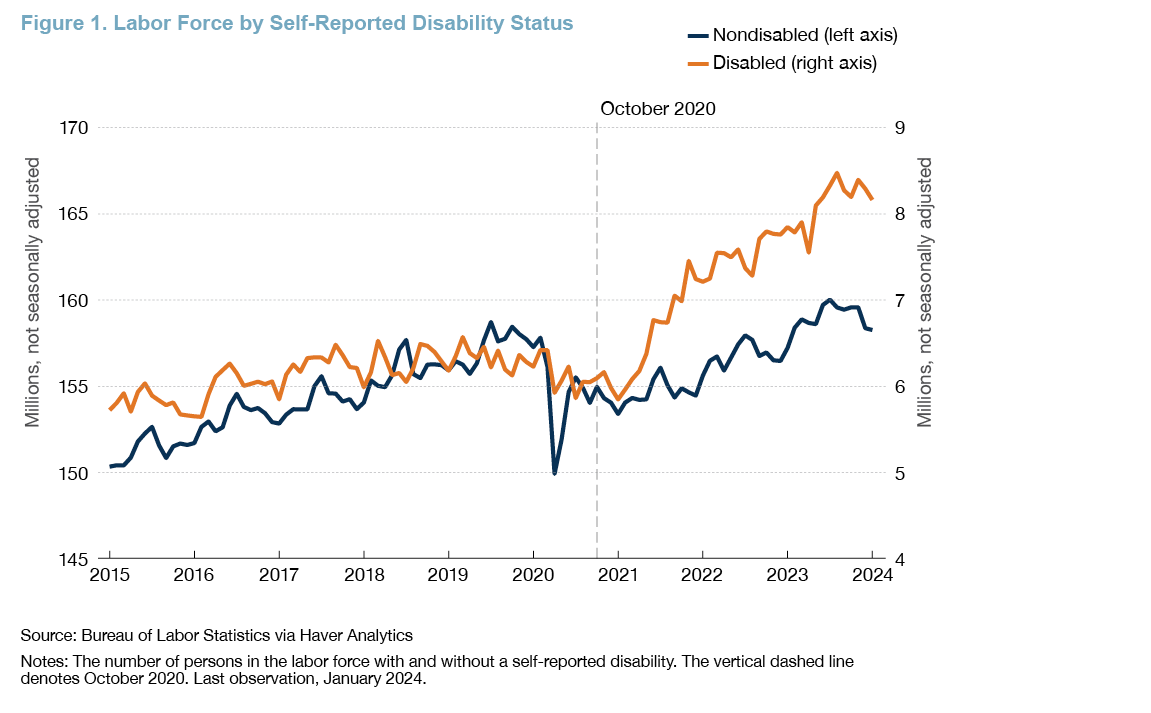
The increases in the disabled labor force since October 2020 have been large, and distinctly different from the trend before the pandemic, as shown in Figure 1. The labor force of disabled workers has risen from about 6 million in October 2020 to more than 8 million at the end of 2023. In contrast, the disabled labor force moved little in the five years leading up to the pandemic: It was about 6 million at the beginning of 2015 and only slightly above 6 million at the beginning of 2020. The large increases in the disabled labor force since 2020 also contrast with the increases in the labor force of those without disabilities, increases which are similar to their prepandemic trend.
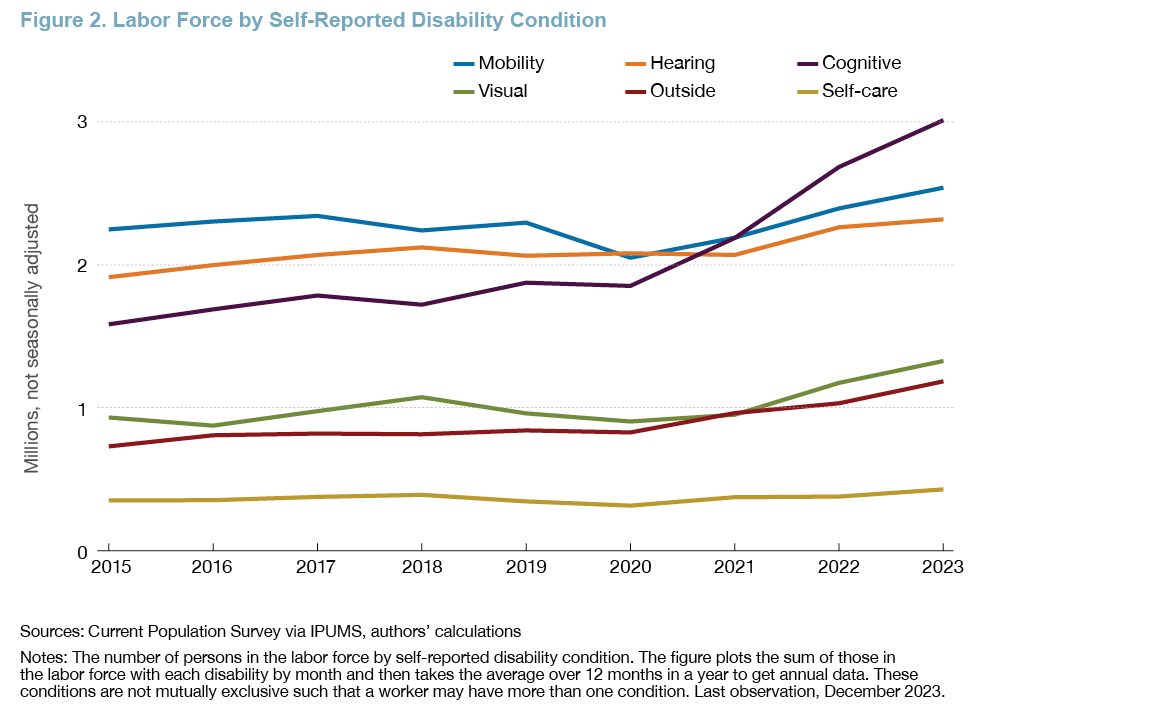
To understand the sources of this increase in the disabled labor force, we turn to CPS individual-level data. Six self-reported conditions determine disability in the CPS: hearing impairment, visual impairment, cognitive impairment, mobility impairment, difficulty with self-care, and difficulty outside of the home.4 These conditions are not mutually exclusive such that a worker may have more than one condition.
Increases in the labor force in the last three years have been largest among those with cognitive (purple line) and mobility impairments (blue line) and those with difficulties outside of the home (maroon line), as shown in Figure 2. These conditions could be related to symptoms of long-COVID, such as difficulty climbing stairs and “brain fog” (Lau et al., 2022; Nouraeinejad, 2023). Small increases in the labor force have also occurred among the visually impaired (green line), but the number of persons in the labor force with hearing impairments (orange line) and with difficulties performing self-care activities (gold line) has moved little in the last three years.
These labor force increases among disabled workers may not reflect an actual increase in labor supply, but, rather, a change in disability status. For example, those who were in the labor force without a disability prior to the pandemic might now be in the labor force with a disability such as “brain fog,” a cognitive impairment related to long-COVID (see, for example, Ne’eman and Maestas, 2022 for this interpretation). Additionally, there might be less stigma around reporting some disabilities after the pandemic, so persons might remain in the labor force but be more likely to report a disability. These changes would not reflect an increase in labor supply as measured by the number of people in the labor force.
Using Linked CPS Data to Study Worker Flows
To investigate these possibilities, we study labor market flows using longitudinally linked CPS data.5 We classify individuals by their labor force status (not in the labor force or in the labor force) and self-reported disability status (disabled or not disabled). Using the linked data, we compute the number of individuals in each of the four states in a specific month and their status 12 months later.6 For example, we can compute the number of persons who were in the labor force with a disability in January 2021 who are in the labor force with a disability 12 months later. We sum across all months within a year and divide by the number of observations in the originating status to provide transition probabilities (in percent) between each status in a four-by-four matrix. The rows of this matrix sum to 100 because the four states are mutually exclusive and exhaustive: A linked individual starting in one of the rows in 2021 must transition to one of the four states the following year. We present the results for 2021–2022 in Table 1.
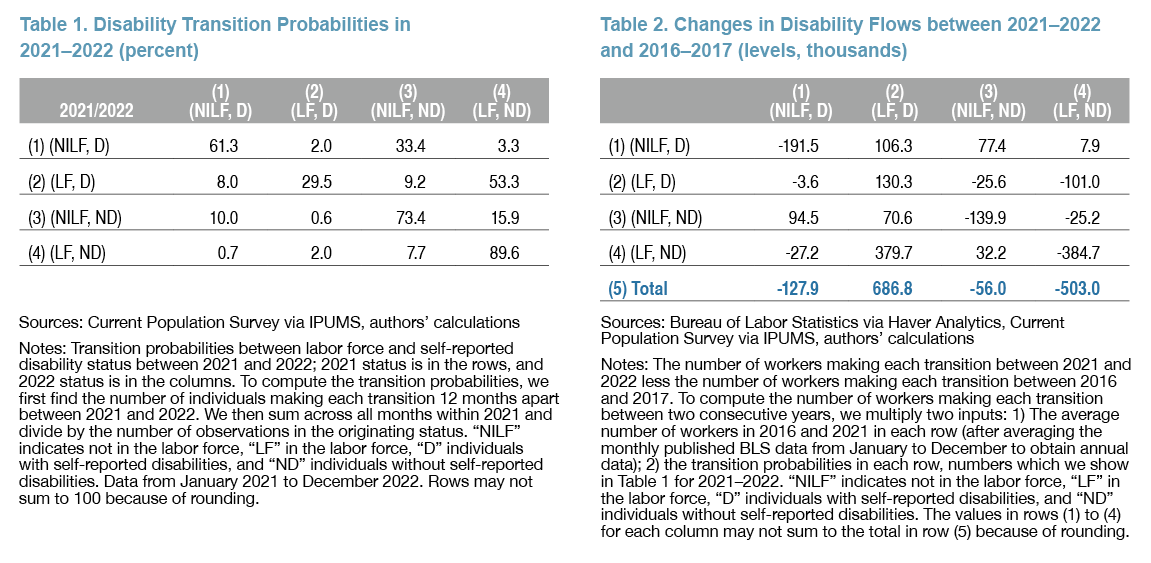
This table shows that the self-reported CPS measure of disability is relatively transient regardless of initial labor force status. The largest numbers in a row are typically on the diagonal, indicating that individuals are most likely to retain their labor force and disability status 12 months apart. However, only 29.5 percent of individuals remain in the disabled labor force 12 months apart (row 2, column 2); 53.3 percent of individuals remain in the labor force but change disability status from disabled to not disabled (row 2, column 4). Relatedly, 33.4 percent of individuals remain out of the labor force but change disability status from disabled to not disabled (row 1, column 3). As such, individuals who reported a disability in the CPS, whether they are in the labor force or not, often do not report a disability 12 months later.
To better understand and interpret the magnitudes in Table 1, we compare the number of persons making these transitions in 2021–2022 to the number of persons making these transitions before the pandemic. We take the percentages from Table 1 and multiply them by the average number of persons in each row in 2016 and 2021 to find the number of workers making each transition.7 Then, we subtract the equivalent matrix from 2016–2017 to show how worker flows have changed over time.8
Much of the increase in the disabled labor force after the pandemic is accounted for by switching disability status rather than an actual increase in labor supply, as shown in Table 2, column 2. Relative to those in 2016–2017, there are more flows into the disabled labor force in 2021–2022 by almost 700,000 people, which is the sum of column 2 shown in row 5. This increase, which uses the linked sample, is consistent with the increase in the disabled labor force in Figure 1, which uses cross-sectional samples. However, about 55 percent of this overall increase into the disabled labor force is accounted for by increased flows by individuals who were already in the labor force without a disability but who switch disability status (380,000 in row 4, column 2). That is, individuals who were already in the labor force and not disabled are more likely to remain in the labor force but switch disability status in 2021–2022 relative to in the prepandemic period. This increased flow is not an increase in the number of persons in the labor force. Almost 20 percent of the overall increase in the flows into the disabled labor force is explained by increases in more disabled individuals remaining in the labor force (130,000 in row 2, column 2) in 2021–2022 relative to in prepandemic years. Finally, there are more disabled individuals joining the labor force in 2021–2022 (106,000 in row 1, column 2). This represents an actual increase in labor supply: these individuals have switched labor force status and retained their disability status. But these increases account for a small share—about 15 percent—of the total increase in the flows into the labor force of disabled workers. This increase in labor supply could be explained by the increased incidence of remote work, but we leave this topic for future research.
The Foreign-Born Labor Force
CPS estimates suggest that the foreign-born population has grown significantly over the last three years, drawing the attention of policymakers and of the media (for example, Powell, November 2023; Omeokwe, January 2024). We study alternative estimates of the foreign-born population and conjecture that immigration will likely contribute more to labor supply in 2024 than it did before the pandemic, but less than in 2020–2023.
CPS Estimates of the Foreign-Born Labor Force Since 2020
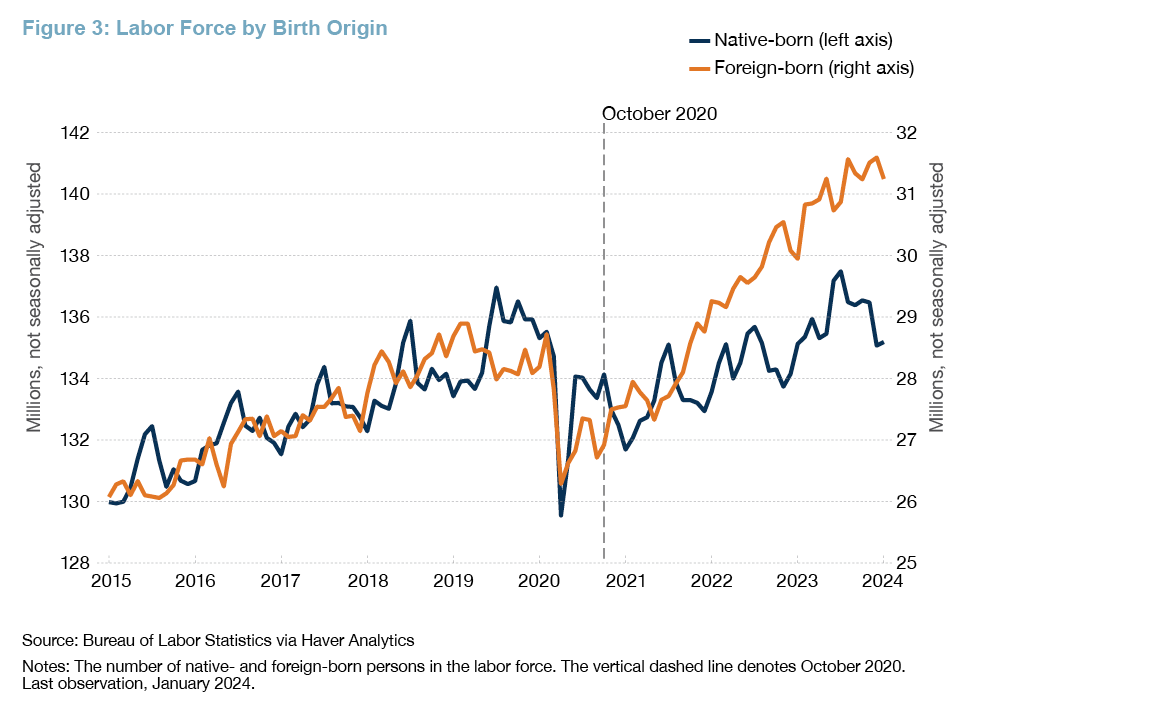
CPS estimates suggest that the increase in the foreign-born labor force over the last three years has been large, as shown in Figure 3.9 The foreign-born labor force is estimated to have grown by 4.3 million, from 27.9 million in October 2020 to 31.2 million in October 2023. In comparison, the native-born labor force has grown by only 2.4 million over the same period. A simple decomposition suggests that about 75 percent of this foreign-born labor force increase is accounted for by population changes, and about 25 percent is accounted for by LFPR changes. We focus on understanding the population changes.
ACS vs. CPS Estimates of the Foreign-Born Labor Force
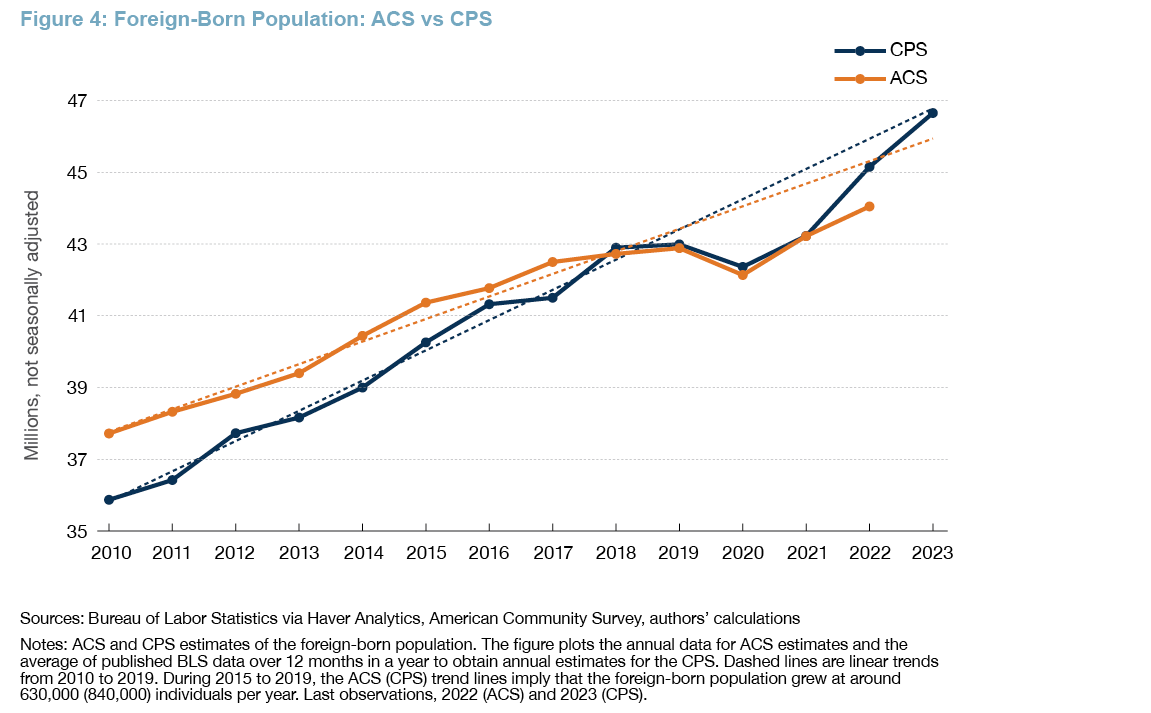
We compare estimates of the foreign-born population from the American Community Survey (ACS) to those from the CPS.10 ACS estimates of growth in the foreign-born population are likely more reliable than CPS estimates for two reasons. First, the ACS has a larger sample size than the CPS, interviewing about 3.5 million households in a year (US Census Bureau, 2023a) compared to about 60,000 households per month in the CPS (Bureau of Labor Statistics, 2023a). Second, the ACS has higher response rates than the CPS: The 2022 response rate is about 85 percent in the ACS (US Census Bureau, 2023b) and about 75 percent in the CPS (Bureau of Labor Statistics, 2023b). Publicly available data for the ACS are available only through 2022 as of February 2024.
As shown in Figure 4, ACS estimates suggest that the foreign-born population has grown by 1.9 million between 2020 and 2022, while CPS estimates suggest an increase of 2.8 million. As such, CPS estimates of the foreign-born population growth between 2020 and 2022 are likely exaggerated by almost 1 million.
Butcher et al. (2023) also suggest that CPS estimates of foreign-born population growth between 2020 and 2023 are likely exaggerated. Their argument is based on individual sample weights. In particular, CPS weights do not target external data for the number of foreign-born workers. Moreover, Butcher et al. (2023) find that the foreign-born weights increased substantially after February 2020 and that this increase cannot be explained by changes in worker and survey characteristics. Based on data from the Department of Homeland Security and Customs and Border Protection, the authors estimate that the foreign-born population grew somewhere between 1 million and 3.5 million workers, instead of the 4.3 million workers implied by the CPS.11
Based on ACS data and activity on Indeed—an online job posting site—we conjecture that immigration could contribute more to labor supply in 2024 than it did before the pandemic, but less than in 2020–2023. In particular, back-of-the-envelope calculations using the ACS data suggest that immigration could increase employment, over and above prepandemic trends, by no less than 20,000 jobs per month and no more than 50,000 jobs per month.12 In contrast, according to CPS estimates, the foreign-born population returned to the prepandemic trend in 2023, as shown in Figure 4. Nevertheless, because the ACS estimates suggest less growth in the foreign-born population than the CPS estimates since 2020, the ACS estimates suggest that there might be less momentum in immigration going forward. Relatedly, the share of clicks from outside the United States on Indeed job postings has plateaued in 2023 after rising steadily between 2020 and 2022. As such, “if interest from job seekers outside the US is any indication, immigration is unlikely to. . . provide a larger boost to the labor force [in 2024]” (Bunker, 2023).13
Conclusion
This Economic Commentary examines the increases in the disabled labor force and the foreign-born labor force after the pandemic recession. Our analysis suggests that the increase in the disabled labor force reflects little increase in the number of additional people in the labor force. Rather, this increase mostly reflects a change in self-reported disability status among those already in the labor force. Based on our analysis of the foreign-born labor force, we conjecture that immigration will likely contribute more to labor supply in 2024 than it did before the pandemic, but less than in 2020–2023. If further large increases in labor supply are unlikely, this could put some downward pressure on employment growth, all else being equal.
References
- Barrero, Jose Maria, Nicholas Bloom, and Steven J. Davis. 2023. “The Evolution of Work from Home.” Working paper 31686. National Bureau of Economic Research. https://doi.org/10.3386/w31686.
- Bauer, Lauren, and Sarah Yu Wang. 2023. “Prime-Age Women Are Going Above and Beyond in the Labor Market Recovery.” Brookings. https://www.brookings.edu/articles/prime-age-women-labor-market-recovery/.
- Bunker, Nick. 2023. “Indeed’s 2024 US Jobs & Hiring Trends Report: Reasons for Cautious Optimism.” Indeed Hiring Lab. November 15, 2023. https://www.hiringlab.org/2023/11/15/indeeds-2024-us-jobs-hiring-trends-report/.
- Butcher, Kristin, Lucas Cain, Camilo García-Jimeno, and Ryan Perry. 2023. “Immigration and the Labor Market in the Post-Pandemic Recovery.” Working paper 2023-39. Federal Reserve Bank of Chicago. https://doi.org/10.21033/wp-2023-39.
- Congressional Budget Office. 2024. "The Demographic Outlook: 2024-2025." https://www.cbo.gov/publication/59697.
- Federal Open Market Committee. 2024. “Minutes of the Federal Open Market Committee December 12-13, 2023.” Board of Governors of the Federal Reserve System. https://www.federalreserve.gov/monetarypolicy/files/fomcminutes20231213.pdf.
- Flood, Sarah, Miriam King, Renae Rodgers, Steven Ruggles, J. Robert Warren, Daniel Backman, Annie Chen, Grace Cooper, Stephanie Richards, Megan Schouweiler, and Michael Westberry. 2023. “IPUMS, Current Population Survey: Version 11.0 [Dataset].” Minneapolis, MN: IPUMS. https://doi.org/10.18128/D030.V11.0.
- Lau, Bryan, Eryka Wentz, Zhanmo Ni, Karine Yenokyan, Candelaria Vergara, Shruti H. Mehta, and Priya Duggal. 2023. “Physical Health and Mental Fatigue Disability Associated with Long COVID: Baseline Results from a US Nationwide Cohort.” The American Journal of Medicine, September. https://doi.org/10.1016/j.amjmed.2023.08.009.
- Ne’eman, Ari, and Nicole Maestas. 2022. “How has COVID-19 Impacted Disability Employment?” Disability and Health Journal 16(2): 101429. https://doi.org/10.1016/j.dhjo.2022.101429.
- Nouraeinejad, Ali. 2023. “Brain fog as a Long-term Sequela of COVID-19.” SN Comprehensive Clinical Medicine 5(9). https://doi.org/10.1007/s42399-022-01352-5.
- Omeokwe, Amara. 2024. “Labor Supply Helped Tame Inflation. It Might Not Have Much More to Give.” The Wall Street Journal. https://www.wsj.com/economy/jobs/labor-supply-helped-tame-inflation-it-might-not-have-much-more-to-give-0d694844?mod=hp_lead_pos4.
- Powell, Jerome H. 2023. “Opening Remarks at ‘Monetary Policy Challenges in a Global Economy,’ a Policy Panel at the 24th Jacques Polak Annual Research Conference Hosted by the International Monetary Fund.” Washington DC: Board of Governors of the Federal Reserve System. https://www.federalreserve.gov/newsevents/speech/powell20231109a.htm.
- Prabhakar, Deepika Baskar, and Robert G. Valletta. 2024. “Why Is Prime-Age Labor Force Participation So High?” FRBSF Economic Letter, no. 2024-03 (February). https://www.frbsf.org/wp-content/uploads/el2024-03.pdf.
- Schur, Lisa A., Mason Ameri, and Douglas Kruse. 2020. “Telework After COVID: A ‘Silver Lining’ for Workers with Disabilities?” Journal of Occupational Rehabilitation 30 (4): 521–536. https://doi.org/10.1007/s10926-020-09936-5.
- Tito, Maria D. 2024. “Does the Ability to Work Remotely Alter Labor Force Attachment? An Analysis of Female Labor Force Participation.” FEDS Notes, January 19, 2024. Board of Governors of the Federal Reserve System. https://doi.org/10.17016/2380-7172.3433.
- US Bureau of Labor Statistics. 2023a. “CPS Response Rates.” 2023. https://www.bls.gov/cex/cecomparison/cps_profile.htm.
- US Bureau of Labor Statistics. 2023b. “Current Population Survey.” 2023. https://www.bls.gov/cex/cecomparison/cps_profile.htm.
- US Census Bureau. 2023a. “Response Rates.” https://www.census.gov/acs/www/methodology/sample-size-and-data-quality/response-rates/.
- US Census Bureau. 2023b. “Top Questions About the Survey.” https://www.census.gov/programs-surveys/acs/about/top-questions-about-the-survey.html.
Endnotes
- For example, the mean January 2023 Blue Chip forecast for the 2023:Q4 unemployment rate was 4.8 percent. But the unemployment rate was 3.7 percent in December 2023. Blue Chip is a resource of Wolters Kluwer Legal and Regulatory Solutions US. Return to 1
- The rest of the increases in employment are largely accounted for by fewer unemployed persons. Return to 2
- The prime-age labor force has also risen by about 4 million between 2020 and 2023. We do not present our results about this increase because they contribute little to existing work. For example, see Prabhakar and Valletta (2024) for evidence that the “cyclical gains in prime-age labor force participation” may have peaked, and see Bauer and Wang (2023) and Tito (2024) for evidence that remote work has likely helped increase the LFPR of women, especially for those with young children. Return to 3
- Specifically, the six conditions are 1) deaf, or serious difficulty hearing (hearing impairment); 2) blind, or serious difficulty seeing even when wearing glasses (visual impairment); 3) serious difficulty concentrating, remembering, or making decisions because of a physical, mental, or emotional condition (cognitive impairment); 4) serious difficulty walking or climbing stairs (mobility impairment); 5) difficulty dressing or bathing (self-care); and 6) difficulty doing errands alone, such as visiting a doctor’s office or shopping, because of a physical, mental, or emotional condition (difficulty outside home). Return to 4
- Households in the CPS are typically in the sample for four months, out for eight months, and in for four months. As such, some individuals can be linked across surveys and followed for up to 16 months. Return to 5
- We use individual-level longitudinal weights from IPUMS so that our sample is representative of the US population. Results are similar when we use CPS final weights or unweighted data. Return to 6
- We multiply flow rates by the average of the 2016 and 2021 levels in each row to study the effects of changing transition probabilities rather than the changes in the levels over this period. Nevertheless, our conclusions based on Table 2 are largely unchanged if we multiply the transition probabilities in 2016 and 2021 by the levels in each row for the respective year. Return to 7
- Using 2018–2019 as the prepandemic period makes little difference to the results. Return to 8
- The foreign-born population is composed of anyone who is not a U.S. citizen at birth. Return to 9
- ACS data are annual. We plot the average of published BLS data over 12 months in a year to obtain annual estimates for the CPS. Return to 10
- Uncertainty about how many unauthorized immigrants stay in the United States underlies the broad range of these estimates. Return to 11
- If we assume that the growth in the ACS estimates of foreign-born population in 2023 was the same as it was in 2022 (0.8 million), then the projected estimate of the 2023 ACS foreign-born population would be 44.9 million, about 1 million below the extrapolated prepandemic linear trend. If we further assume that foreign-born population growth returns to its extrapolated prepandemic trend in 2024—likely an overestimate of foreign-born population growth in 2024—then population growth will be boosted by about 1 million in 2024. Because the foreign-born employment-population ratio was on average 64.2 in 2023, employment could be boosted by about 640,000 over and above prepandemic contributions, which is roughly 50,000 per month. If ACS foreign-born population growth in 2023 was as high as in the CPS (1.5 million)—likely an overestimate for 2023—the same calculations suggest that immigration will boost employment by about 20,000 per month in 2024. Return to 12
- There exists uncertainty over both the amount of immigration in 2022 and 2023 and the expected amount of immigration in 2024. For example, the Congressional Budget Office—based on information from the Department of Homeland Security and the Census Bureau—estimates that net immigration was 2.6 million in 2022 and 3.3 million in 2023 (Congressional Budget Office, 2024). The CBO projects that net immigration will be 3.3 million in 2024. Return to 13
Suggested Citation
Guo, Angela, and Pawel M. Krolikowski. 2024. “Disability, Immigration, and Postpandemic Labor Supply.” Federal Reserve Bank of Cleveland, Economic Commentary 2024-05. https://doi.org/10.26509/frbc-ec-202405
This work by Federal Reserve Bank of Cleveland is licensed under Creative Commons Attribution-NonCommercial 4.0 International

