

- Share
Do Higher Markups Lower Labor’s Share of Income?
Higher price markups are typically associated with larger profits at the expense of labor's share of income. In this Economic Commentary, we challenge this view. The key to our argument is the reallocation of market shares toward labor-intensive firms, a reallocation caused by an increase in the prices of capital goods as a result of higher markups.

The views authors express in Economic Commentary are theirs and not necessarily those of the Federal Reserve Bank of Cleveland or the Board of Governors of the Federal Reserve System. The series editor is Tasia Hane. This paper and its data are subject to revision; please visit clevelandfed.org for updates.
The price of a product reflects the cost of making it—outlays on materials, labor, machinery, and so on—plus a markup over costs to generate profits for the investors. With higher markups, revenues grow relative to the cost of production, raising profits per unit sold.1 As revenue grows, labor compensation, in particular, amounts to a smaller share of the value of output.2 This almost mechanical relationship is the motivation behind the view that the recent decline in labor’s share of income in the United States is attributable to higher price markups (De Loecker et al., 2020; Farhi and Gourio, 2018).
The coincidence of rising profit margins and declining labor share in the United States has occurred against a backdrop of increasing market concentration in most industries and, therefore, has raised concerns about the health of competition in the United States.3 4 When competitive pressures ease, corporations can raise their prices without worrying too much about losing their customers. Relative to a competitive economy, higher prices raise profits at the expense of consumer welfare and are of particular concern for policymakers if the lack of competition is connected to antitrust activity on the part of corporations. But the economic link between markups and the labor share, per se, can be more subtle, especially in economies in which firms compete with each other using different production technologies. In their analysis of the US manufacturing sector, Kehrig and Vincent (2021) document substantial differences in how intensively establishments rely on labor for production. In such a setting, labor's share of income at the industry level is a weighted average of establishment-level labor shares, wherein each establishment is weighed by its share in total output. An industry's labor share, therefore, depends critically on which types of firms produce the majority of value added. A rise in price markups by all firms may reduce the labor share at each establishment but could raise the aggregate labor share if it presents a strong enough advantage for labor-intensive firms, allowing them to capture a larger share of the market. In this case, the broad decline of labor’s share of income that has drawn much public attention and research could not be attributed to higher price markups.5
To examine the link between markups and the labor share, in this Economic Commentary we use a model of US manufacturing to simulate the effects of a rise in price markups.6 When markups increase, this leads to higher output prices. Because some of the now more-expensive output is required to produce capital goods, higher markups raise the effective cost of capital relative to labor. This benefits those firms that rely relatively more on labor for production and raises their market share. Importantly, the redistribution of market shares following an increase in markups—away from capital-intensive firms and toward labor-intensive firms—offsets the mechanical decline in the labor share at the establishment level and can leave the aggregate labor share little changed.
Theoretical Model
The theoretical model used in our simulations is a macroeconomic model with industry dynamics, allowing for differences in labor intensities across establishments.7 It features a large number of firms with a range of production technologies competing against each other with products that are imperfect substitutes. Firms employ households for labor services and finance their capital from households' savings. Households, in turn, earn salaries and dividends and decide how much to spend and how much to save for the future. The size of the industry, the distributions of labor, capital, and market shares among firms are determined as a result of profit-maximizing behavior on the part of firms and consumption and savings decisions on the part of households.8 The resulting framework connects the production technologies at the establishment level with the industry-level response to changes in markups.9 This connection allows us to quantify the impact of markups on an industry's labor share based on the distributions of output and labor shares among firms as seen in US manufacturing.
For example, suppose there are two firms with different production technologies. Firm A produces its output using only capital, and Firm B uses only labor. By construction, the cost share of labor is zero percent in Firm A and 100 percent in Firm B. The labor share of income in each firm depends on revenue, or the value of its output, relative to its labor cost. If we assume that both firms mark up their costs by 25 percent when they set their prices, the ratio of costs to revenue—$1 in costs divided by $1.25 in revenue ($1 plus 25 percent markup)—results in a revenue breakdown of 80 percent costs and 20 percent profits. Because the costs of Firm B consist entirely of labor payments, labor's share in its income is 80 percent. Correspondingly, the labor share in Firm A's output is zero percent with a capital share of 80 percent.
The aggregate labor share in the economy depends on how much of the economy's output each firm produces. If the two firms split the market equally, each producing half the total output, the aggregate labor share would be 40 percent, the equal-weighted average of zero and 80 percent. If Firm B's market share is larger, so is the aggregate labor share, and vice versa. Firms' market shares and their respective labor shares are thus key to understanding the aggregate labor share.
The market shares in the model are determined by the degree of competition between firms and the relative costs of capital and labor in the economy. Under perfect competition, where the products of the two firms are perfectly substitutable for each other, the firm with the lower cost captures the entire market. Inexpensive labor, for instance, gives a cost advantage to Firm B, who then is the sole producer in the economy, and the firm’s aggregate labor share is 80 percent. If competition is imperfect, or if the products are not perfect substitutes, then both firms remain in operation, and the firm that uses the cheaper input will capture a larger share of the market.
Changes in the aggregate labor share are then driven by changes in the relative factor costs. A fall in the price of capital goods, for instance, would shift the production in the economy toward capital-intensive firms and reduce the labor share. A similar outcome would emerge in case of a rise in payroll taxes or a fall in corporate income taxes, both of which reduce the cost of capital relative to labor.
How about a rise in price markups driven by some fundamental economic source? Suppose that the products become less substitutable for each other. This could happen if customers develop a strong preference for one product over another, and the market gets segmented, for example, if Mac users become less willing to substitute a PC or vice versa. It could also happen if firms’ products become more distinct from other firms’ products, resulting, once again, in less willingness to substitute. In both cases, the customers become pickier and less price sensitive. This situation translates into higher market power for each firm, allowing them to raise their prices without losing much market share. Because costs of production are not directly affected by this change in consumer behavior, markups increase as a result.
All else being equal, higher markups reduce the labor share. If both firms mark up their costs by 35 percent instead of 25 percent, as we assumed for ease of calculation above, the ratio of costs to revenues would be about 74 percent (every $1 in costs is now divided by $1.35 in revenue), with profits now representing the remaining 26 percent of revenue. Under equal split of the market, the aggregate labor share declines to 37 percent (half of 74 percent) from 40 percent.
But all else is not necessarily equal. What if the relative costs of capital and labor changed as a result of higher markups? This could happen if some of the output is used to produce capital goods that are needed for production, such as microchips. A higher price markup would then also imply that capital becomes more expensive relative to labor. This primarily benefits the labor-intensive Firm B as its competitor now faces higher production costs. Firm B is able to expand its market share as a result. The resulting shift of production toward the labor-intensive firm tends to raise the aggregate labor share. Suppose that Firm B now captures 60 percent of the market in our example. The aggregate labor share then becomes 44 percent (60 percent of 74 percent and 40 percent of zero). The reallocation of production triggered by higher markups can therefore work in the opposite direction and raise the labor share in equilibrium.
Markups can affect relative factor costs through another mechanism. When raising markups to maximize profits, firms choose to sell fewer products at higher prices (an upward movement along the demand curve). Total production declines, a situation which reduces overall demand for capital and labor. That drop in demand will not only reduce the quantities of inputs used in production but also their value in the market. Whether lower demand will translate into a quantity drop or a price drop depends on the elasticity of supply for each factor. Most economists consider capital supply to be elastic and labor supply to be inelastic in the long run. This would imply that the likely long-run effect of a lower input demand is a drop in the wage rate with little change in employment and little effect on the cost of capital but with large drop in investment. This, too, would favor labor-intensive firms and allow them to capture a larger share of the market.
The macroeconomic equilibrium effects further complicate the assessment of how the labor share responds to a change in markups. A decline in production and the lower factor payments that ensue can affect sales, because firms' costs are partly households' income, for example, salaries. Weaker sales may, in turn, force firms to undo some of the increase in their prices. A quantitative assessment of how these mechanisms combine to determine the final outcome requires simulations using a model economy that we turn to next.
Distributions of Output and Labor Share in the Benchmark Economy
We begin the simulations by benchmarking the model economy to the US manufacturing sector in the 1980s. The availability of establishment-level information on employment, capital, and output over a long period of time renders the manufacturing sector ideal for our purposes. We set the parameters of the model to replicate the joint distribution of labor shares and value added observed in US manufacturing. In the benchmark economy, prices are marked up 18 percent over cost, a calculation which implies that profits represent 15 percent of total income. Labor's share is 61 percent, and the remaining 24 percent goes to capital.
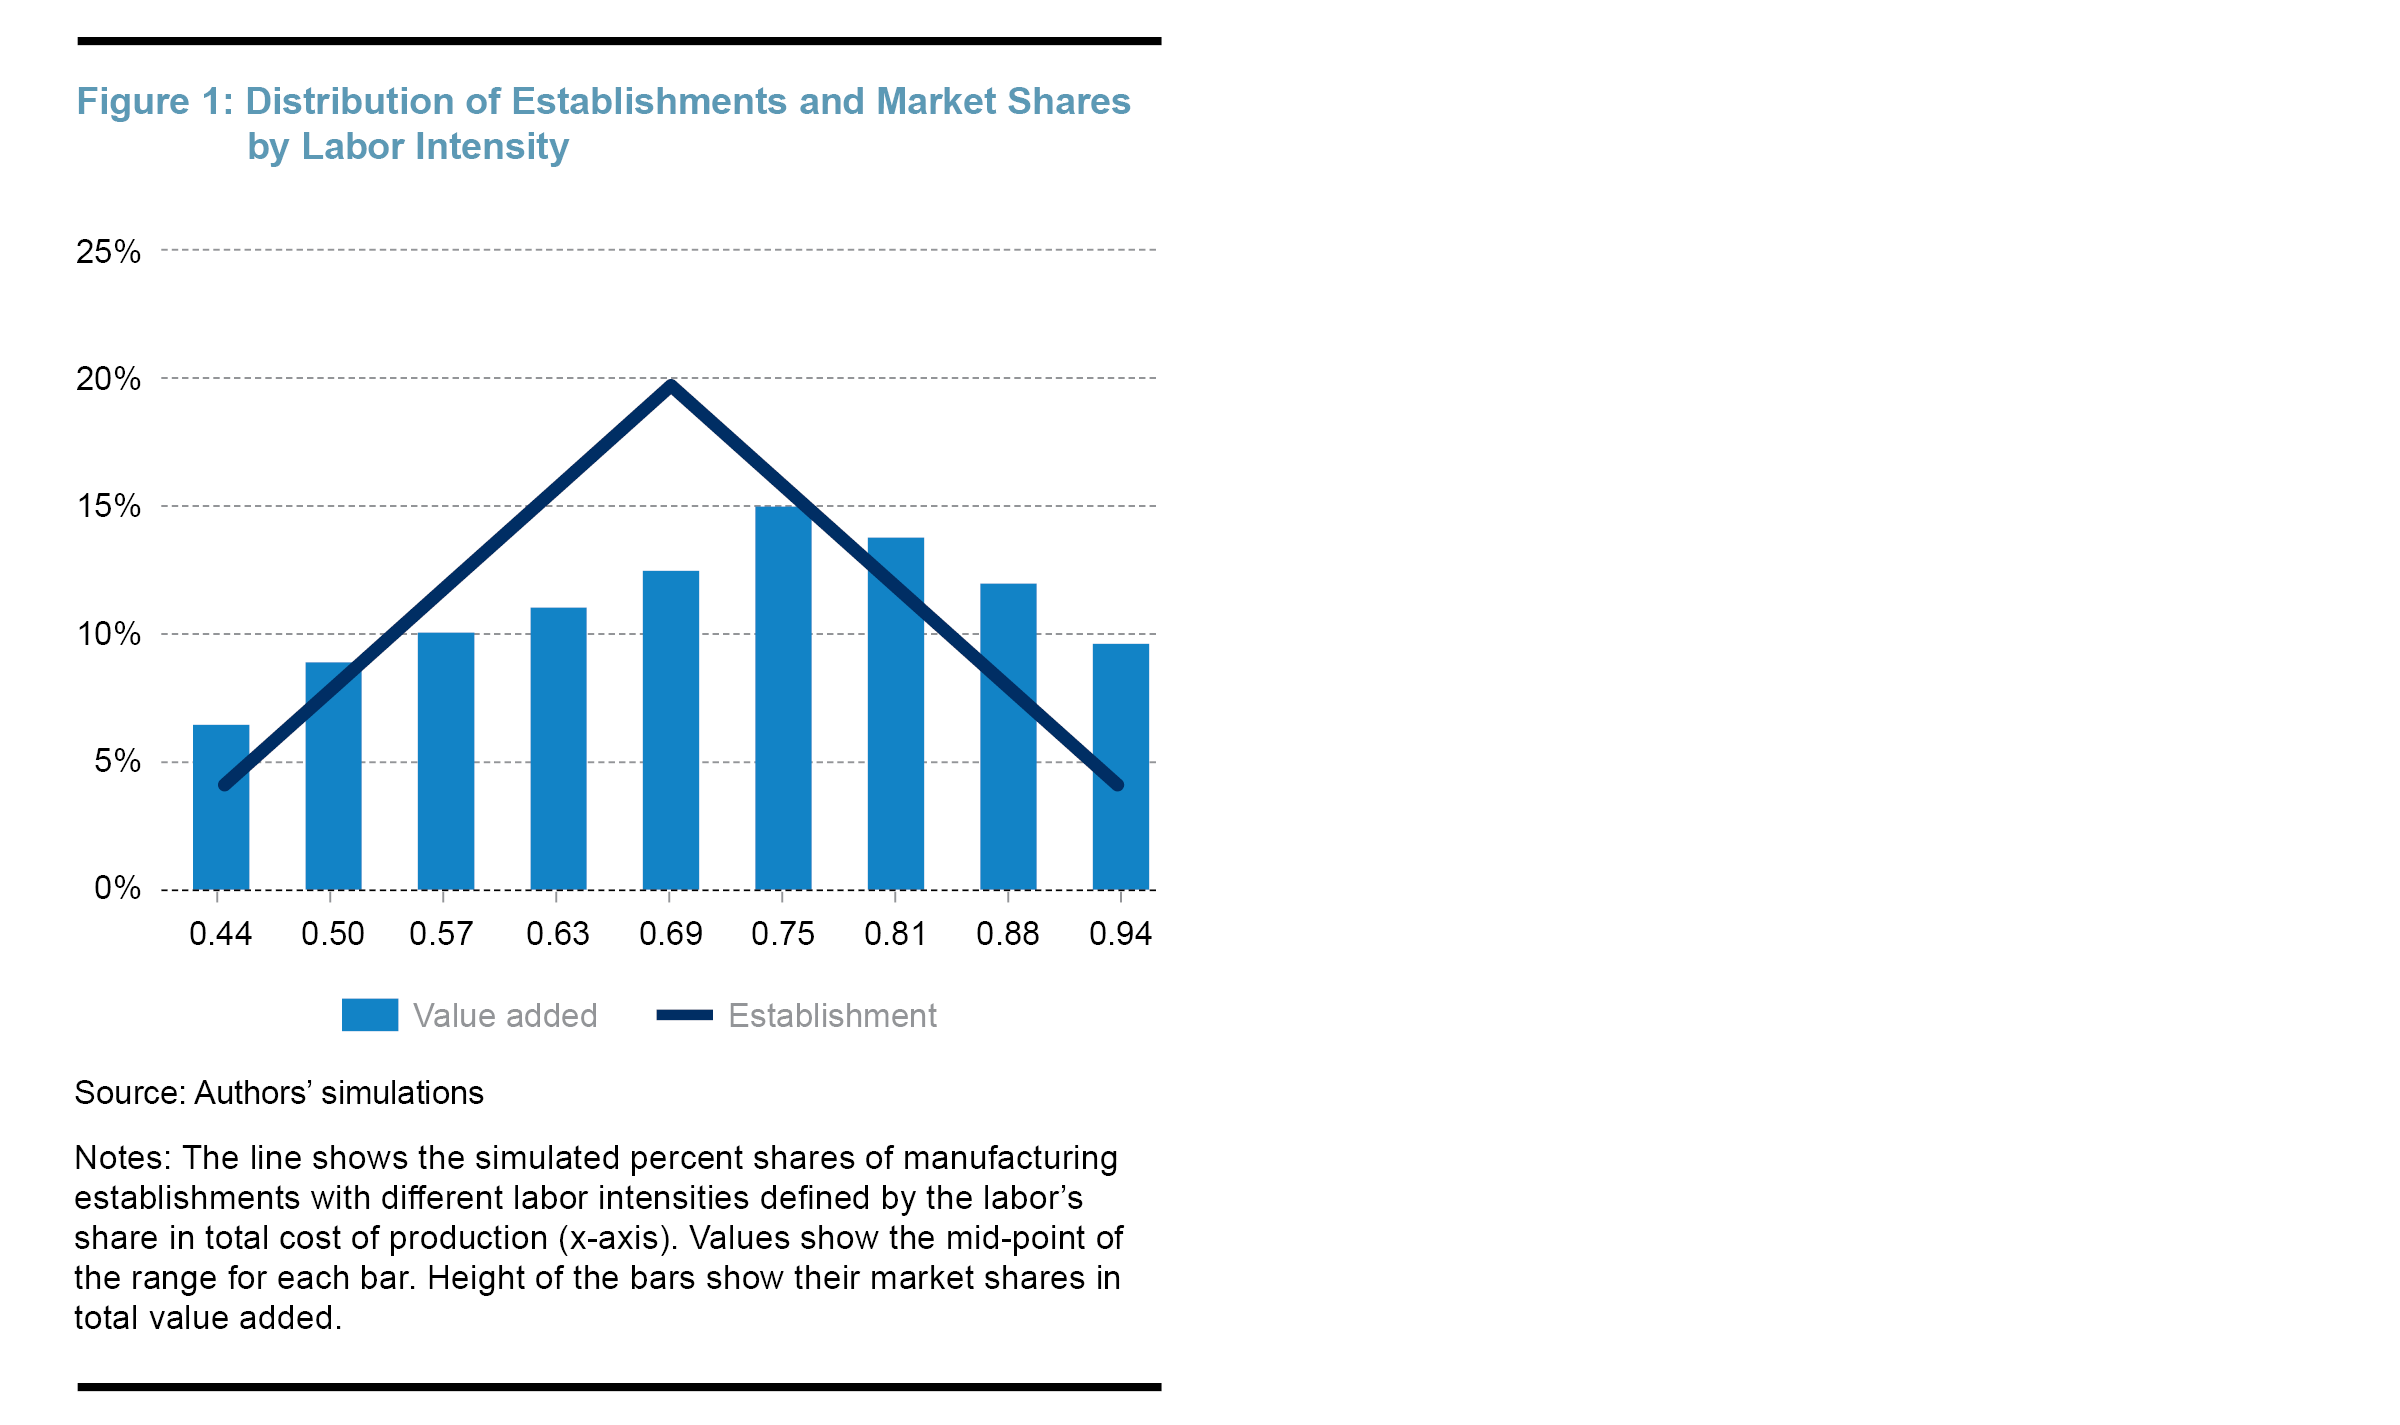
Figure 1 shows the distribution of establishments and their market shares in the simulated economy with respect to their labor intensities. Labor intensity is defined as labor's share in total cost of production and is shown along the horizontal axis. The calibrated values range from about 39 percent to 100 percent of total cost. The fraction of establishments with a particular labor intensity is shown by the triangular line. The distribution is symmetric, positioned around 69 percent, implying that the median firm uses more labor than capital in production, with an approximate ratio of 2:1. There are fewer establishments on either side of the median that make disproportionately more use of capital or labor in production.
The bars in Figure 1 show the output share of all establishments with the same labor intensity. Relative to the fraction of establishments, output shares tilt slightly right, toward labor-intensive firms (or less-capital-intensive firms). Using these as weights, labor represents 71 percent of total costs, slightly higher than the median because of the skew in market shares.
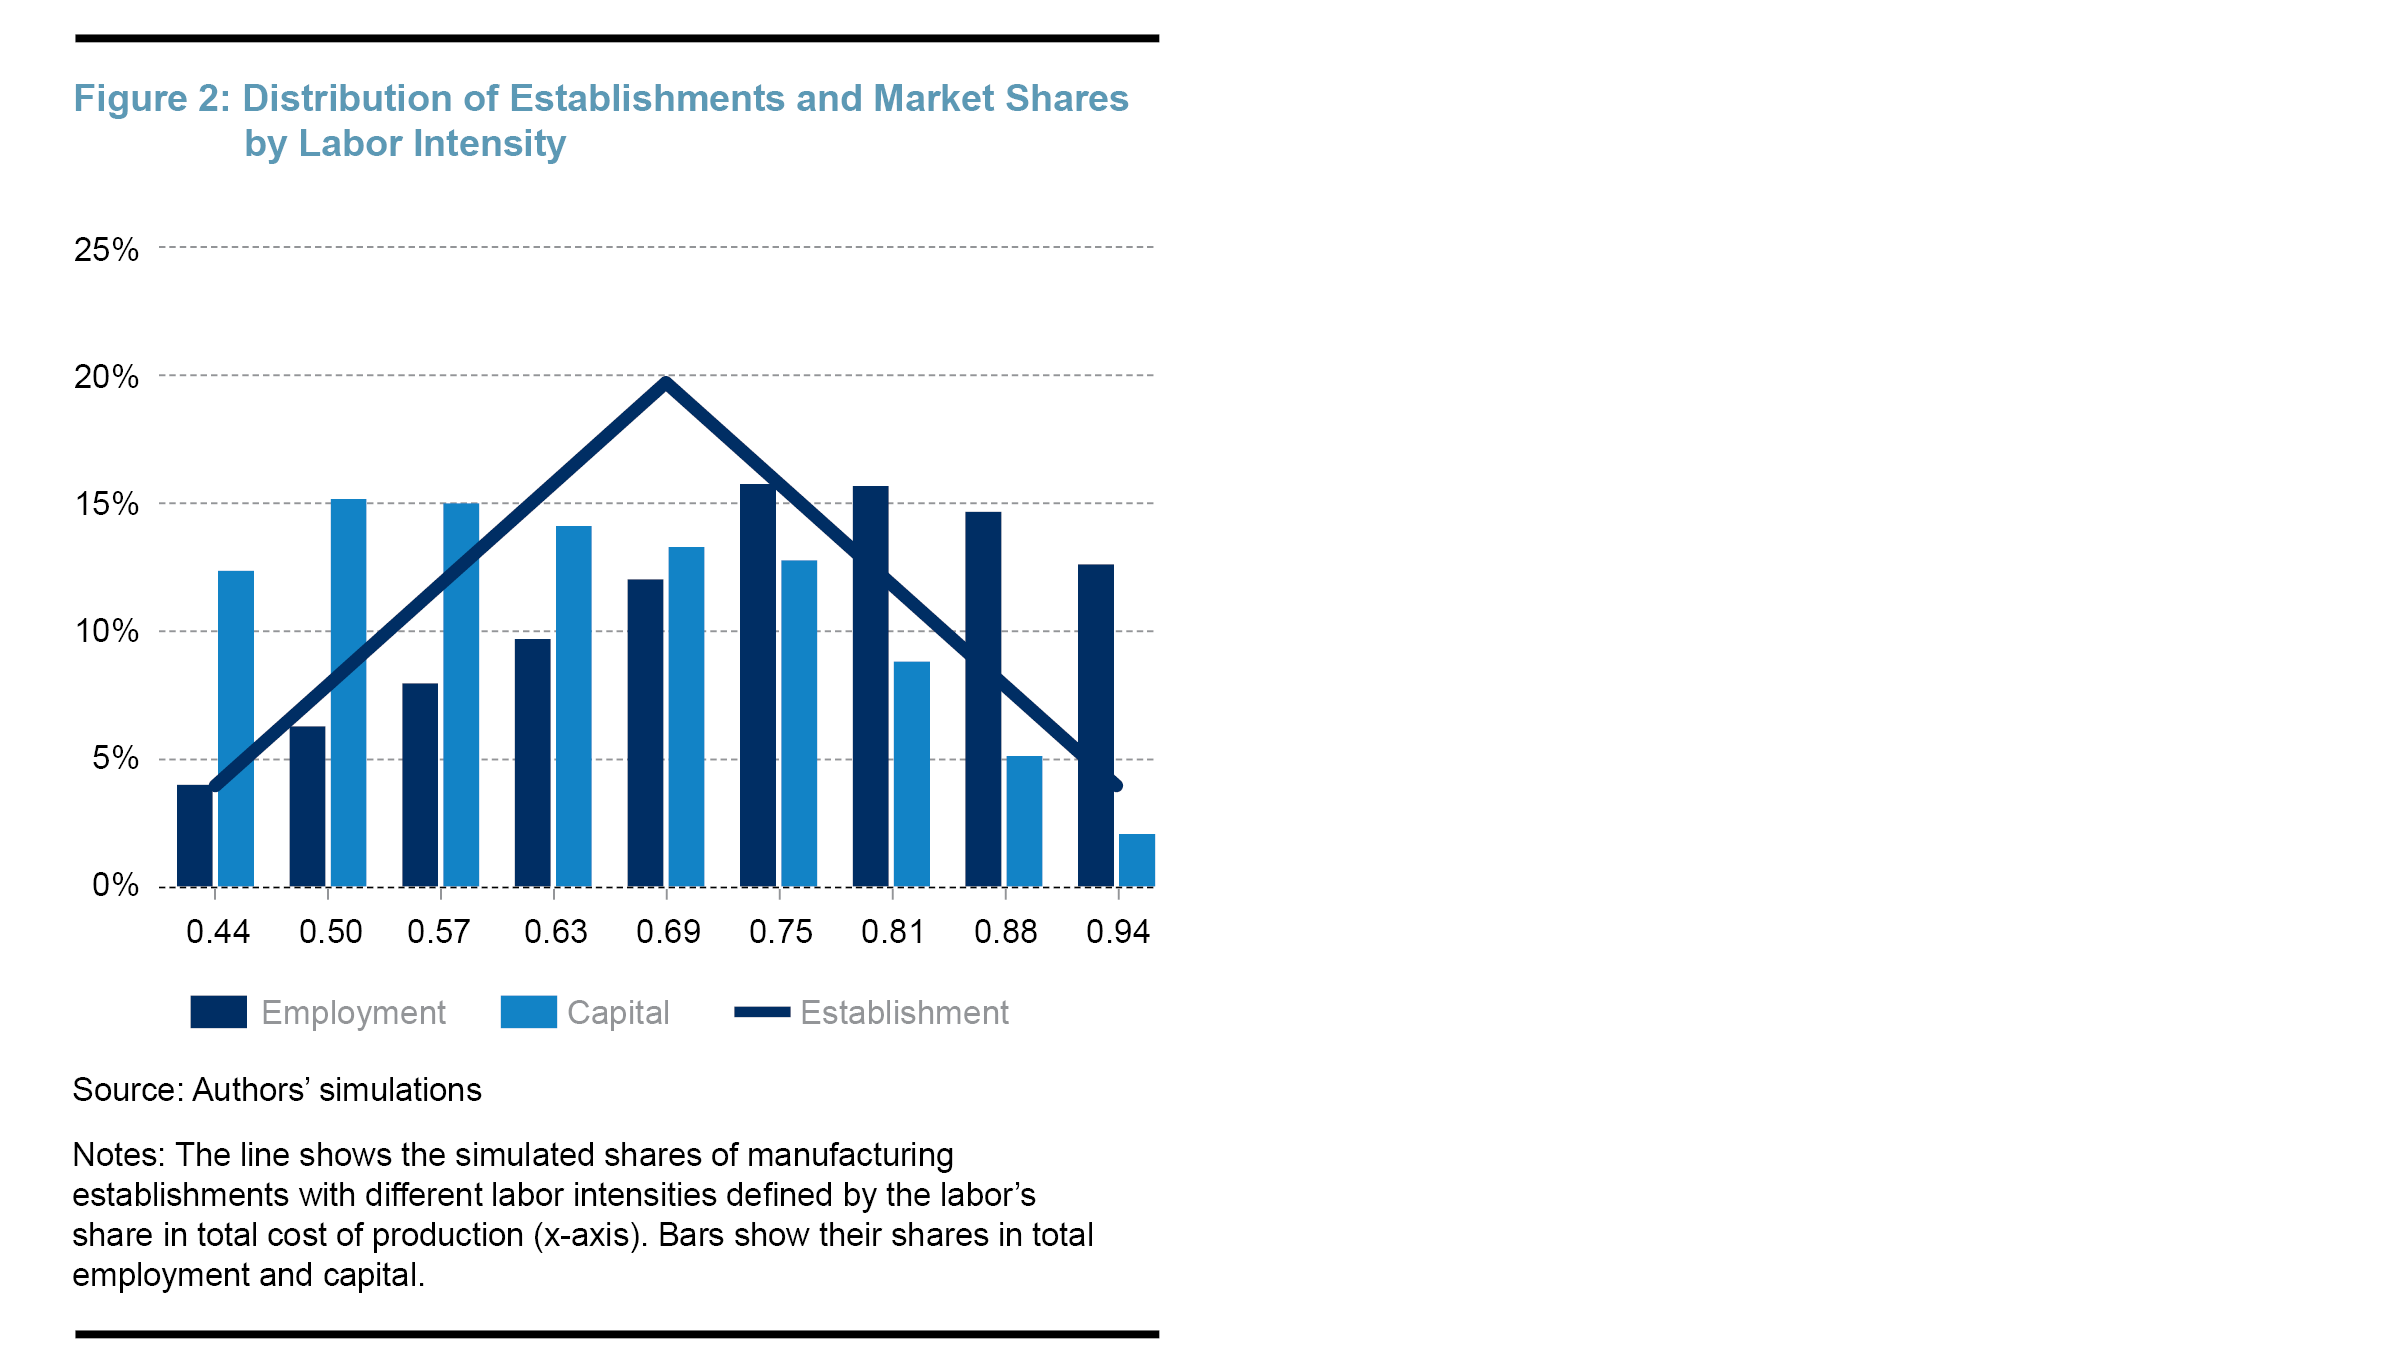
Figure 2 shows the distribution of capital and employment in the simulated economy. The line shows the share of establishments in each labor intensity group as in Figure 1. The bars show the share of these establishments in total capital and in total employment. Perhaps not surprisingly, capital-intensive establishments use more of the capital stock as shown by the strong leftward tilt of the lighter blue bars relative to the triangular line. Similarly, the employment distribution is skewed toward labor-intensive establishments. Establishments with 50 percent labor-intensity, for instance, produce 9 percent of output, hire 6 percent of workers, but use 15 percent of the total capital stock.
These patterns are a close representation of the US manufacturing sector during the 1980s. The triangular distribution of establishments turns out to be a close depiction of what is observed in the US manufacturing industry in the Census data in 1967 and has been stable over the following years (see Figure 1 in Kehrig and Vincent, 2021). The distribution of output shares was roughly symmetric between capital-intensive and labor-intensive firms, and the largest employers in the industry were more labor-intensive than the average establishment. It is reassuring that the distributions of market shares and labor intensities fit the data well since they shape the predictions of the industry's overall response to higher markups in the model. Next, we simulate a hypothetical equilibrium with a higher markup rate to assess its effects on the factor distribution of income.
Output and Labor Share in a High-Markup Economy
To analyze the implications of higher markups, we raise markups from 18 percent to 25 percent, a number which is equivalent to raising profit's share in income from 15 percent to 20 percent. We achieve this by reducing the elasticity of substitution between the products of different firms, giving firms more pricing power. Because our objective is to study the effects of higher markups on the economy in isolation, we hold all other parameters constant. We do, of course, allow firms and households to reoptimize their decisions and compute the new long-run equilibrium under higher markups. We then compare the resulting economy with the benchmark economy to gauge the effect of markups on the distribution of labor shares and value added in the industry.
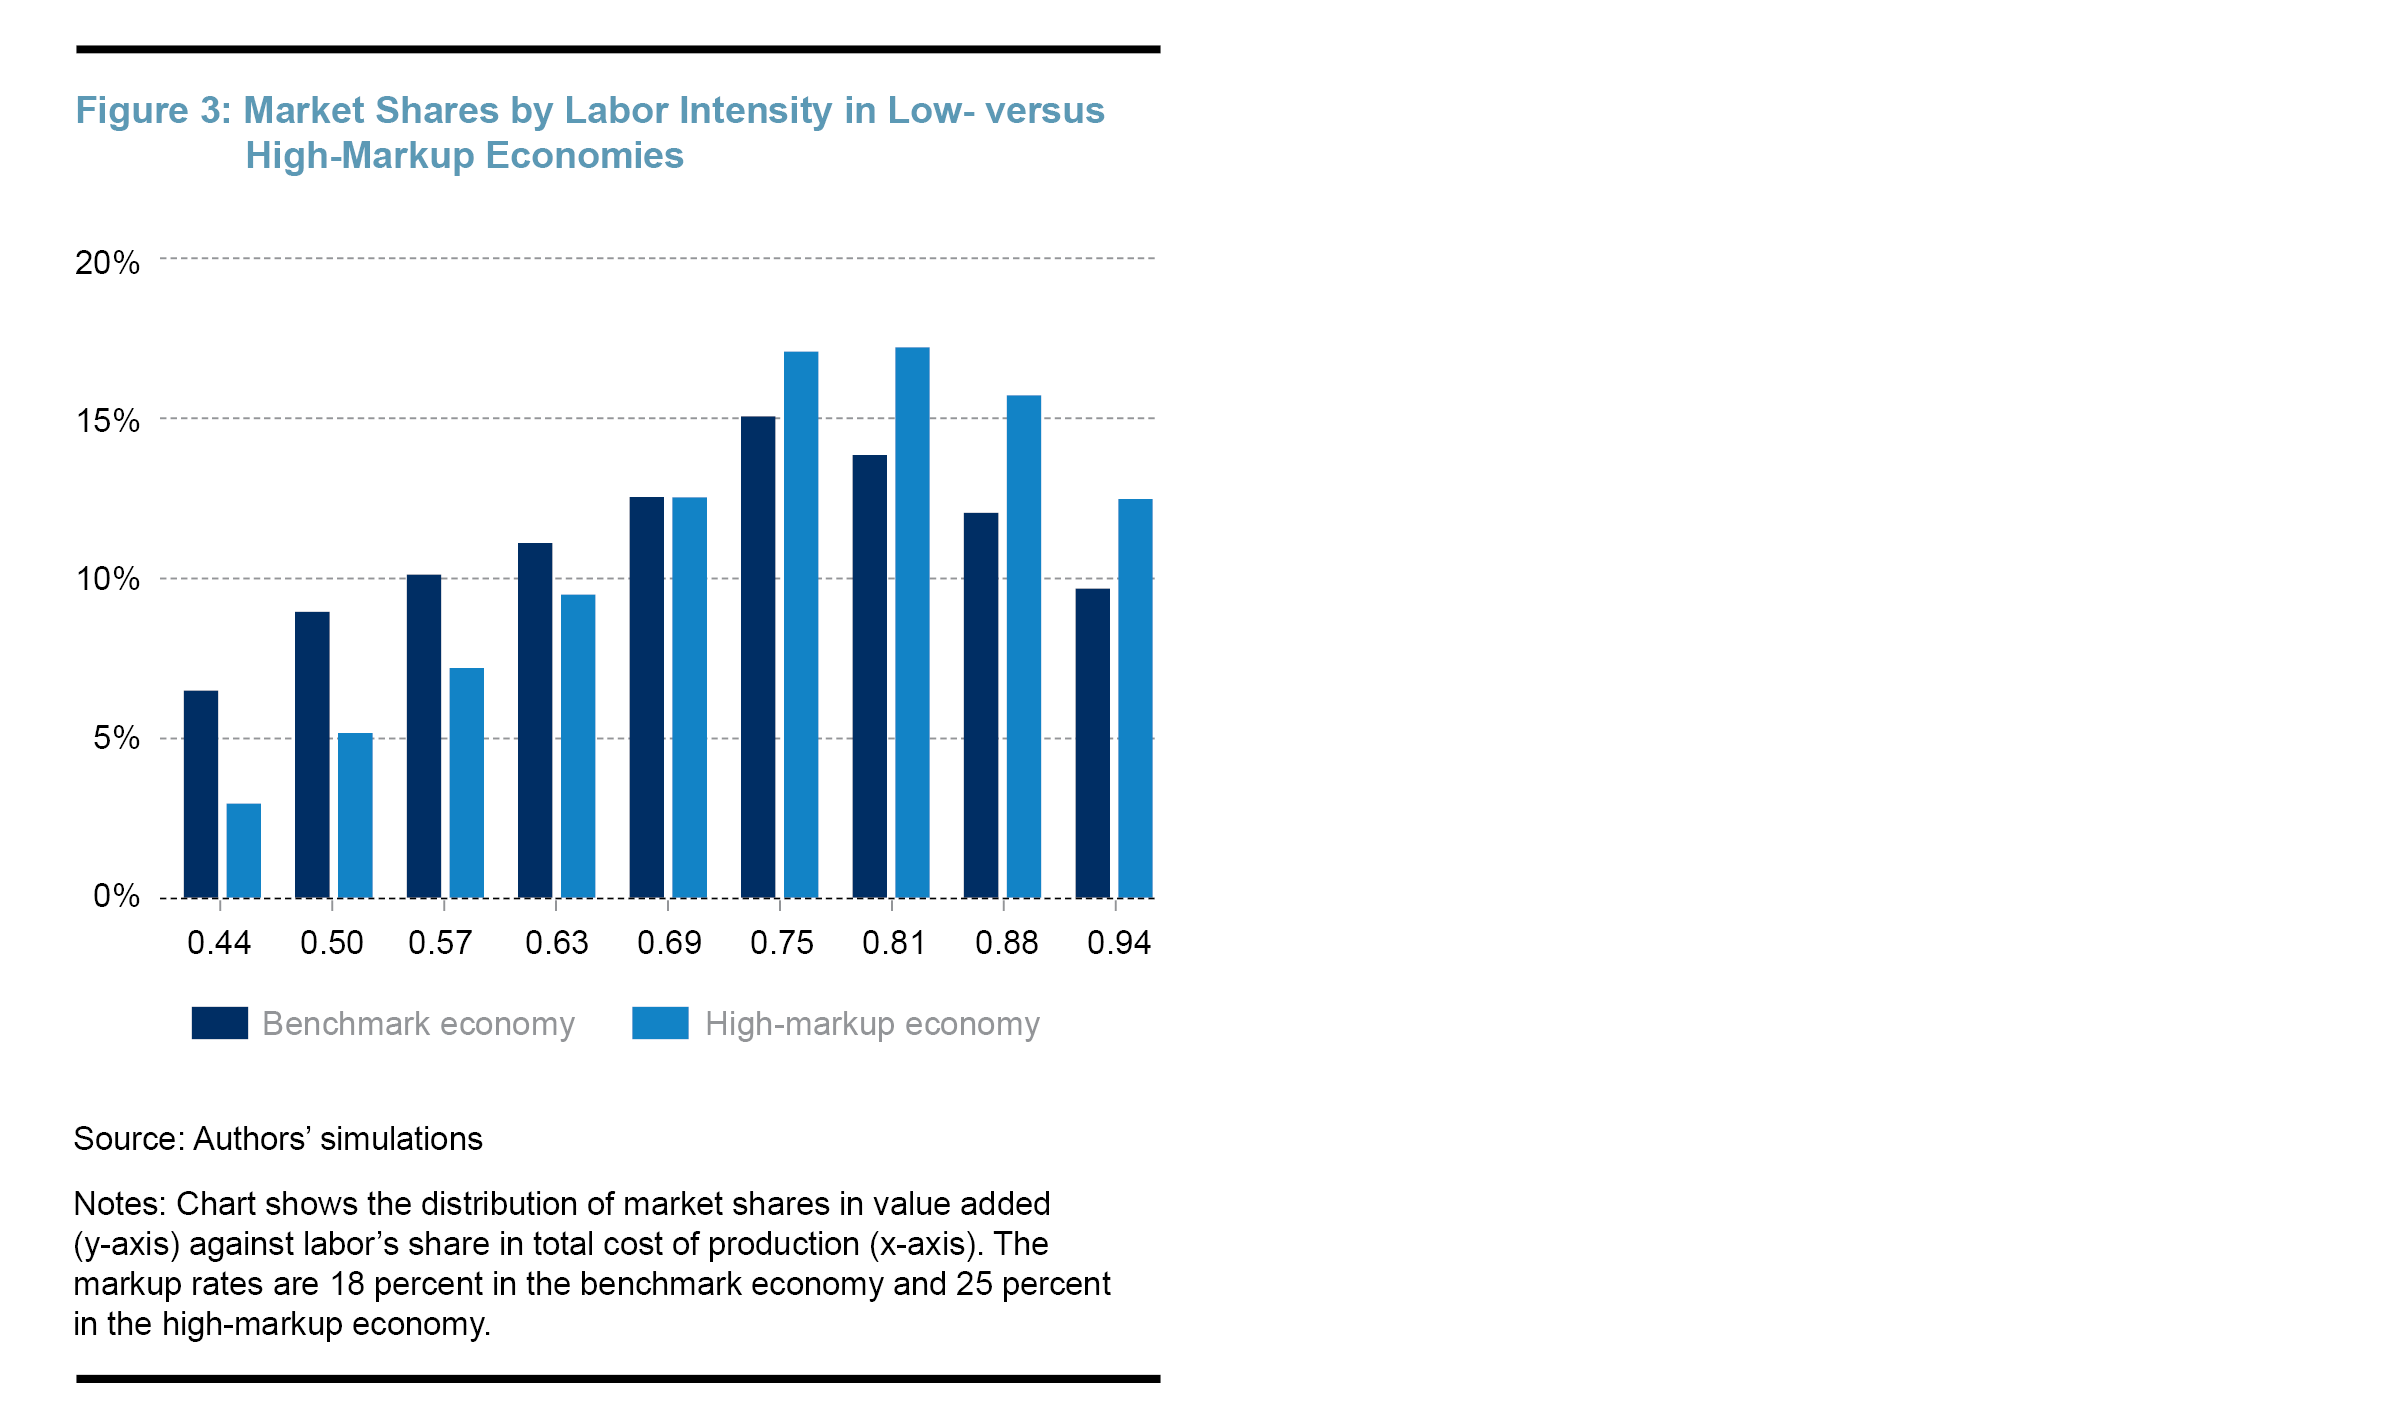
Figure 3 compares the distribution of market shares in the benchmark economy with that in the hypothetical economy with higher markups. Each bar shows the fraction of establishments with different labor intensities of production plotted along the horizontal axis.10 The distribution of market shares is even more skewed toward labor-intensive firms in the high-markup economy. This is due to increased cost of capital goods resulting from higher markups in the economy. Labor-intensive establishments take advantage of less expensive labor by expanding their market shares at the expense of capital-intensive establishments. Consequently, labor's share in total cost increases. The aggregate share of labor in the industry's total cost now stands at 75 percent, up by 4 percentage points.
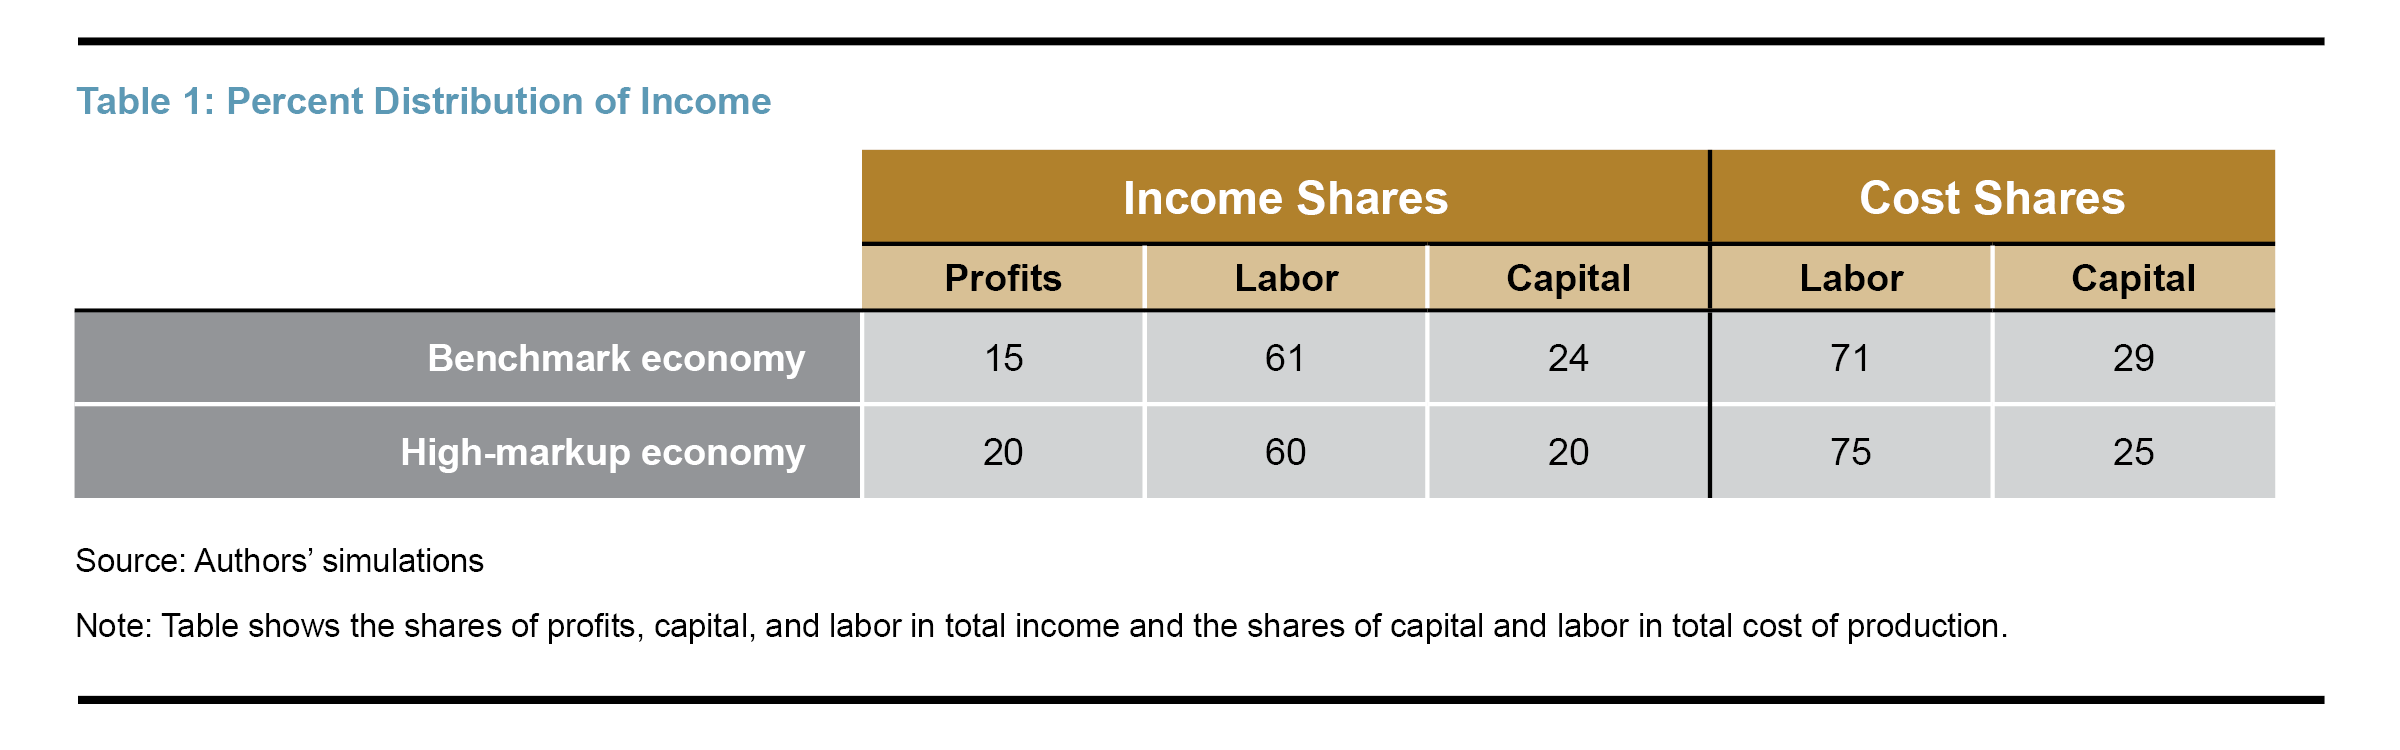
The reallocation of output toward labor-intensive units counteracts the downward pressure on the labor share from higher markups. Table 1 shows the final distribution of income in the two economies. The first column shows the profit shares that increase by 5 points by design. Without reallocation, that is, holding market shares of different establishment types fixed, labor's share in total cost would be constant. But, because the ratio of income to total cost is larger in the hypothetical economy, as a result of larger profits, the labor share in income would have fallen to 57 percent from 61 percent (80 percent of 61 percent divided by 85 percent). But reallocation offsets most of that in our simulations, leaving the labor share of income little changed. Most of the rise in profits then comes out of capital's share, which declines by 4 percentage points. If the output shares of establishments with different factor intensities remained stable, then capital’s share would have only fallen by 1 percentage point.
Conclusion
Our findings highlight the potential importance of output reallocation when studying the link between price markups and the labor share of income. A uniform increase in markups, one that covers the production of capital goods, can render capital more costly relative to labor and raise the market shares of labor-intensive establishments. In our simulations for the US manufacturing sector, this reallocation effect offsets the drop in labor's income share at the establishment level. While the precise predictions may change depending on parameter choices, the fact that the reallocation effect mitigates the downward pressure on the labor share from higher price markups presents a challenge for theories of the decline in the labor share that are based on rising markups in the United States.
A second challenge comes from the direction of output reallocation. Whereas the model simulations predict rising market shares of labor-intensive firms in response to higher markups, market shares in the manufacturing sector have, in fact, shifted toward capital-intensive establishments, and quite dramatically so. This finding suggests that factors other than markups have been at play. In Kaymak and Schott (2023), we find that lower corporate income taxes, which effectively lower the cost of capital, can explain an important part of the observed shift toward capital-intensive establishments in the US manufacturing industry and the associated decline in the labor share simultaneously.11 More generally, we find that both the trends in output reallocation and market concentration in US manufacturing are consistent with theories that highlight the declining cost of capital from the perspective of our model. In that respect, innovations in capital equipment and the resulting progress in production technologies from automation are other developments that favor the use of machinery over workers in the manufacturing sector (Acemoglu and Restrepo, 2019; Karabarbounis and Neimann, 2014).
References
- Acemoglu, Daron, and Pascual Restrepo. 2019. “Automation and New Tasks: How Technology Displaces and Reinstates Labor.” Journal of Economic Perspectives 33 (2): 3–30. https://doi.org/10.1257/jep.33.2.3.
- De Loecker, Jan, Jan Eeckhout, and Gabriel Unger. 2020. “The Rise of Market Power and the Macroeconomic Implications.” The Quarterly Journal of Economics 135 (2): 561–644. https://doi.org/10.1093/qje/qjz041.
- Farhi, Emmanuel, and François Gourio. 2018. “Accounting for Macro-Finance Trends: Market Power, Intangibles, and Risk Premia.” Brookings Papers on Economic Activity Fall 2018 (September): 147. https://www.brookings.edu/articles/accounting-for-macro-finance-trends-market-power-intangibles-and-risk-premia/.
- Fleming, Sam, and Brooke Fox. 2018. “Swelling Clout of US Corporate Giants Is Depressing Pay, Analysts Say.” Financial Times, August 15, 2018. https://www.ft.com/content/7f88226e-9f0b-11e8-85da-eeb7a9ce36e4.
- Galston, William A. 2018. “The Perils of Corporate Concentration.” Wall Street Journal, June 19, 2018, sec. Opinion. https://www.wsj.com/articles/the-perils-of-corporate-concentration-1529449577.
- Hopenhayn, Hugo, and Richard Rogerson. 1993. “Job Turnover and Policy Evaluation: A General Equilibrium Analysis.” Journal of Political Economy 101 (5): 915–938. https://doi.org/10.1086/261909.
- Houthakker, H. S. 1955. “The Pareto Distribution and the Cobb-Douglas Production Function in Activity Analysis.” The Review of Economic Studies 23 (1): 27–31. https://doi.org/10.2307/2296148.
- Karabarbounis, Loukas, and Brent Neiman. 2014. “The Global Decline of the Labor Share.” The Quarterly Journal of Economics 129 (1): 61–103. https://doi.org/10.1093/qje/qjt032.
- Kaymak, Barış, and Immo Schott. 2023. “Corporate Tax Cuts and the Decline of the Manufacturing Labor Share.” Econometrica 91 (6): 2371–2408. https://doi.org/10.3982/ECTA17702.
- Kehrig, Matthias, and Nicolas Vincent. 2021. “The Micro-Level Anatomy of the Labor Share Decline.” The Quarterly Journal of Economics 136 (2): 1031–1087. https://doi.org/10.1093/qje/qjab002.
- Oberfield, Ezra, and Devesh Raval. 2021. “Micro Data and Macro Technology.” Econometrica 89 (2): 703–732. https://doi.org/10.3982/ECTA12807.
- Scaggs, Alexandra, and Colby Smith. 2018. “Rise in Corporate Market Power Offers Clues to Feeble Wage Growth.” Financial Times, August 10, 2018, sec. Opinion. https://www.ft.com/content/f100a62c-9c05-11e8-9702-5946bae86e6d.
- Yeh, Chen. 2023. “How Costly Is Rising Market Power for the U.S. Economy?” Economic Brief 23-24. Federal Reserve Bank of Richmond. https://www.richmondfed.org/publications/research/economic_brief/2023/eb_23-24.
Endnotes
- Sales may decline if firms charge too high a markup, but the ratio of revenues to cost per unit sold still increases. Return to 1
- Few high-level executives may see a bump in compensation that is tied to profits, but this has a negligible effect on the overall labor compensation in the economy. Return to 2
- See, for instance, “Rise in Corporate Market Power Offers Clues to Feeble Wage Growth,” Alexandra Scaggs and Colby Smith, Financial Times, August 10, 2018; “Swelling Clout of US Corporate Giants Is Depressing Pay, Analysts Say,” Sam Fleming and Brooke Fox, Financial Times, August 15, 2018; and “The Perils of Corporate Concentration,” William A. Galston, Wall Street Journal, June 19, 2018. Return to 3
- The upward trend in markups is still a subject of academic dispute. See Yeh (2023) for a recent summary. Return to 4
- While we associate markups with product market competition in this Economic Commentary, lack of competition can also manifest in labor markets if hiring is dominated by a small number of large employers that suppress pay relative to productivity, that is, markdowns. That, too, can lower labor’s share of income. Return to 5
- Kaymak and Schott (2023) developed this model to assess the role of corporate income tax rates in labor’s income share. In their analysis, lower corporate income tax rates, effectively a tax on capital, have contributed to the decline in the labor share in the United States and in many OECD (Organisation for Economic Co-operation and Development) countries by allowing capital-intensive firms to capture a larger share of the market. Return to 6
- The industry dynamics are modeled after Hopenhayn and Rogerson (1993) in a general equilibrium context, that is, allowing factor and product prices to change in response to economic conditions. Return to 7
- We refer the reader to Kaymak and Schott (2023) for further details. Return to 8
- In the same spirit, Houthakker (1955) and more recently Oberfield and Raval (2021) analyze similar models to distinguish the industry-level elasticity of factor substitution from that at the establishment level. Return to 9
- Note that the establishment distribution (shown with the triangular line in Figure 1) is stable across the two economies. Return to 10
- Because outlays on labor are fully deducted from net corporate income whereas capital expenditures are not (apart from allowances for debt service and depreciation), corporate income taxes are thought to favor labor over capital in production. Return to 11
Suggested Citation
Kaymak, Barış, and Immo Schott. 2024. “Do Higher Markups Lower Labor’s Share of Income?” Federal Reserve Bank of Cleveland, Economic Commentary 2024-02. https://doi.org/10.26509/frbc-ec-202402
This work by Federal Reserve Bank of Cleveland is licensed under Creative Commons Attribution-NonCommercial 4.0 International

