

- Share
Implications of Bank Equity Price Declines for Inflation
This Economic Commentary examines the relationship between bank equity price index returns and inflation in advanced economies. While large declines in bank equity price indices are generally followed by declines in the ratio of bank credit to GDP, a measure of credit supply, and economic activity as measured by GDP, they have essentially no effect on inflation. These findings suggest that the collapse of several regional banks in early 2023 would not, on its own, put downward pressure on inflation.

The views authors express in Economic Commentary are theirs and not necessarily those of the Federal Reserve Bank of Cleveland or the Board of Governors of the Federal Reserve System. The series editor is Tasia Hane. This paper and its data are subject to revision; please visit clevelandfed.org for updates.
The aftermath of the collapse of several regional banks, including Silicon Valley Bank and Signature Bank, in early 2023 raised important questions regarding the effects that banking distress would have on economic activity and inflation. Understanding the latter is of particular importance in the current economic environment when inflation is running well above the Federal Open Market Committee’s long-term target of 2 percent. The effects of banking distress on bank credit and output have been well-studied: empirical research finds that distress in the banking sector typically shrinks credit supply and depresses output growth. The relationship between banking distress and inflation has not been examined to the same extent. Phillips curve logic would suggest that since a banking crisis puts downward pressure on output, inflation should come down, as well, but this line of thinking may not be consistent with the evidence.
The goal of this Economic Commentary is to shed more light on the effects of widespread declines in the stock prices of banks—as measured by bank equity price indices, which are constructed by Baron et al. (2021) and capture distress in the banking sector—on inflation, as measured by the consumer price index (CPI).1 Specifically, I extend the analysis of Baron et al. (2021) to explore the effects that changes in the bank equity price index from one year to the next have on annual CPI inflation for advanced economies, including those of the United States, Canada, Australia, Japan, and several Western European countries, over a multidecade timespan.2
I highlight three main results. First, through the lens of a simple event study, I find that the behavior of CPI inflation in the years before and after a decline of 30 percent or more in the bank equity price index (an event defined as a “bank equity crash” in Baron et al. (2021)) is very similar to its behavior around years when there is no crash in bank stock values. Second, in an exercise using data from advanced economies during the period 1972–2016, I find that large declines in bank equity price index returns have tended to lead to decreases in the credit-to-GDP ratio and in output growth, relative to those experienced during normal times, defined as periods when bank equity price index returns rise by a modest amount. This result is similar to the findings in Baron et al. (2021). Third, when I conduct a similar exercise for CPI inflation, I find that large declines in bank equity price index returns generally have not had any significant effect on CPI inflation in advanced economies in recent decades. Hence, this Economic Commentary finds that large declines in bank stock values appear to have little to no effect on inflation, even if they tend to weigh on credit supply and output growth.
Data
The data used in this Economic Commentary come from the publicly available dataset constructed by Baron et al. (2021).3 The dataset comprises information on annual bank and nonfinancial equity indices and on macroeconomic variables for a large number of countries from 1870 to 2016.4 I focus on advanced economies, that is, the United States, Canada, Australia, Japan, and a number of Western European countries.5 To draw inferences from this analysis applicable to the economic events that occurred in early 2023, when multiple banks failed and overall bank stock values experienced a sharp decline, my primary emphasis will be on real bank equity index returns in the following ranges: i) between -15 percent and 0 percent; ii) between -30 percent and -15 percent; and iii) below -30 percent.
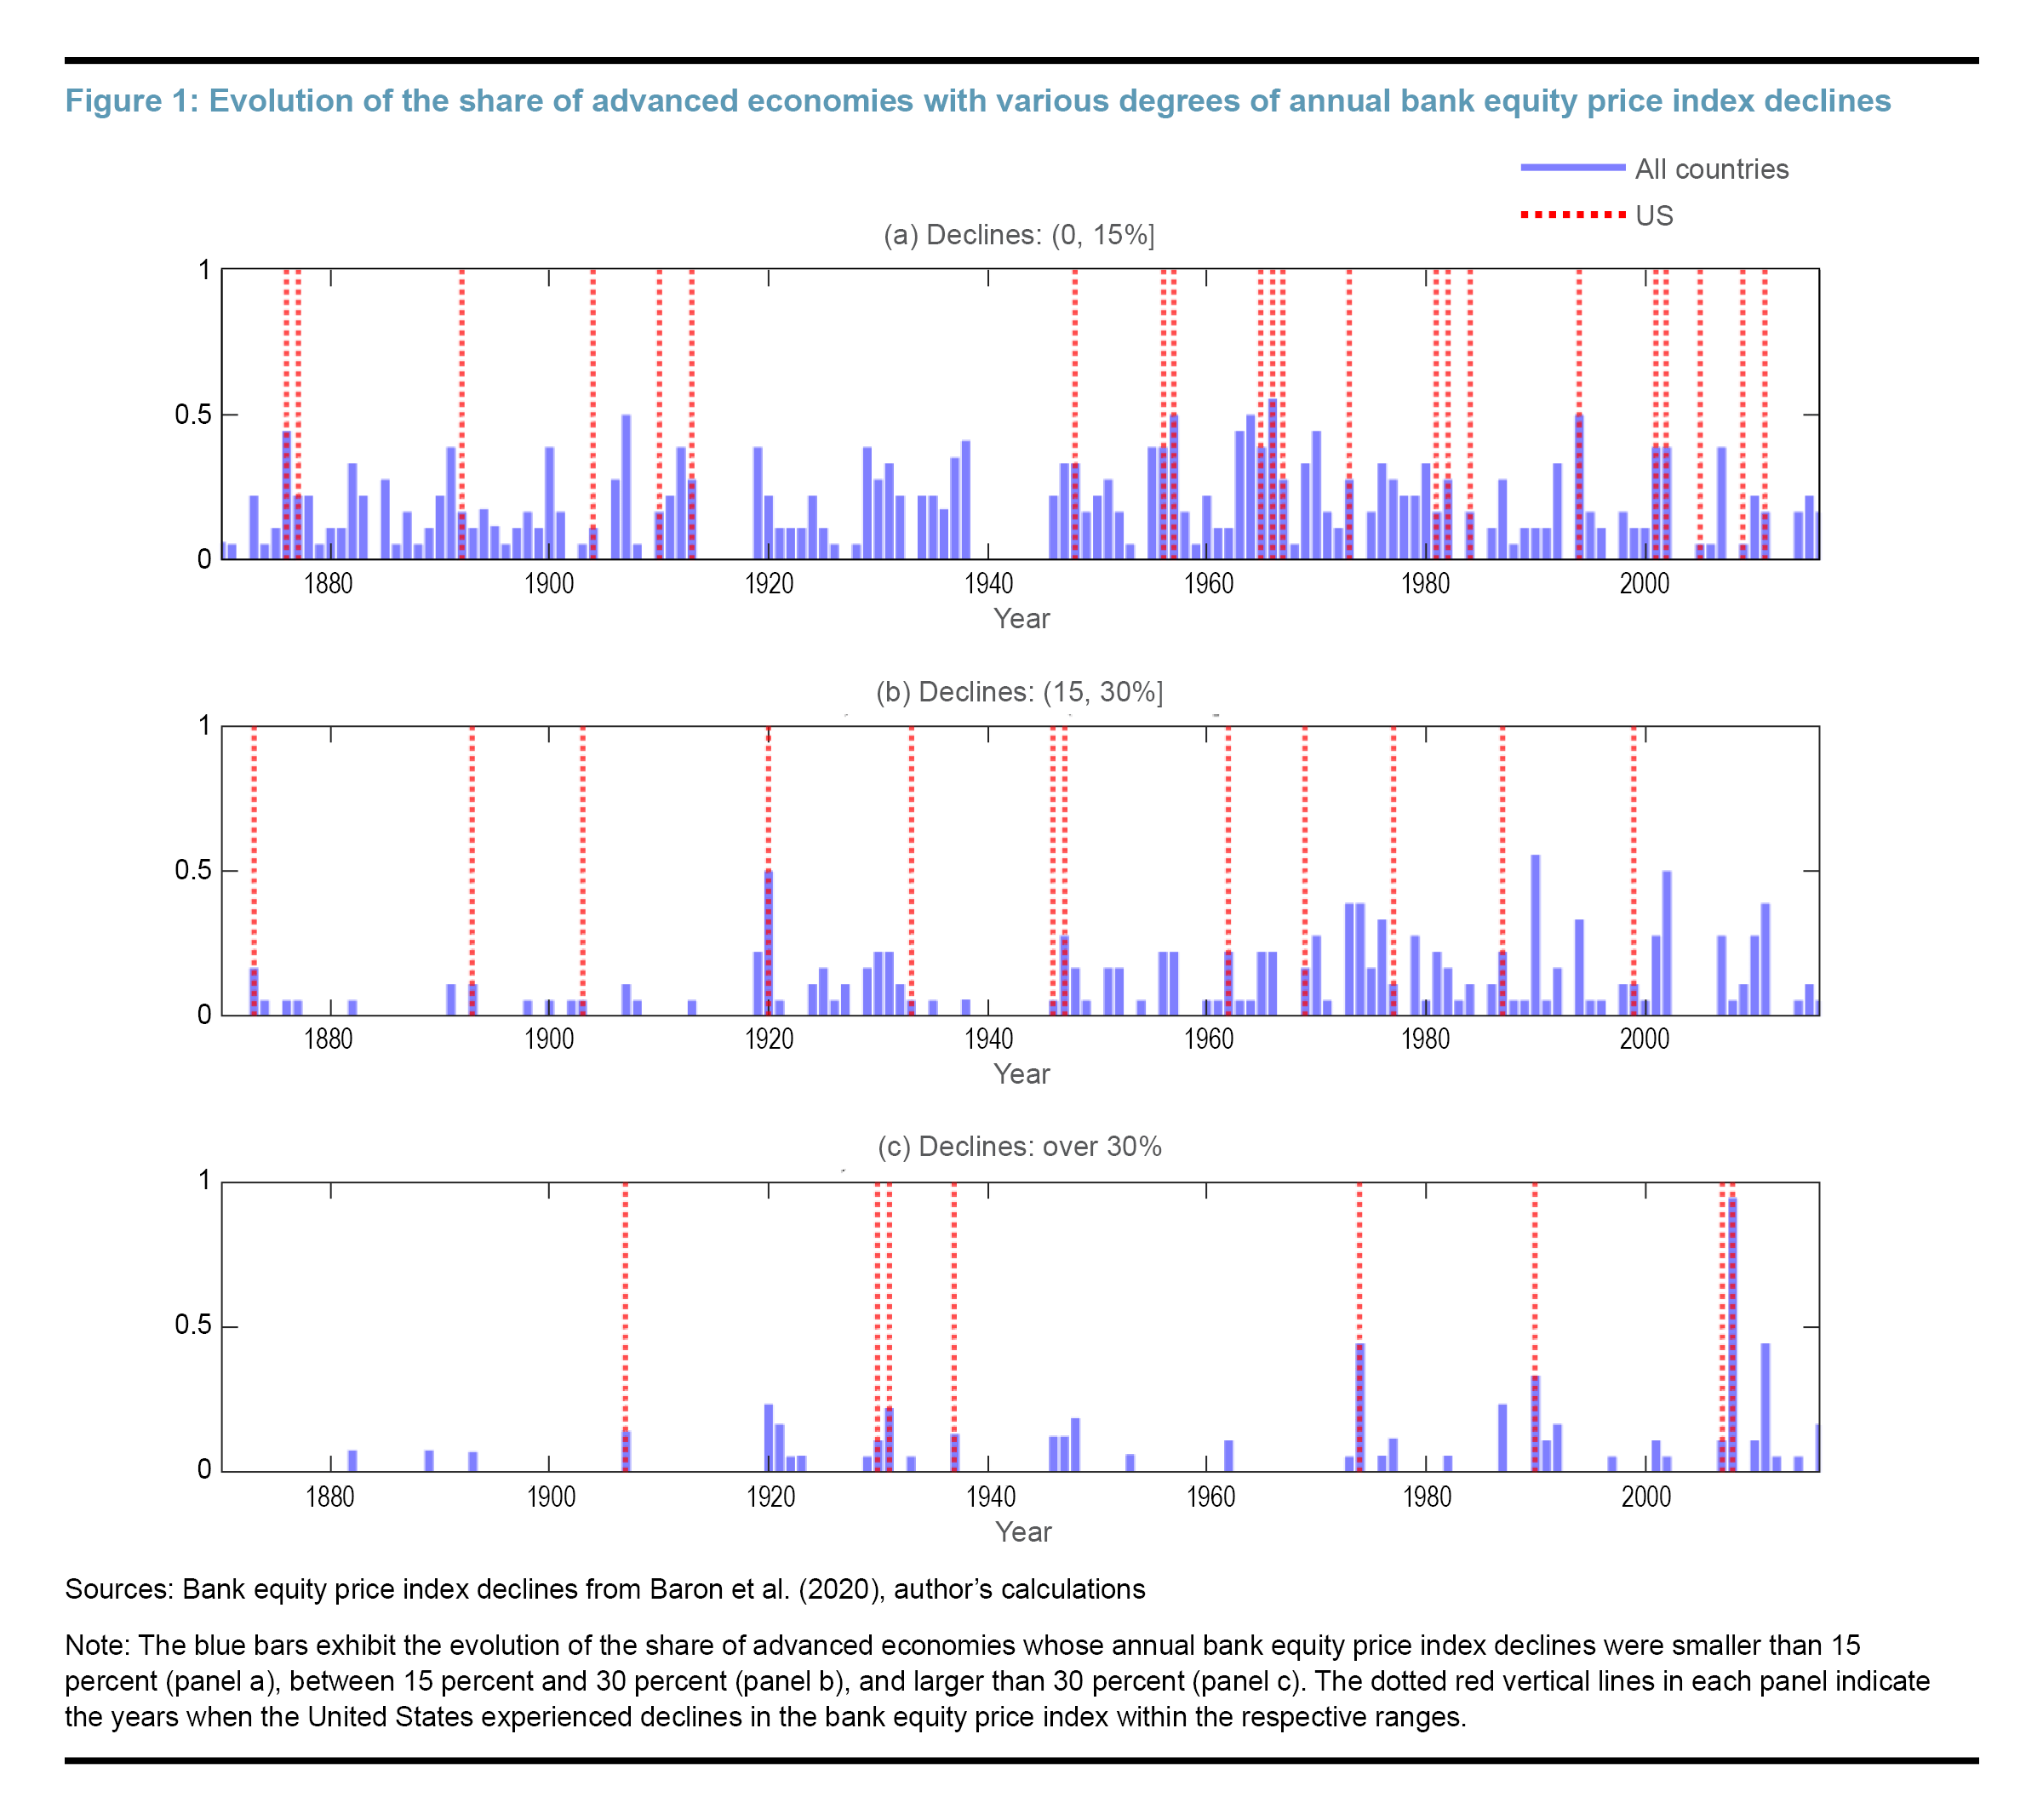
Figure 1 plots the annual share of advanced economies that have suffered from bank stock value declines of various ranges (blue bars) along with an indicator for the years during which the United States experienced similarly sized declines (red dashed lines). This graphic highlights three interesting features. First, the most negative bank equity index returns for both the advanced economies cohort and for the United States are less common, as illustrated by fewer blue bars in the bottom panel than in the top panel. Second, as shown in panels b and c, bank equity index returns between -15 percent and -30 percent and bank equity crashes have become more frequent after the 1970s. Third, bank equity crashes seem to have become more interconnected across countries over time. During the Great Recession, for example, almost all of the advanced economies experienced bank equity crashes.
Results
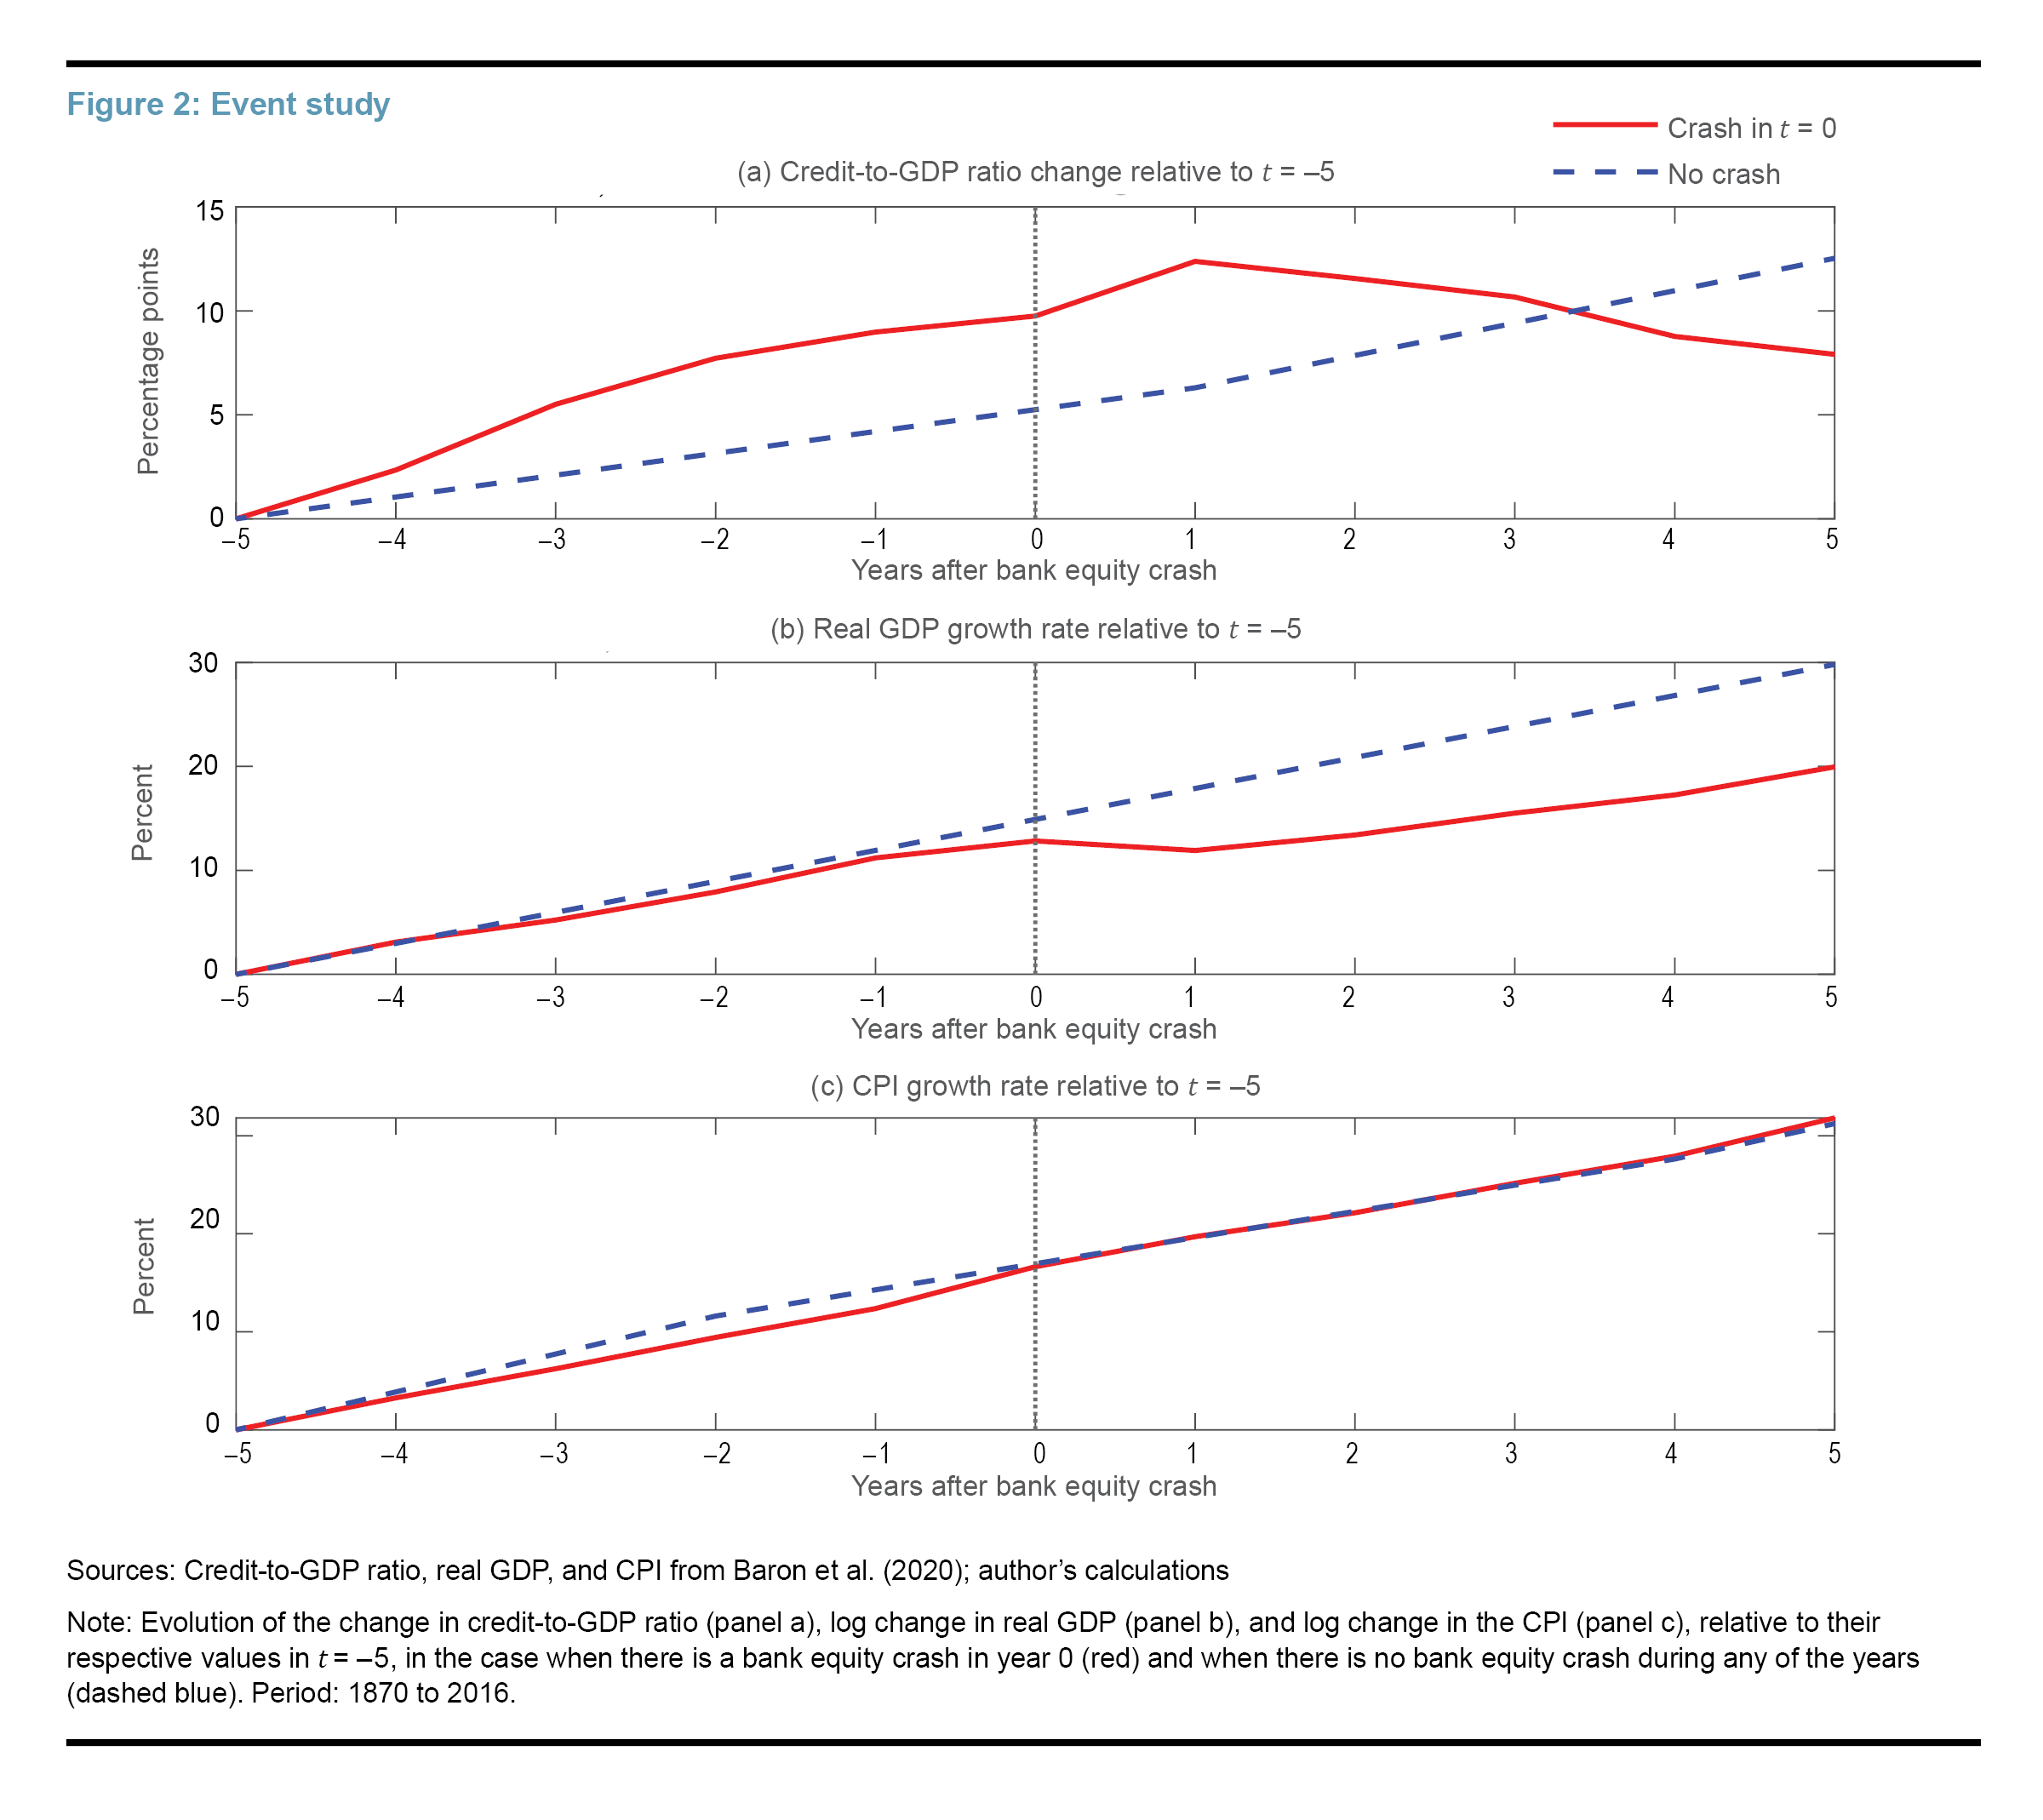
I start the analysis with an event study over the full sample, from 1870 to 2016, that compares the average dynamics of the bank credit to GDP ratio, real GDP, and inflation as measured by the CPI for advanced economies around years when bank equity crashes occurred; I compare those dynamics to the average behavior during periods in which there was not a crash. Figure 2 visualizes the results. The lines in red reveal the cumulative growth of the variable of interest beginning five years before the occurrence of a bank equity crash and extending five years after. The curves in dashed blue show the evolution of the growth of that same variable on average over the span of 10 years during which no bank equity crash occurred. Panel a reveals that the credit-to-GDP ratio in the years leading up to the crash is systematically higher than what it would typically be during years without a crash. It then declines significantly below the level during years without a crash, typically for some time after the crash occurs. On the other hand, panel b shows that in the years leading to a crash, real GDP growth evolves quite similarly to during normal times, but once the crash occurs, real GDP is suppressed even five years after the crash. Finally, panel c shows that there are virtually no differences in the path of CPI inflation in the years leading up to and after a bank equity crash when compared with its path during years with no crashes.
Next, to quantify the relationship between a bank equity crash occurring in year t and cumulative CPI inflation h years later, I rely on a similar methodology to that of Baron et al. (2021) and estimate the following regression for various values of h:6
(1)
where denotes CPI inflation in country i between year t and year t+h; is a country fixed effect that absorbs variation in inflation as a result of country-specific characteristics, events, and so on; is a year fixed effect that absorbs common events across the advanced economies; is an indicator variable taking a value of 1 if the bank equity index return is within bin Bj and 0 otherwise, where the possible ranges are less than -30 percent, between -15 and -30 percent, between -15 and 0 percent, between 15 percent and 30 percent, and higher than 30 percent; Xit is a vector embedding various controls; and is an error term.7 The parameters of interest are the coefficients that quantify the relationship between an annual bank equity index return within range Bj and CPI inflation between year t and year t+h, relative to “normal times,” defined as periods when annual bank equity returns are between 0 and 15 percent.8 I run this same regression also using either the net change in the credit-to-GDP ratio from t to t+h or the cumulative change in real GDP as the left-side variables.
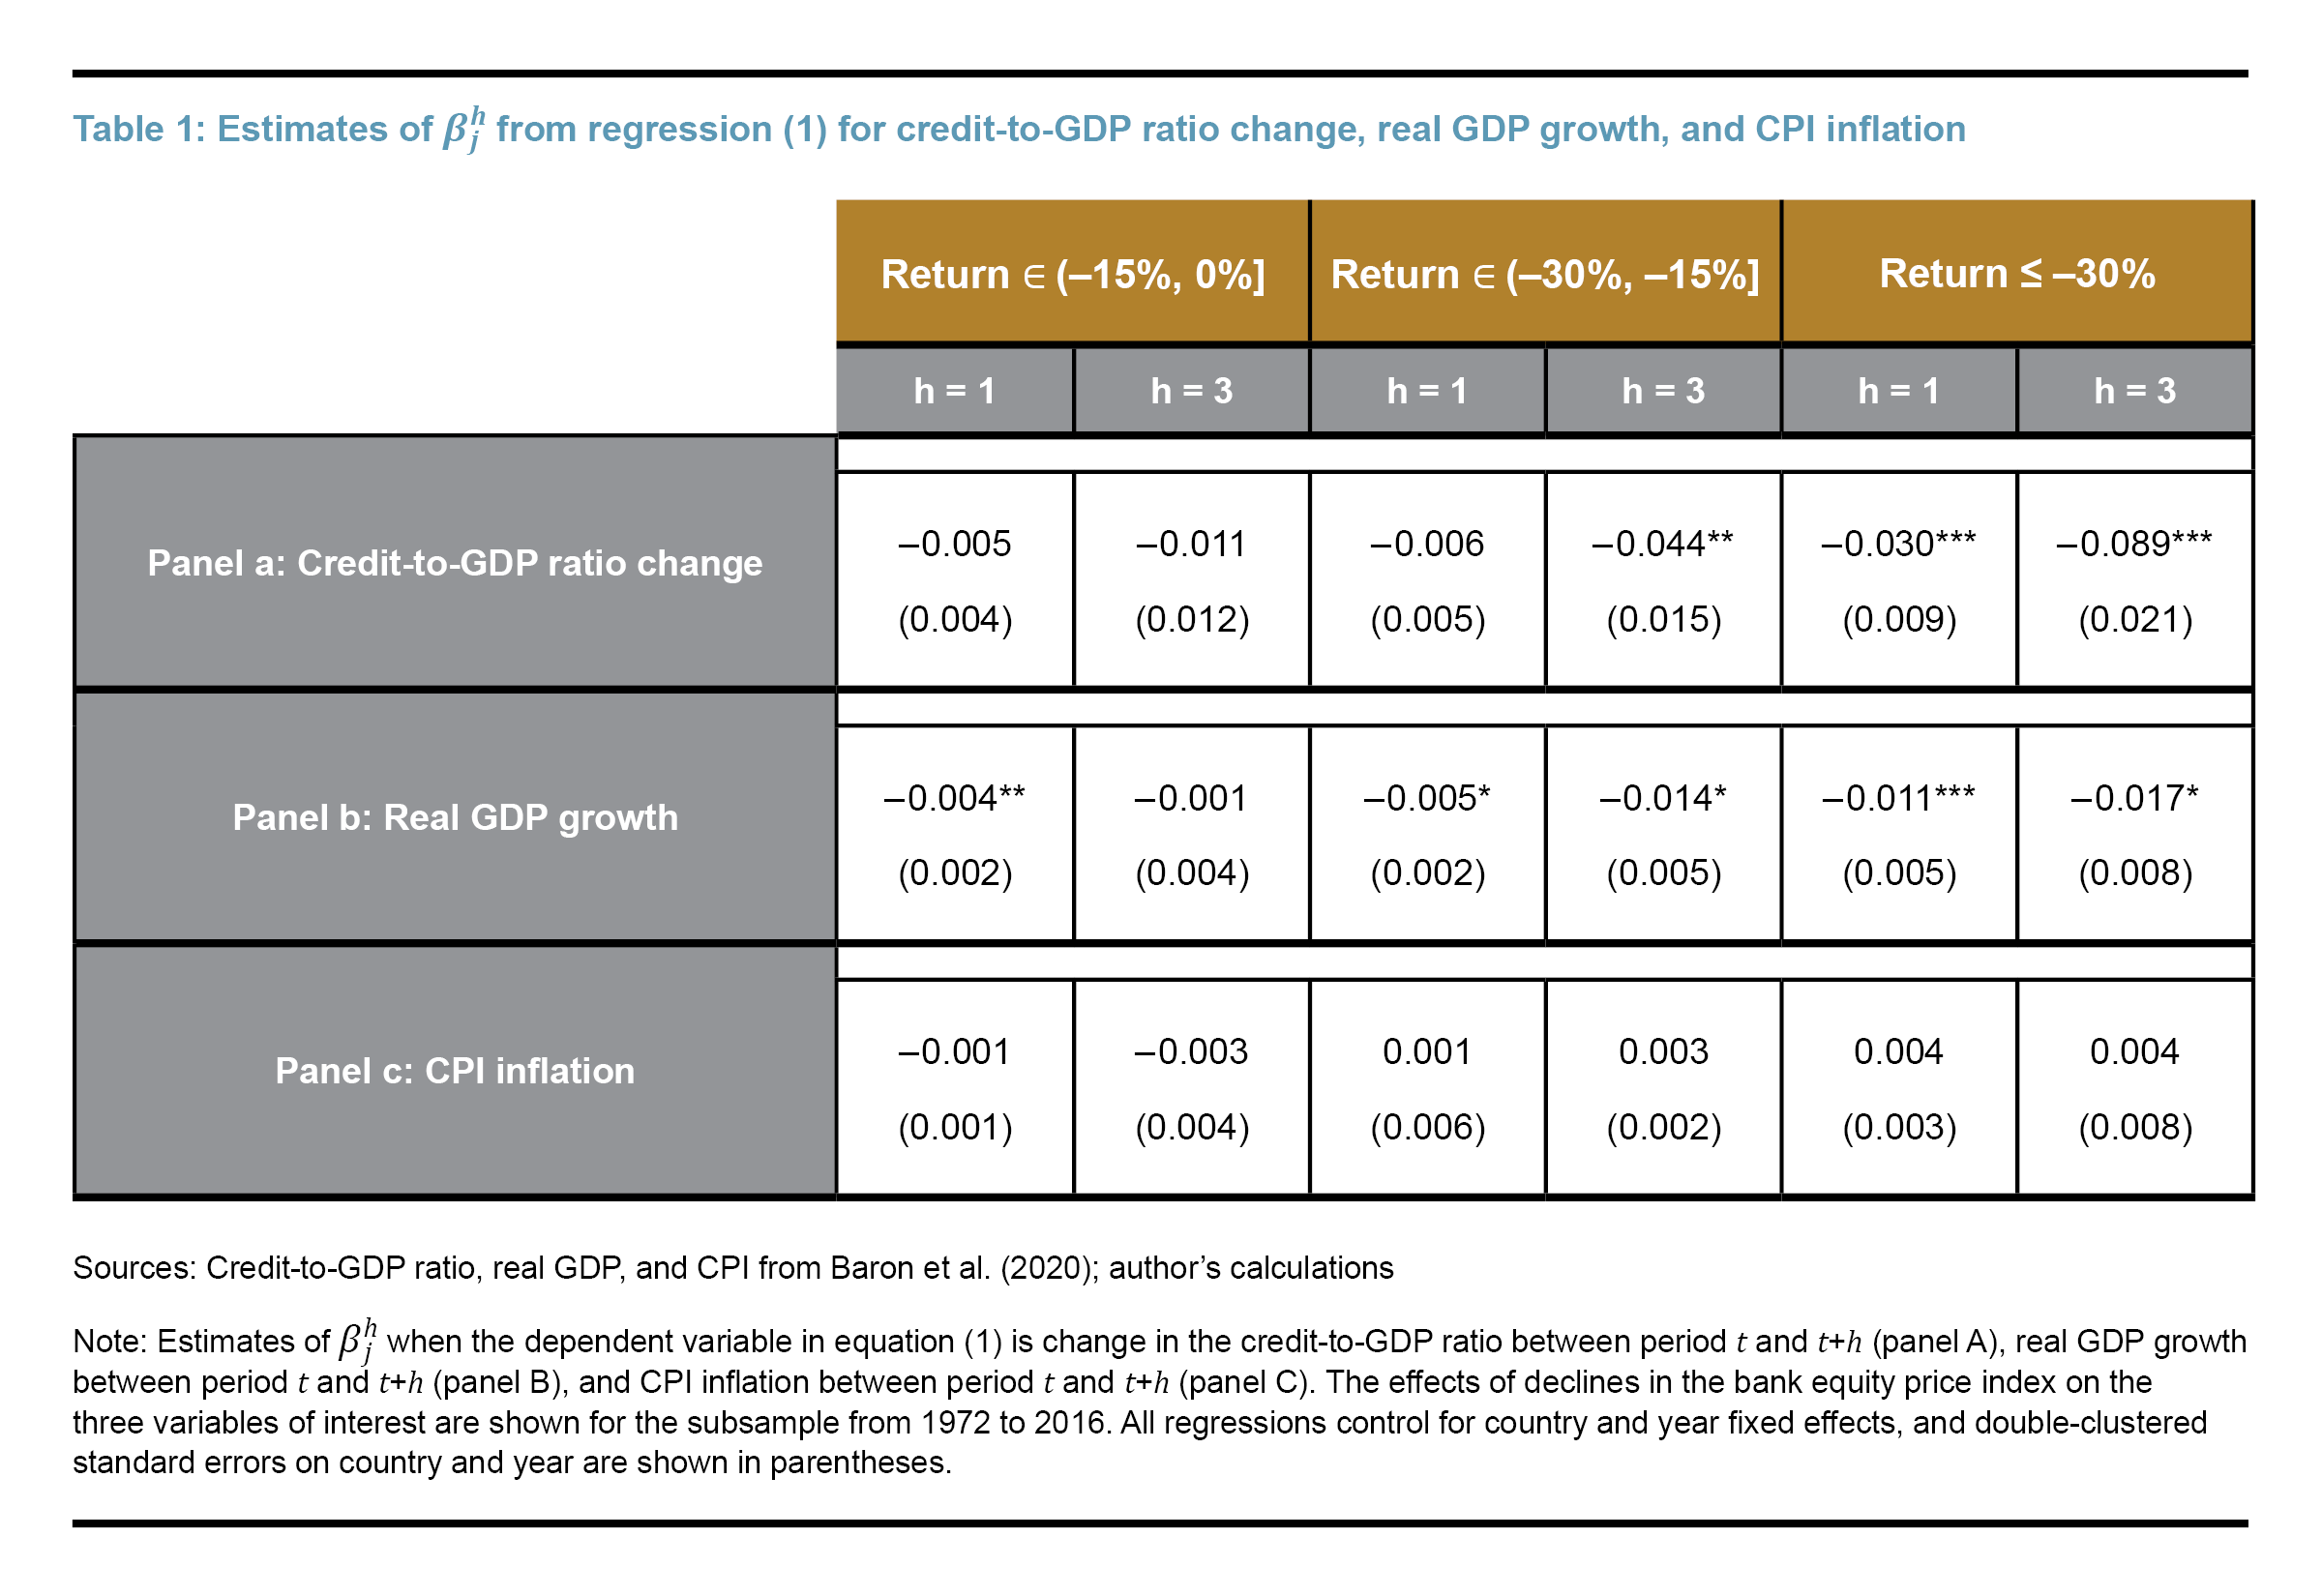
Table 1 summarizes the estimates of when the dependent variable is the cumulative change in the credit-to-GDP ratio (panel a), cumulative real GDP growth (panel b), and cumulative CPI inflation (panel c) for the sample period from 1972 to 2016. I focus primarily on this subperiod of the dataset to mitigate concerns around the effects of substantial changes in monetary policy frameworks on the behavior of inflation (and other macro variables).9
The analysis reveals that, relative to normal times, bank equity index declines that are smaller than 15 percent have historically been followed by a very slight decline in CPI inflation one year and three years after, whereas larger bank equity index declines that were greater than 15 percent have historically been followed by a very slight increase in CPI inflation one year and three years after. However, it is crucial to note that none of these estimates is statistically significant.10 On the other hand, similar to results in Baron et al. (2021), I find that, compared to normal times, bank equity index declines of more than 15 percent have been historically associated with declines in real GDP of 0.5 percent to 1.1 percent after one year and declines of 1.4 percent to 1.7 percent after three years. Similarly, relative to normal times, bank equity index declines between 15 percent and 30 percent have historically been associated with reductions in the credit-to-GDP ratio of 4.4 percentage points, while bank equity crashes have been associated with reductions of as much as 9 percentage points over a three-year horizon. Unlike the results for CPI inflation, the estimated relationships between bank equity index returns and credit supply or output growth are larger and statistically significant.
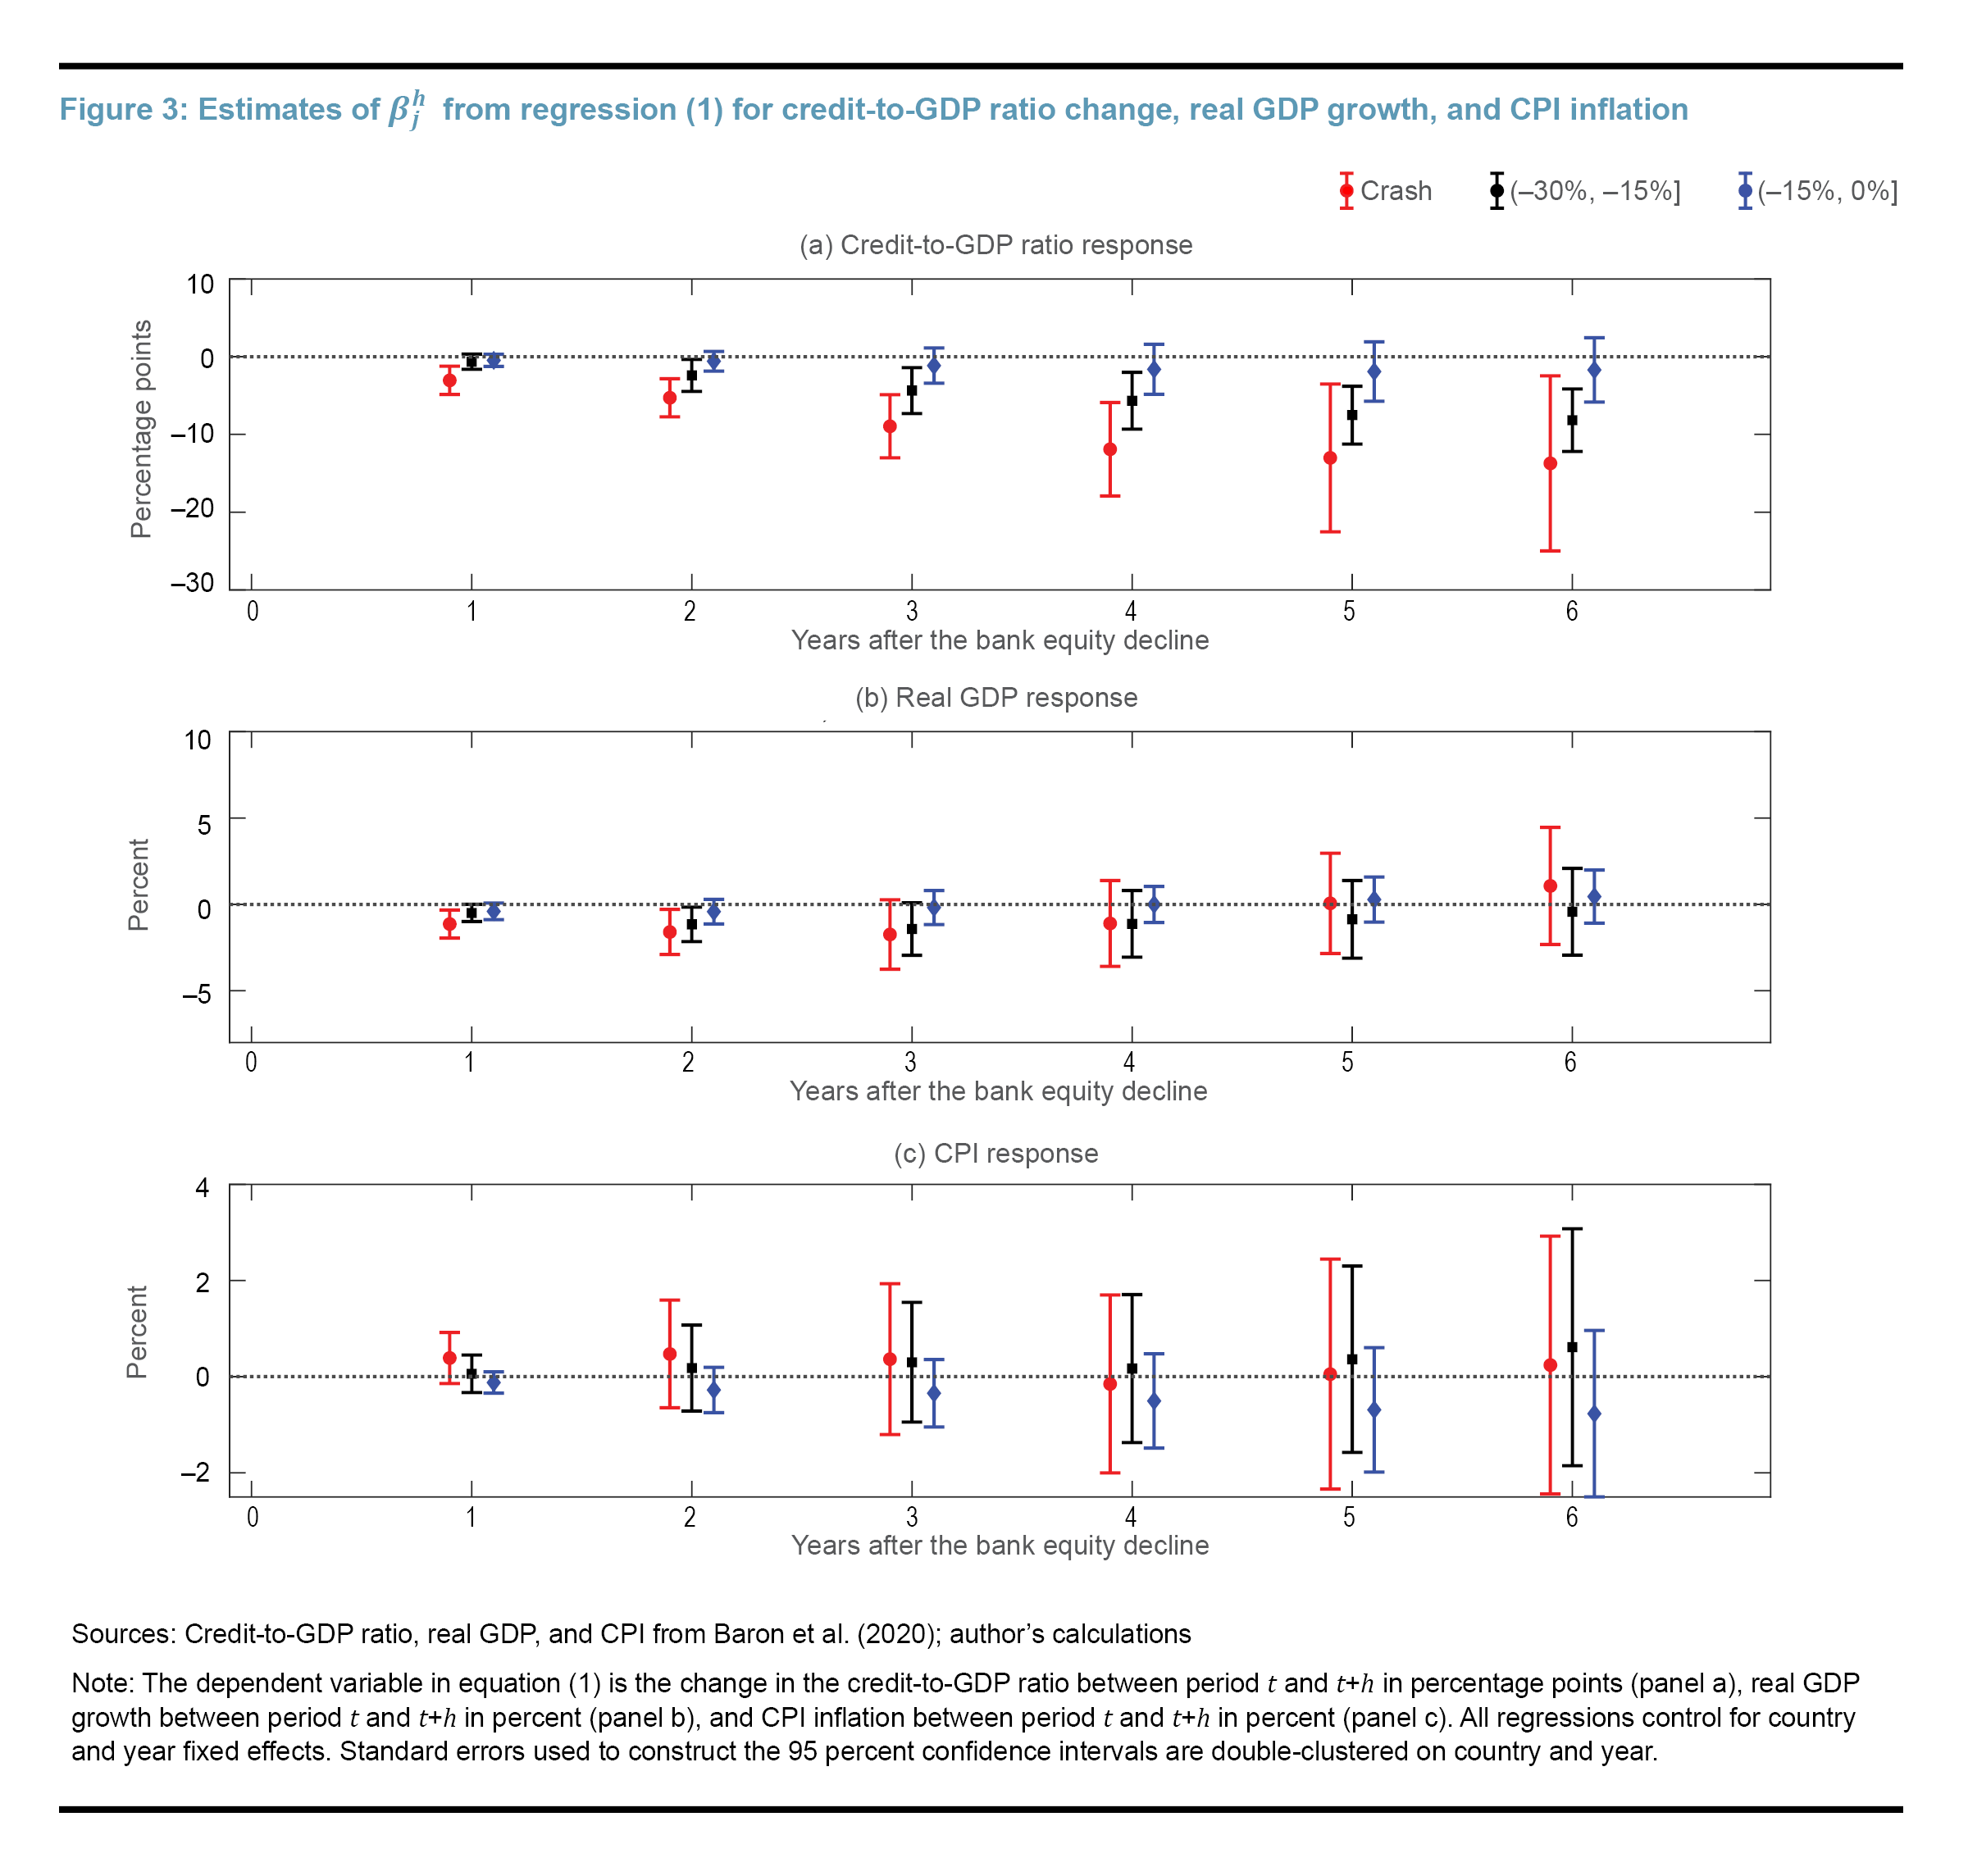
To get a full picture of the effects of bank equity index declines on the three variables over time, Figure 3 plots the point estimates of together with the 95 percent confidence intervals over a six-year horizon. Panel c shows that the effect of banking distress on CPI inflation is never statistically significant and that while the point estimate is negative for bank equity index declines that are smaller than 15 percent (in blue), the point estimate turns positive when the bank equity index falls by more than 15 percent (in red and black). The estimates for CPI inflation are insignificant despite the negative effects that banking distress can have on credit-to-GDP ratio changes and real GDP growth, as shown in panels a and b, respectively. For instance, panel b shows that negative bank equity index returns are associated with significant declines in real output during the first three years and that this effect is more pronounced the more negative the equity return. After the first three years, the effect on real GDP diminishes and becomes statistically insignificant. By contrast, the effects of banking stress on the credit-to-GDP ratio can be longer lasting. Specifically, over the span of six years, credit supply can shrink by about 8 percentage points if bank equity index returns are in the range between -15 percent and -30 percent (black square) and can shrink by more than 10 percentage points in the case of a bank equity crash (red circle). Finally, the real annual S&P bank equity index return in the United States has varied from -20 percent in May 2023 to a low of -25 percent in March 2023.11 Therefore, the findings that are relevant for the implications of the bank failures that occurred in early 2023 for the United States economy are the ones associated with bank equity returns belonging to the range between -15 percent and -30 percent.
Is there an economic mechanism that can explain the lack of significant impact of banking distress on inflation? Several papers in the literature have documented that incentives guiding firms’ pricing decisions might change when there is stress in the banking sector. For instance, Gilchrist et al. (2017) show that, during the Great Recession in the United States, liquidity-constrained firms were more likely to raise—instead of lower—prices as part of an effort to preserve internal liquidity, whereas firms that did not face liquidity constraints lowered prices. In an earlier paper, Chevalier and Scharfstein (1996) document similar actions by firms in the United States during the recession in oil-producing states in 1986 and during the macroeconomic recession in 1990–1991 and its aftermath. This pricing behavior by a share of firms facing liquidity constraints in the wake of banking stress can put upward pressure on prices, thus mitigating the downward pressures on inflation resulting from shrinking real GDP and bank credit supply.
Conclusion
Given the interest in the economic effects that distress in the banking sector has on the economy in the aftermath of the bank failures that occurred early in 2023, this Economic Commentary seeks to further illuminate the relationship between declines in bank equity price index returns and inflation. Focusing on advanced economies, I find that, historically, large declines in bank equity indices have not had a statistically significant impact on CPI inflation even though banking distress tends to significantly depress bank credit and real GDP. This result suggests that the failure of several regional banks in early 2023 has likely not put downward pressure on inflation. This finding could reflect that firms facing liquidity constraints from banking distress could choose to increase prices to preserve internal liquidity, whereas other firms could choose to decrease prices, thereby offsetting downward pressures on inflation from slower economic growth.
References
- Baron, Matthew, Emil Verner, and Wei Xiong. 2020. “Replication Data for: ‘Banking Crises without Panics.’” V1. Harvard Dataverse. https://doi.org/10.7910/DVN/ECC9GE.
- Baron, Matthew, Emil Verner, and Wei Xiong. 2021. “Banking Crises Without Panics.” The Quarterly Journal of Economics 136 (1): 51–113. https://doi.org/10.1093/qje/qjaa034.
- Chevalier, Judith A., and David S. Scharfstein. 1996. “Capital-Market Imperfections and Countercyclical Markups: Theory and Evidence.” American Economic Review 86 (4): 703–25. https://www.jstor.org/stable/2118301.
- Gilchrist, Simon, Raphael Schoenle, Jae Sim, and Egon Zakrajšek. 2017. “Inflation Dynamics during the Financial Crisis.” American Economic Review 107 (3): 785–823. https://doi.org/10.1257/aer.20150248.
- Jordà, Òscar. 2005. “Estimation and Inference of Impulse Responses by Local Projections.” American Economic Review 95 (1): 161–82. https://doi.org/10.1257/0002828053828518.
Endnotes
- The bank equity price index primarily covers large commercial banks. See Baron et al. (2021) for more details on the construction of the index. Return to 1
- The list of countries considered in this Economic Commentary is a subset of the countries considered in Baron et al. (2021). Return to 2
- The dataset can be found at https://dataverse.harvard.edu/dataset.xhtml?persistentId=doi:10.7910/DVN/ECC9GE. Return to 3
- I refer the reader to Baron et al. (2021) for a detailed description of the dataset. Return to 4
- The list of countries comprises Australia, Belgium, Canada, Denmark, Finland, France, Germany, Ireland, Italy, Japan, the Netherlands, Norway, Portugal, Spain, Sweden, Switzerland, the United Kingdom, and the United States. Return to 5
- The regression given in equation (1) is a Jordà (2005) local projection. Return to 6
- The controls embedded in Xit include current and three lags of real annual GDP growth, bank credit-to-GDP change, and inflation; lags of bank and nonfinancial equity return bins; along with an indicator variable taking the value of 1 if nonfinancial returns (such as stock indices) are within range Bj and 0 otherwise. The regression I run is exactly the same one as in Baron et al. (2021), but here I abstract from discussing the effects that nonfinancial returns have for the three variables of interest. Return to 7
- Identification in the regression comes from cross-country or cross-time variation in the size of bank equity price declines. The results of the current analysis apply to cases when bank equity return changes are not perfectly coordinated across advanced economies; otherwise, the time fixed effect would absorb the variation in CPI growth that is due to a common shock to bank returns. For instance, estimates of would not accurately capture the effects that a bank equity crash would have on inflation, output growth, or credit supply during the Great Recession since almost all countries in the sample suffered from bank equity price index declines that were larger than 30 percent (see panel c in Figure 1). Return to 8
- The early 1970s marked the end of the Bretton Woods system, which was the prevailing international monetary system of the developed economies. Return to 9
- The results remain largely unchanged when year fixed effects are not controlled for and when focusing on the full sample from 1870 to 2016. Return to 10
- The real annual bank equity price index return is computed as the average of the annual growth rate of the bank equity price index in a given month in deviation from CPI inflation in that month. The source of bank equity price index data is Dow Jones US Banks Index, and the source for CPI inflation is the United States Bureau of Labor Statistics. Return to 11
Suggested Citation
Hajdini, Ina. 2023. “Implications of Bank Equity Price Declines for Inflation.” Federal Reserve Bank of Cleveland, Economic Commentary 2023-18. https://doi.org/10.26509/frbc-ec-202318
This work by Federal Reserve Bank of Cleveland is licensed under Creative Commons Attribution-NonCommercial 4.0 International

