

- Share
Increasing the (Female) Labor Supply

The views authors express in Economic Commentary are theirs and not necessarily those of the Federal Reserve Bank of Cleveland or the Board of Governors of the Federal Reserve System. The series editor is Tasia Hane. This paper and its data are subject to revision; please visit clevelandfed.org for updates.
Introduction
In the wake of the SARS-CoV-2 (COVID-19) pandemic, the United States has seen one of the strongest labor markets on record. In December 2022, the unemployment rate was 3.5 percent, wages were growing at 6.1 percent,1 and there were two job openings for every unemployed individual.2 These facts all point to a mismatch between demand for workers and the number of people looking for work, a situation leading some to ask, “Who is not looking for work—and why not?” People who are neither employed nor looking for work are considered to be out of the labor force, and many adults in the United States fall into this category. In December 2022, the prime-age (people aged 25 through 54) labor force participation rate (LFPR) was around 82 percent, up from a low of around 80 percent earlier in the pandemic and slightly lower than its value of just over 83 percent in December 2019, before the pandemic began.3
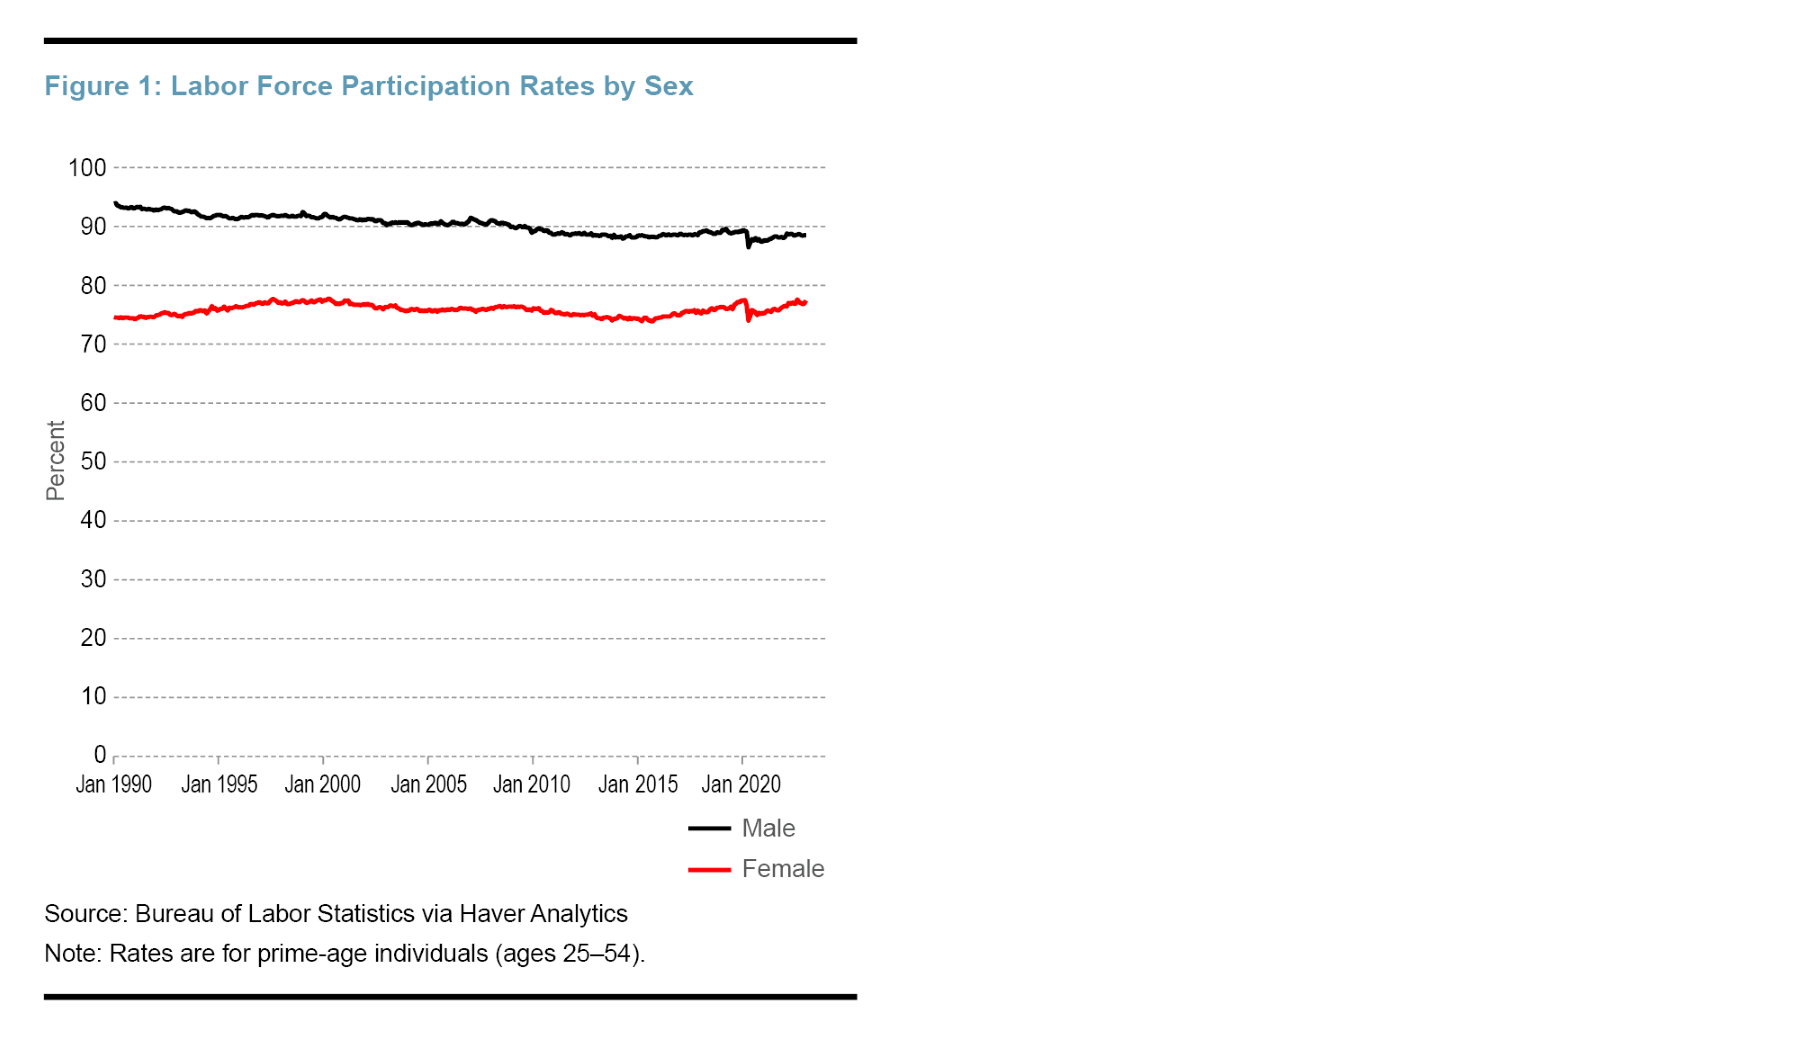
Labor force participation varies by many demographic factors, and a notable and persistent difference exists between men and women. As depicted in Figure 1, the labor force participation rate for prime-age female workers4 was at 74 percent in 1990 and has never breached 78 percent. By comparison, labor force participation by prime-age male workers, while declining slowly over time, has never fallen below 86 percent. There are undoubtedly many reasons why women are not as likely to participate in the labor force as men; this Commentary will focus on three: how the United States taxes the income of married couples, how social security benefits are allocated, and the cost of childcare.
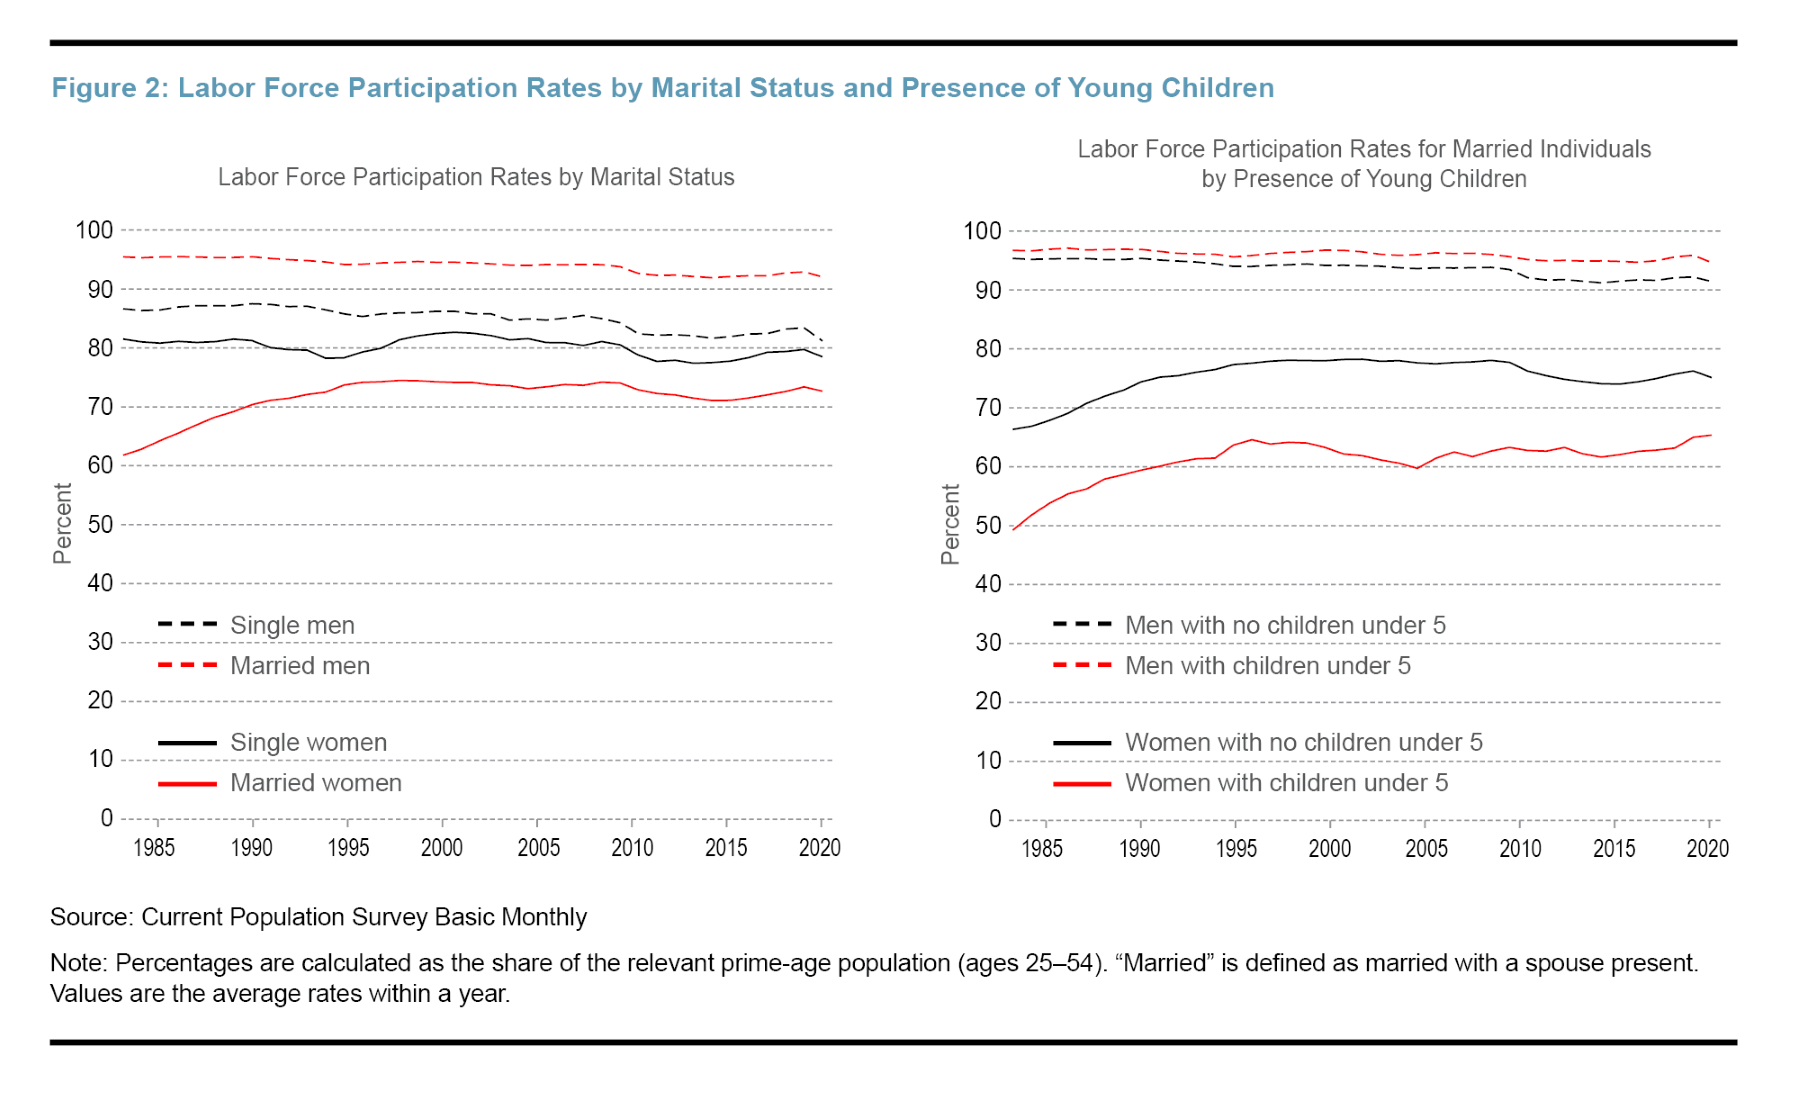
The above factors also affect men’s labor force participation, but the impact of these constraints is felt more by women for the following three reasons. First, married women in opposite-sex couples are less likely to participate in the labor force than either married men or single women.5 The share of married men participating in the labor force is about 7 percentage points higher than that for single men, while the opposite holds true for women. The participation rate for married women is about 7 percentage points lower than that for single women (see the left panel of Figure 2). While single women are less likely to be in the labor force than single men, the difference in labor force participation rates between prime-age married men and prime-age married women is much wider, at over 20 percentage points. Second, married women who do work often earn less than their spouses and are thus so-called “secondary earners.” According to the 2019 American Community Survey, in only about 30 percent of two-worker opposite-sex households does the woman earn more than the man. Last, women are more likely to be the primary caregivers for their young children (Laughlin, 2013). This is demonstrated in the discrepancy between female and male labor force participation rates for couples with young children (see the right panel of Figure 2). Married men with young children are slightly more likely to be in the workforce than married men without young children. For women, the opposite is true. Married women with young children under 5 years old have a participation rate over 10 percentage points lower than married women without young children.
Taxes, Social Security, and Married Couples
There are two ways in which the United States treats married taxpayers differently from single taxpayers that affect incentives to participate in the labor force. The first is joint taxation that results in higher marginal tax rates for the secondary earner (the individual in the couple who earns less) in a couple that files jointly rather than individually.6 The second has to do with two features of Social Security benefits.
The marginal tax rate is the tax rate paid on one’s next dollar earned. For a single person outside the labor force, or for one currently unemployed, the marginal tax rate is zero (or often negative, since the federal government provides aid to people in the lowest income brackets). Married couples are most often taxed as a unit. Couples can choose to file their tax returns separately; however, doing so makes them ineligible for certain tax deductions, generally resulting in higher combined taxes for the couple, and, in practice, very few married couples file separate tax returns. Even if the total taxes paid by a couple is the same as the sum of the taxes they would pay as individuals, joint taxation affects the marginal tax rate (the tax rate of the next dollar earned) for the secondary earner. When considering the decision of whether to participate in the labor market or whether to work one more hour, the marginal tax rate is the most important factor because it lowers incentives to work.
Joint taxation implies that the marginal tax rate for someone married to a wage earner is determined for the most part by the income of that person’s spouse. While a single person would take home at least 100 percent of his or her first dollar earned, a secondary wage earner would take home a fraction of that first dollar earned, and that fraction depends on his or her spouse’s income since both incomes are taxed together as a unit.7 This fact lowers the amount of the secondary earner’s effective wage and therefore reduces that person’s incentive to work.8
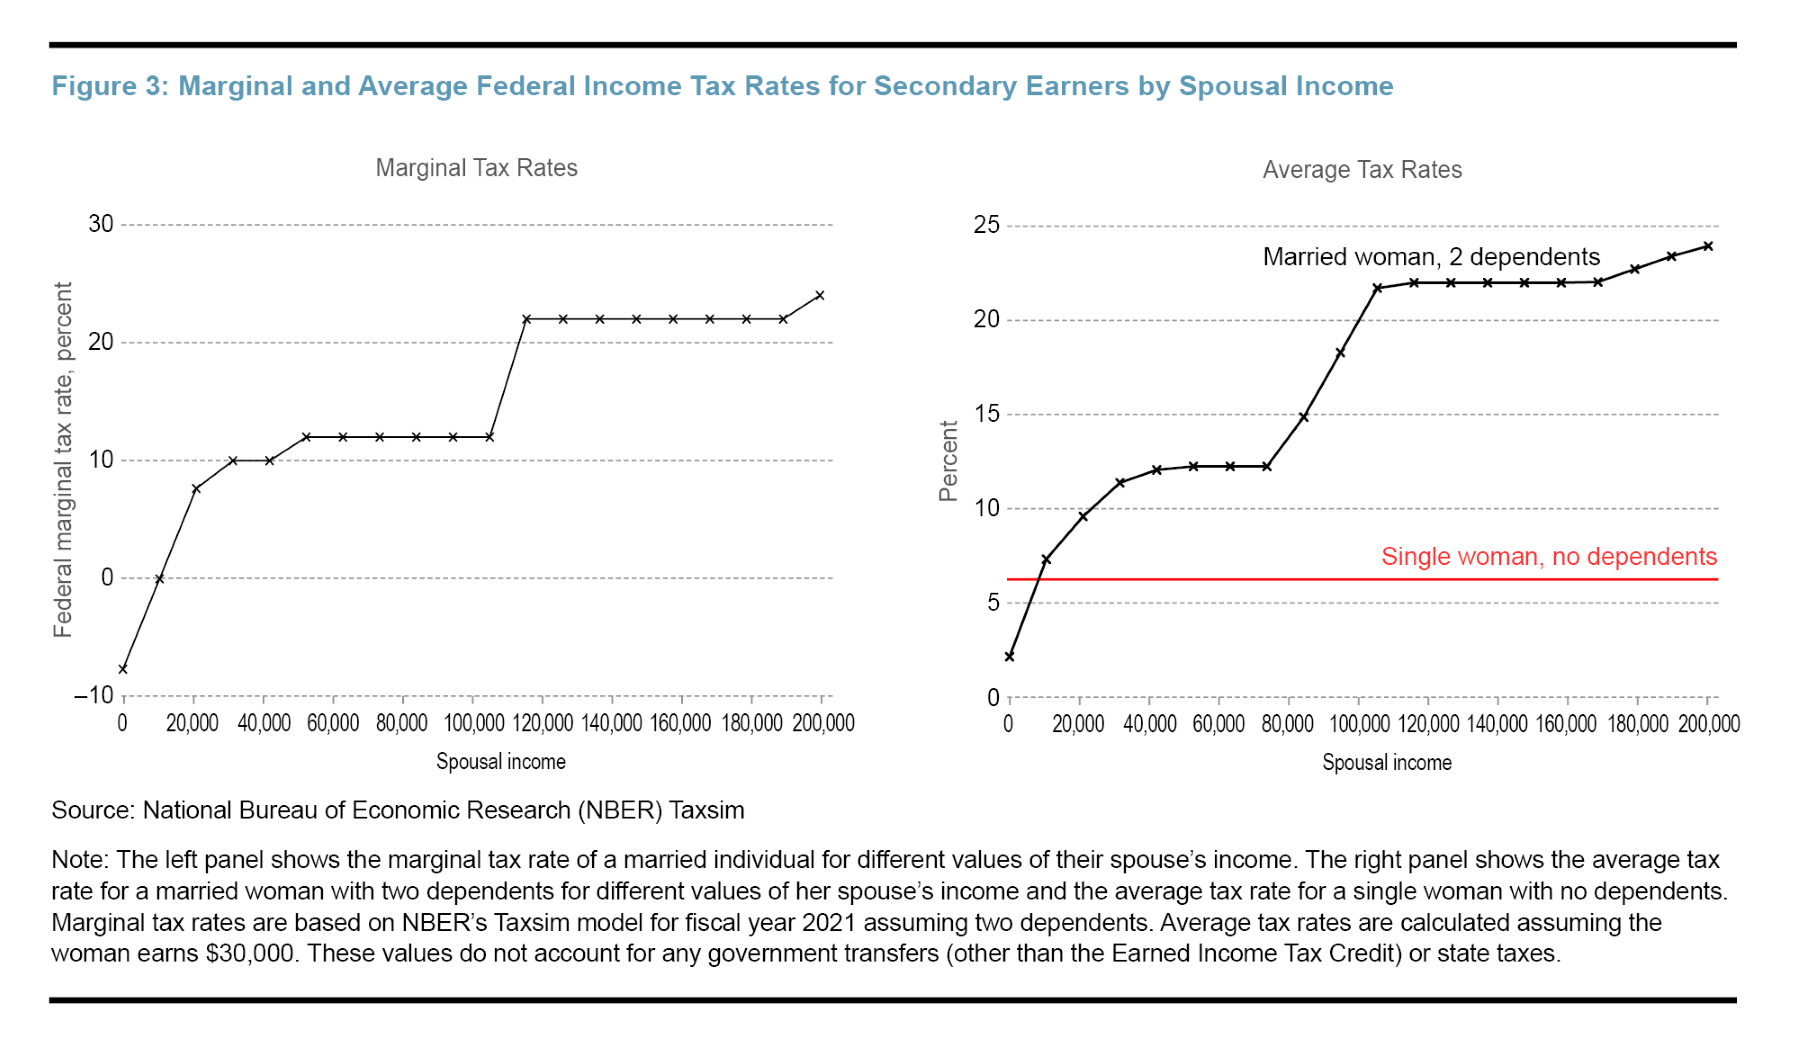
The left panel of Figure 3 plots a sample of federal marginal tax rates for a secondary earner whose spouse earns a given income. This is a simplified example in that it does not account for any additional transfers received, such as housing subsidies or nutrition benefits, and is limited to federal taxes. Since the US tax system is progressive, the marginal tax rate increases as a spouse’s income rises. The graph shows that a person with a spouse who does not work (or earns zero income) will have a negative marginal tax rate (because of the Earned Income Tax Credit, which is a tax credit that is designed to encourage labor force participation). A person with a spouse who earns $40,000 in a year has a marginal tax rate of 10 percent, meaning that the earner will pay 10 cents of his or her first dollar earned paying federal income taxes.
The potential effect of joint taxation on women’s labor force participation is perhaps more easily understood when considering the average share of wages a woman would spend on federal income taxes, as depicted in the right panel of Figure 3. Consider a woman who earns $30,000 a year. If she is single with no dependents, she will spend just over 6 percent of her annual income on federal income taxes. By contrast, a woman with two dependents married to someone making $40,000 a year will spend over 12 percent of her annual income on federal income taxes.
The second factor that affects the labor supply of secondary earners in marriages is income from Social Security, the system that workers pay into and then draw benefits from upon retirement. The presence of Social Security income does not affect just the labor force participation of its current recipients. It can also affect the labor force participation of younger people because they anticipate receiving these benefits at a later date. There are two specific Social Security benefits that are relevant here. The first is the spousal benefit: while one’s spouse is alive, a married individual receives the higher amount of the following two options, the person’s own Social Security benefit or half of the person’s spouse’s Social Security benefit. The second is the survivor benefit: after one’s spouse passes away, the remaining spouse receives the higher of their own social security benefit or the survivor’s spouse’s benefit. The fact that a married person’s Social Security income has a floor that depends on the person’s spouse’s income implies that the person has less incentive to work.
Understanding how these policies affect women’s labor force decisions is complicated because more than one thing would change if joint taxation or Social Security benefits changed. For example, joint taxation and Social Security benefits affect men’s labor force decisions. Men are often the primary wage earners in opposite-sex couples. If the wife of a married couple were to work more, it is possible that the husband would choose to work less. On the other hand, eliminating the spousal and survivor Social Security benefits may result in men’s working more to make up for the decline in retirement income for their spouses.
Because of these many responses to policy changes, understanding how and how much joint taxation and the structure of Social Security benefits affect women’s labor force participation requires a model. Borella et al. (2023) develop and solve such a model. They estimate that for a cohort of women born in 1955, eliminating joint taxation and Social Security marriage-related benefits would increase labor force participation by a full 25 percentage points for married women under 30.9 The effect decreases as women age but still remains above 10 percentage points for all women below the age of 60. The majority of the effect for younger women is driven by the removal of joint income taxes, while the effect of Social Security benefits increases with age.
The Cost of Childcare
As evidenced by the even lower LFPR rates for women with young children, the cost of childcare is another deterrent to women’s working. Raising children is incredibly expensive in the United States. In 2015, the USDA estimated that middle-income families would spend $233,610 to raise a child born in 2015, and childcare and education (excluding college) accounts for 16 percent of that total, the third largest category after housing and food (Lino et al., 2015). The effect of this high cost on family welfare can be seen in summary statistics, such as the 2021 official poverty rates among families with one child under 6 (15 percent) versus the rates for those with two children under 6 (18 percent),10 and in how working parents manage childcare. In 2011, the most common childcare providers for children under 5 with working mothers were their grandparents (Laughlin, 2013).
The economic concept behind how the cost of childcare affects the female LFPR is the same as for joint taxation. The cost of childcare is effectively a tax that must be paid in order for someone to work. While the household as a unit has to pay for any childcare, it is the decision of the primary caregiver to work that requires that the household need childcare. Since women are more often the primary caregiver in the household, they are generally the ones whose decisions are directly influenced by that tax. The implied marginal tax rate faced by the secondary earner is the share of her income that will be used to pay for childcare. For example, if a woman will earn $25 an hour at a new job and childcare costs $15 an hour, her pretax take home pay will be $10, a marginal tax rate of 60 percent. This “tax rate” is regressive, affecting lower-income households more, since while higher-income households may choose more expensive forms of childcare, in general the rise in the cost of childcare is not commensurate with a rise in income. For married women, the cost of childcare can be compounded by the marginal tax rates implied by joint taxation. There is some tax relief given to parents paying for childcare, but it falls far short of covering the total costs of childcare.11
The rising cost of childcare has led to calls for increased childcare subsidization, especially for low-income households. Such subsidization has the potential to increase the female labor supply, but just as in the analysis of joint taxation and Social Security benefits, truly understanding how requires a model that accounts for other resulting changes.
Borowsky et al. (2022) estimate such a model. They estimate the impact on the labor force participation of mothers of young children of, effectively, two different policies that increase childcare subsidies. The first (narrower) policy considers increasing the funding of the Child Care and Development Block Grant (CCDBG), which provides subsidies for childcare to disadvantaged families with children. Currently, only 15 percent of eligible families receive these subsidies (Chien, 2021). Borowsky et al. (2022) consider a funding change such that all eligible families would receive the subsidies. The second, broader policy change they consider would include an entitlement-based childcare subsidy system for eligible children ages 0 to 5 and universal free pre-K for three- and four-year-olds.
Their model implies that the share of working mothers with children ages zero to four years old would increase by 9.7 percentage points under the broad policy and 4.6 percentage points under the narrow policy. These increases are driven by women in lower-income households. Borowsky et al. predict that with the broad childcare subsidy in place, employment among mothers in the bottom household income quintile would increase by 18.2 percentage points. By contrast, the policy increases full-time employment for mothers in the top income quintile by under 1 percentage point. Additionally, they predict that the effect on labor force participation will be substantially larger for one-parent households (the broad policy would increase their full-time employment by over 19 percentage points), compared to an increase of 5 percentage points for two-parent households.
The Potential Impact on the Supply of Labor
There are over 35 million prime-age married women in the United States. Increasing their labor force participation by 10 percentage points would add almost 3.5 million people to the workforce. There are over 10 million women (both married and unmarried) with children less than 5 years old. A 10 percentage point increase in their labor force participation would add 1 million people to the workforce, which as of mid-2022, comprised about 164 million people. These effects are not additive since many women with children are also married, but they are still substantial.
A way of understanding the size of these effects is to compare them to estimates of the effect on labor force participation of other social insurance programs such as unemployment insurance (UI), Social Security Disability benefits, and assistance for low-income families. These programs have been the subject of much economics research for their potential impacts on behavior (see Schmieder and Von Wachter, 2016; Moffitt, 2002).
There is little dispute that the levels and duration of unemployment benefits affect labor force decisions, but the magnitudes of these effects are difficult to estimate because changes in unemployment benefits are often correlated with macroeconomic events,12 making it difficult to disentangle whether the behavioral changes are due to the macroeconomic event or the change in unemployment benefits per se. Papers (such as Card and Levine, 2000) that have used purely politically motivated changes in benefits have found smaller behavioral responses to unemployment insurance benefits than papers that have used changes driven by the business cycle (Schmieder and Von Wachter, 2016). The results in Card and Levine (2000) imply that a one-month increase in the duration of unemployment benefits increases the nonemployment duration by three days. This number is difficult to compare directly to the estimates of the impact of childcare subsidies and joint taxation on labor force participation. A number of papers focusing on the Great Recession found that unemployment insurance increased the unemployment rate by about 0.3 percentage points (Hall, 2015). Applying these numbers to today’s LFPR,13 this finding implies an increase in the unemployed population of under half a million. While not small, this is less than the estimates for the increase in the labor force if the government ended joint taxation or increased subsidization of childcare.
The discussion about disability benefits hinges on which people who receive disability benefits are able to work (since most are unable to work) and how many of them would work if they were not receiving benefits. One paper estimates that about 23 percent of applications for disability benefits are “marginal” in the sense that the applicants could get denied benefits because their examiner thinks they can work, and that of those 23 percent, 28 percent will then work (Maestas et al., 2013).14 Even if we apply those numbers to the current stock of workers with disability benefit recipients—an overstatement because the population of people receiving disability benefits are older and less marginal than applicants—this implies an increase of about half a million people to the workforce.15
The disincentives related to other programs such as Temporary Assistance for Needy Families (TANF) cash assistance or the Supplemental Nutrition Assistance Program (SNAP)—more popularly known as “food stamps”—are often compounded by their design. Many people become ineligible for these programs as their income rises, a phenomenon known as “the benefits cliff.” It is often the case that the amount of support a person may lose in assistance by earning more in wages is larger than the amount they would earn in wages if they did work more. That these benefits cliffs disincentivize work is not disputable, but these cliffs do not affect all program recipients. They are also a design flaw in these programs, one that has received attention but for which a fix has as yet proved elusive.16
All Policies Have Costs and Benefits
Every policy, or lack of a policy, has costs and benefits. TANF and SNAP reduce poverty (Ben-Shalom et al., 2011) and have potential lifelong impacts on children’s economic and physical health (Hoynes et al., 2016). UI has potentially large welfare benefits effected mainly by preventing people from having to reduce their spending dramatically when they are unemployed (smoothing consumption) that may outstrip both the direct cost of UI and the cost resulting from behavioral changes (Schmieder and Von Wachter, 2016). Disability benefits ensure that people who physically cannot work are not living in abject poverty.
A cost of joint taxation is that it creates an incentive for the secondary earner (usually a woman) to not work. The main benefit of joint taxation is horizontal equity: married couples with the same income are taxed the same no matter the distribution of that income. A couple in which only one person works and earns $80,000 is taxed the same as one in which both spouses work and each earns $40,000. The question becomes one of valuing horizontal equity. And yet horizontal equity seems to ignore the fact that the couple with two workers will often have to pay for childcare if they do not have access to childcare from their extended family. Furthermore, since people tend to marry within their own economic class (Bertrand et al., 2015), the potential earnings of the household with one person earning $80,000 is almost certainly much higher than the household in which both people earn $40,000.
While the spousal and survivor Social Security benefits lower the benefits to working, they also provide retirement income to people who have spent their working lives in home-production and caring for their own children. These benefits also mitigate the fact that women earn less than men on average (Blau and Kahn, 2006) and live longer, a situation which puts them at higher risk of poverty in old age.
Identifying exactly who would gain or lose and by how much if both joint taxation and the aforementioned Social Security benefits were removed is also a question that requires a model. The estimates from Borella et al. imply that most people would be better off, with a small minority worse off (primarily young, single women who now anticipate working more in the future). Men benefit because their wives work more and their combined household income is higher.
Increasing childcare subsidies would either cost taxpayers more, resulting in higher taxes, or result in a reallocation of government funds away from other programs such as Social Security Disability insurance. But beyond promoting female labor force participation, increasing access to preschool education, especially among disadvantaged youth, has many potential positive externalities such as lowering crime rates and effecting better labor force outcomes, both of which reduce reliance on social insurance programs (Heckman et al., 2010a). Further, they could have a rate of return equal to or higher than that of the stock market if targeted (Heckman et al., 2010b). These outcomes depend, of course, on the quality of the preschool program. Scaling high-quality programs is difficult, but not impossible (Zhou et al., 2021). The benefits of childcare subsidies would also not be evenly distributed; they have the potential to provide the largest welfare gain to single-parent households, especially those headed by a woman. Families with a female head of household had a poverty rate above 25 percent in 2021.17
Conclusion
Women’s labor force participation has been persistently below that of men. Women married to men typically earn less than their spouses and generally provide more of the care for their young children. These sociological facts in concert with the high marginal tax rates disproportionately imposed on women by how the United States taxes married couples, how Social Security benefits are designed, and the expense of childcare create incentives for women not to work.
There are many sources of marginal tax rates and disincentives to work. The social insurance programs available in the United States have received substantial attention for their impact on work behavior. The actual impact of these marginal tax rates on behavior are empirical questions, and many of the studies of social insurance programs have found the effects on employment to be relatively small. In contrast, the evidence indicates that joint taxation, features of Social Security benefits, and the expense of childcare have large, economically meaningful effects on the labor force participation of women.
Any program that creates a disincentive to work should have that cost weighed against that program’s benefits. Social insurance programs such as TANF and SNAP can reduce poverty and provide low-income families with stability. Hopefully, future research will help us better understand the cost and benefits of the fiscal policies highlighted in this Commentary.
Endnotes
- According to the Federal Reserve Bank of Atlanta Wage Growth Tracker. Return to 1
- According to the Bureau of Labor Statistics. Return to 2
- Based on nonseasonally adjusted values provided by Haver Analytics. Return to 3
- I will use terms for biological sex and gender interchangeably. In reality, a person’s gender identity may, of course, be different than their biological sex. Return to 4
- For the purposes of this examination, I use “married women” and “married men” to refer to married women in opposite-sex couples and married men in opposite-sex couples, respectively. Return to 5
- Joint taxation is also a cause of the marriage bonus or penalty (see https://news.bloombergtax.com/daily-tax-report/the-unfairness-of-the-marriage-tax-penalty for details), whereby some married couples pay a lower or higher dollar amount in federal income taxes when married relative to the combined total of what they would pay if each were single. However, the higher marginal tax rate faced by a secondary earner exists whether or not a couple experiences a marriage bonus or penalty. Despite joint taxation, research has found little impact of joint taxation or marriage penalties on marriage rates (Deshpande and Mueller-Smith, 2022). Return to 6
- Joint taxation is not internationally universal. In some countries, married couples are taxed no differently than single people, and this discrepancy has been identified as a possible reason why women’s LFPRs vary across countries (Bick and Fuchs-Schündeln, 2018). The idea that marginal tax rates affect labor supply is also not new. It has long been used as an explanation for why Americans work more than Europeans (Prescott, 2004) and has been used to explain how social policies for lower-income Americans may reduce incentives to work. However, marginal differences in tax rates between men and women in the United States have received relatively scant popular attention. Return to 7
- While this marginal tax rate affects both whether people choose to work (the extensive margin) and how much to work if they do work (the intensive margin), given that most workers can not change their hours at will, its most salient effect is most likely on labor force participation, not hours worked. Return to 8
- The authors also assume a reduction in income taxes that keeps the government budget balanced. Since more people are working in their counterfactual, the income tax does not need to be as high to generate the same tax income. Return to 9
- See https://www.census.gov/data/tables/time-series/demo/income-poverty/cps-pov/pov-04.html Return to 10
- The 2022 Child Tax Credit is $2,000 per eligible dependent under 18 years of age. In addition, households can claim a childcare tax credit. In 2022, the maximum childcare credit is $2,100 for people with two or more children or $1,050 for those with one child. Both of these credits were temporarily expanded in 2021 as a result of the American Rescue Plan Act. Return to 11
- For example, the duration of unemployment benefits was increased during the Great Recession, and unemployment benefits were enhanced during the COVID-19 pandemic. Return to 12
- This is not ideal because the labor force today is different from the labor force during the Great Recession. However, it does provide a more directly comparable numerical estimate of the increase in the labor force. Return to 13
- Estimates of the effect on labor force participation from David et al. (2016) and French and Song (2014) are in a similar range. Return to 14
- Hall (2015) put an upper bound on the number of potential people with disability benefits who can work at 770,000 people in 2013. Return to 15
- For example, see the June 25, 2015, Joint Hearing before the Committee on Ways and Means and the Committee on Agriculture in “How Our Welfare System Can Discourage Work” and this Fed Communities article https://fedcommunities.org/stories/benefits-cliffs-hand-up-not-handout/. Furthermore, the interaction of benefit cliffs and tax credits often makes it difficult for families to predict whether working more will result in an increase in their budgets (Anderson et al., 2022). Return to 16
- See https://www.census.gov/content/dam/Census/library/publications/2022/demo/p60-277.pdf. Return to 17
References
- Anderson, Theresa, Amelia Coffey, Hannah Daly, Heather Hahn, Elaine Maag, and Kevin Werner. 2022. “Balancing at the Edge of the Cliff: Experiences and Calculations of Benefit Cliffs, Plateaus, and Trade-Offs.” Research report. Urban Institute. https://www.urban.org/research/publication/balancing-edge-cliff.
- Autor, David H., Mark Duggan, Kyle Greenberg, and David S. Lyle. 2016. “The Impact of Disability Benefits on Labor Supply: Evidence from the VA’s Disability Compensation Program.” American Economic Journal: Applied Economics 8 (3): 31–68. https://doi.org/10.1257/app.20150158.
- Ben-Shalom, Yonatan, Robert A. Moffitt, and John Karl Scholz. 2011. “An Assessment of the Effectiveness of Anti-Poverty Programs in the United States.” Working paper 17042. National Bureau of Economic Research. https://doi.org/10.3386/w17042.
- Bertrand, Marianne, Emir Kamenica, and Jessica Pan. 2015. “Gender Identity and Relative Income within Households.” The Quarterly Journal of Economics 130 (2): 571–614. https://doi.org/10.1093/qje/qjv001.
- Bick, Alexander, and Nicola Fuchs-Schündeln. 2018. “Taxation and Labour Supply of Married Couples across Countries: A Macroeconomic Analysis.” The Review of Economic Studies 85 (3): 1543–76. https://doi.org/10.1093/restud/rdx057.
- Blau, Francine D., and Lawrence M. Kahn. 2006. “The US Gender Pay Gap in the 1990s: Slowing Convergence.” ILR Review 60 (1): 45–66. https://doi.org/10.1177/001979390606000103.
- Borella, Margherita, Mariacristina De Nardi, and Fang Yang. forthcoming. “Are Marriage-Related Taxes and Social Security Benefits Holding Back Female Labour Supply?” The Review of Economic Studies. https://doi.org/10.1093/restud/rdac018.
- Borowsky, Jonathan, Jessica H. Brown, Elizabeth E. Davis, Chloe Gibbs, Chris M Herbst, Aaron Sojourner, Erdal Tekin, and Matthew J. Wiswall. 2022. “An Equilibrium Model of the Impact of Increased Public Investment in Early Childhood Education.” Working paper 30140. National Bureau of Economic Research. https://doi.org/10.3386/w30140.
- Card, David, and Phillip B. Levine. 2000. “Extended Benefits and the Duration of UI Spells: Evidence from the New Jersey Extended Benefit Program.” Journal of Public Economics 78 (1–2): 107–38. https://doi.org/10.1016/S0047-2727(99)00113-9.
- Chien, Nina. 2021. “Factsheet: Estimates of Child Care Eligibility and Receipt for Fiscal Year 2018.” US Department of Health and Human Services, Office of the Assistant Secretary for Planning & Evaluation. https://aspe.hhs.gov/reports/estimates-child-care-eligibility-receipt-fy-2018.
- Deshpande, Manasi, and Michael G. Mueller-Smith. 2022. “Does Welfare Prevent Crime? The Criminal Justice Outcomes of Youth Removed from SSI.” Working paper 29800. National Bureau of Economic Research. https://doi.org/10.3386/w29800.
- French, Eric, and Jae Song. 2014. “The Effect of Disability Insurance Receipt on Labor Supply.” American Economic Journal: Economic Policy 6 (2): 291–337. https://doi.org/10.1257/pol.6.2.291.
- Hall, Robert E. 2015. “Quantifying the Lasting Harm to the US Economy from the Financial Crisis.” NBER Macroeconomics Annual 29 (1): 71–128. https://doi.org/10.1086/680584.
- Heckman, James J., Seong Hyeok Moon, Rodrigo Pinto, Peter A. Savelyev, and Adam Yavitz. 2010. “The Rate of Return to the HighScope Perry Preschool Program.” Journal of Public Economics 94 (1–2): 114–28. https://doi.org/10.1016/j.jpubeco.2009.11.001.
- Heckman, James, Seong Hyeok Moon, Rodrigo Pinto, Peter Savelyev, and Adam Yavitz. 2010. “Analyzing Social Experiments as Implemented: A Reexamination of the Evidence from the HighScope Perry Preschool Program.” Quantitative Economics 1 (1): 1–46. https://doi.org/10.3982/QE8.
- Hoynes, Hilary, Diane Whitmore Schanzenbach, and Douglas Almond. 2016. “Long-Run Impacts of Childhood Access to the Safety Net.” American Economic Review 106 (4): 903–34. https://doi.org/10.1257/aer.20130375.
- Laughlin, Lynda. 2013. “Who’s Minding the Kids? Child Care Arrangements: Spring 2011.” P70-135. Household Economic Studies. US Census Bureau. https://www.census.gov/library/publications/2013/demo/p70-135.html.
- Lino, Mark, Kevin Kuczynski, Nestor Rodriguez, and TusaRebecca Schap. 2015. “Expenditures on Children by Families, 2015.” Miscellaneous Report 1528–2015. US Department of Agriculture, Center for Nutrition Policy and Promotion. https://www.fns.usda.gov/resource/2015-expenditures-children-families.
- Maestas, Nicole, Kathleen J. Mullen, and Alexander Strand. 2013. “Does Disability Insurance Receipt Discourage Work? Using Examiner Assignment to Estimate Causal Effects of SSDI Receipt.” American Economic Review 103 (5): 1797–1829. https://doi.org/10.1257/aer.103.5.1797.
- Moffitt, Robert A. 2002. “Welfare Programs and Labor Supply.” Handbook of Public Economics 4: 2393–2430. https://doi.org/10.1016/S1573-4420(02)80013-1.
- Prescott, Edward C. 2004. “Why Do Americans Work so Much More than Europeans?” Working paper 10316. National Bureau of Economic Research. https://doi.org/10.3386/w10316.
- Schmieder, Johannes F., and Till Von Wachter. 2016. “The Effects of Unemployment Insurance Benefits: New Evidence and Interpretation.” Annual Review of Economics 8: 547–81. https://doi.org/10.1146/annurev-economics-080614-115758.
- Zhou, Jin, Alison Baulos, James J. Heckman, and Bei Liu. 2021. “The Economics of Investing in Early Childhood: Importance of Understanding the Science of Scaling.” In The Scale-up Effect in Early Childhood and Public Policy, edited by John List, Dana Suskind, and Lauren Supplee, 76–97. Routledge. https://doi.org/10.4324/9780367822972-6.
Suggested Citation
Loewenstein, Lara. 2023. “Increasing the (Female) Labor Supply.” Federal Reserve Bank of Cleveland, Economic Commentary 2023-05. https://doi.org/10.26509/frbc-ec-202305
This work by Federal Reserve Bank of Cleveland is licensed under Creative Commons Attribution-NonCommercial 4.0 International

