

- Share
Making Sense of Eviction Trends during the Pandemic
Eviction filings have largely returned to their prepandemic levels in 2022 after a long period of being below trend. In this Economic Commentary, I describe the trends in eviction filings collected so far during the pandemic and pandemic-era policies aimed at mitigating the damage of the pandemic on housing stability. I show that restrictions on evictions, common early in the pandemic, are associated with lower levels of eviction filings; that recent rent-price growth is associated with higher levels of eviction filings; and that the timing of eviction trends varies in response to the federal emergency rental assistance program in a way that is consistent with the program’s design.

The views authors express in Economic Commentary are theirs and not necessarily those of the Federal Reserve Bank of Cleveland or the Board of Governors of the Federal Reserve System. The series editor is Tasia Hane. This paper and its data are subject to revision; please visit clevelandfed.org for updates.
Introduction
When the COVID-19 pandemic reached the United States, significant public concern was focused on the potential for renters, who faced significant job losses, to endure eviction as they became unable to pay rent. Public policy was highly responsive to the risk. First, state and local jurisdictions responded with temporary restrictions preventing landlords from pursuing eviction (Benfer et al., 2020). Some jurisdictions extended these restrictions deep into the pandemic. At the national level, federal agencies implemented short-term eviction protections via the Coronavirus Aid, Relief, and Economic Security (CARES) Act, which covered federally financed properties comprising an estimated 28 percent of US rental stock (Goodman et al., 2020). In September 2020, the Centers for Disease Control and Prevention (CDC) also issued a federal order limiting evictions in certain cases.
As the pandemic wore on, renters reported continuing difficulty affording rent. In a December 2020 survey by the US Census, 18 percent of renters reported being behind on rent and 3 percent reported believing eviction was “very likely” in the next two months (Census Household Pulse Survey: Key Phase 3 Housing Payment Findings, 2021).1 Reed and Divringi (2020) estimated that 1.3 million renter households would owe $7.2 billion in back rent by the end of 2020. In the face of ongoing uncertainty for renters, Congress authorized nearly $47 billion in rental assistance in late 2020 and early 2021, an amount equal to 8 percent of all 2020 expenditures on tenant-occupied housing in the United States.2
Finally, the rental market underwent significant fluctuations during the pandemic, with rent prices moderating or declining in some cities in 2020 before rebounding sharply during the economic recovery in 2021. These large changes in rent prices may impact eviction filing rates by altering a landlord’s opportunity cost for pursuing eviction against an incumbent tenant. In weighing the benefits and costs of pursuing eviction, tight rental markets (exemplified by rising rents) lower landlords’ search cost for new tenants. The higher rents also raise the prospective payoff for landlords if, for example, a new tenant were better able to afford the higher rent than an incumbent tenant struggling to pay.
With these experiences of the pandemic in mind, I explore in this Economic Commentary what changes in eviction restrictions, rental assistance, and rent prices mean for eviction filings. I review pandemic-era eviction trends and consider how policy responses and market forces have impacted those trends. I find that restrictions on evictions are associated with lower levels of eviction filings; that recent rent-price growth is associated with higher levels of eviction filings; and that the timing of eviction trends varies in response to the federal emergency rental assistance program in a way that is consistent with the program’s design.
Data on evictions
When the pandemic began, current data on evictions were hard to come by because of a variety of factors. The most accessible measure of evictions, court filings, requires accessing local court systems to deduce information about cases. These court cases do not capture informal evictions in which tenants are removed by landlords without pursuing a case in courts. In addition, not all filings lead to actual evictions, and court data on case outcomes are available inconsistently (Goplerud and Pollack, 2021). A study of evictions in Cleveland, Ohio, from 2013 to 2016 found that 43 percent of filings resulted in a judgment against the tenant (Richter et al., 2021). Humphries et al. (2019) note that 66 percent of eviction filings in a sample from Cook County, Illinois, between 2000 and 2016 resulted in judgments against the tenant.
While incidental reporting on eviction filings in local courts reached the press in the early days of the pandemic, there was no large-scale system in place to conduct real-time surveillance of evictions. In July 2020, the Federal Reserve Bank of Cleveland examined weekly trends from 44 cities and counties across the nation, showing steep declines in eviction filings from prepandemic levels (Cowin et al., 2020). Updates to the Bank’s eviction filing series currently cover 50 cities and counties (Martin, 2022). Princeton’s Eviction Lab also launched a systematic effort to measure eviction filings during the pandemic (Hepburn et al., 2020).3 To examine these trends, I construct jurisdiction-level indexes of the number of filings in the current month divided by the number of filings in a base period reflecting historical averages. For jurisdictions monitored by the Cleveland Fed, the base period is the same month in 2019. For those monitored by the Eviction Lab, it is the same month in one or more recent years between 2012 and 2019 that vary depending on the jurisdiction. An index close to 100 indicates that eviction filings are happening at the same rate as they did in the year or years leading up to the pandemic.
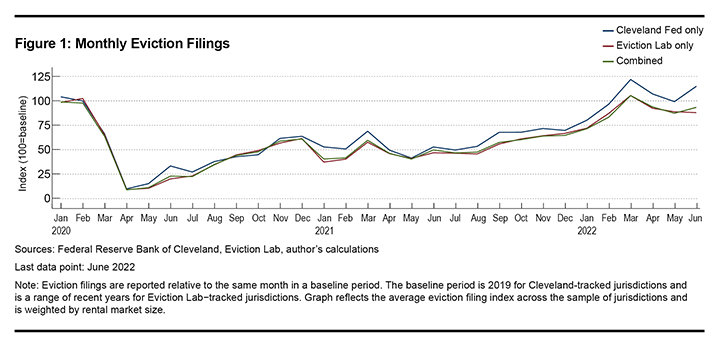
Figure 1 shows eviction filings relative to their prepandemic historic averages in each month since January 2020. Eviction filings plunged in the first months of the pandemic before gradually rising. In recent months, average eviction filings have approached their prepandemic levels.
To shed light on how pandemic-era policies may have affected these trends, I analyze data on three possible contributors: eviction restrictions, rental assistance, and rent prices.
Eviction restrictions
Eviction cases typically start with a landlord’s providing the tenant a notice to vacate followed by an eviction filing with the court. The local court will then hear the eviction case, issue a decision, and, if the landlord is successful, order the tenant to vacate. Many localities and states enacted temporary restrictions on eviction cases during the start of the pandemic. Further details about these policies are described in Cowin et al. (2020). Here I distinguish between filing restrictions, which substantially restrict filings against tenants who are unable to pay rent because of pandemic-related reasons, and proceeding restrictions, which slow or stop the process of pursuing eviction after a filing has occurred. I distinguish between these two because the object by which I measure evictions, the court filing, is directly targeted by filing restrictions while only indirectly affected by restrictions on post-filing proceedings.4 Other policies have also been implemented in some jurisdictions, such as pay-to-stay laws, which allow tenants to cure rent defaults to avoid eviction, or eviction diversion programs that either encourage or require tenants and landlords to engage in mediation prior to an eviction hearing. Such policies are more difficult to quantify and are omitted from this analysis.
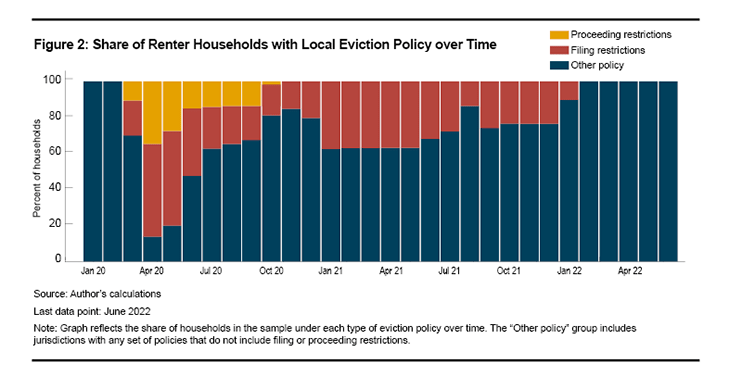
In the sample of cities and counties in this analysis, local eviction restrictions were most common in April 2020, when 86 percent of renter households in these markets faced a restriction on either proceedings or on filings. This proportion gradually decreased as the pandemic continued, as seen in Figure 2. The last recorded filing restriction in the sample expired in January 2022.
The CDC moratorium first took effect nationwide on September 4, 2020. It outlined the conditions under which eviction proceedings should cease because of pandemic-related challenges tenants faced in paying rent. Local courts interpreted these provisions in a range of ways, while a few declined to enforce the moratorium at all. By the time the moratorium came into effect, it was the strongest pandemic-era restriction governing evictions in many places. It was struck down in August of 2021 by the Supreme Court of the United States, though it had been set to expire the following month.
In principle, restrictions on eviction are likely to reduce eviction filings. In this exercise, I find a negative correlation between eviction filings and the presence of local eviction restrictions. The relationship is particularly strong for eviction-filing restrictions, as one might expect.
Rental assistance funds
Congress released nearly $47 billion in rental assistance through the Consolidated Appropriations Act, 2021 and the American Rescue Plan Act of 2021, enacted in December 2020 and March 2021, respectively. The funds are disbursed by the US Department of the Treasury as the Emergency Rental Assistance program (ERA) to state and local government grantees and administered by governments or their designees. Allocations were made to states, tribes, territories, counties, and cities, with some places primarily served by state or county allocations and others by allocations to cities. Program funds can cover up to 15 months of back rent owed and up to three months of future rent.5
The timing of rental assistance varied substantially across local programs. Local administrators set program rules consistent with Treasury Department guidance, publicize the availability of funds to renters, guide tenants and landlords through the application process, and disburse funds. Recipient tenants must continue to occupy the unit at the time assistance is paid, a situation which makes successful payment dependent on landlord and housing court cooperation in delaying eviction actions while applications are being processed. Variations in local policies and practices can affect how effectively tenants under strain are able to use these rental assistance funds.
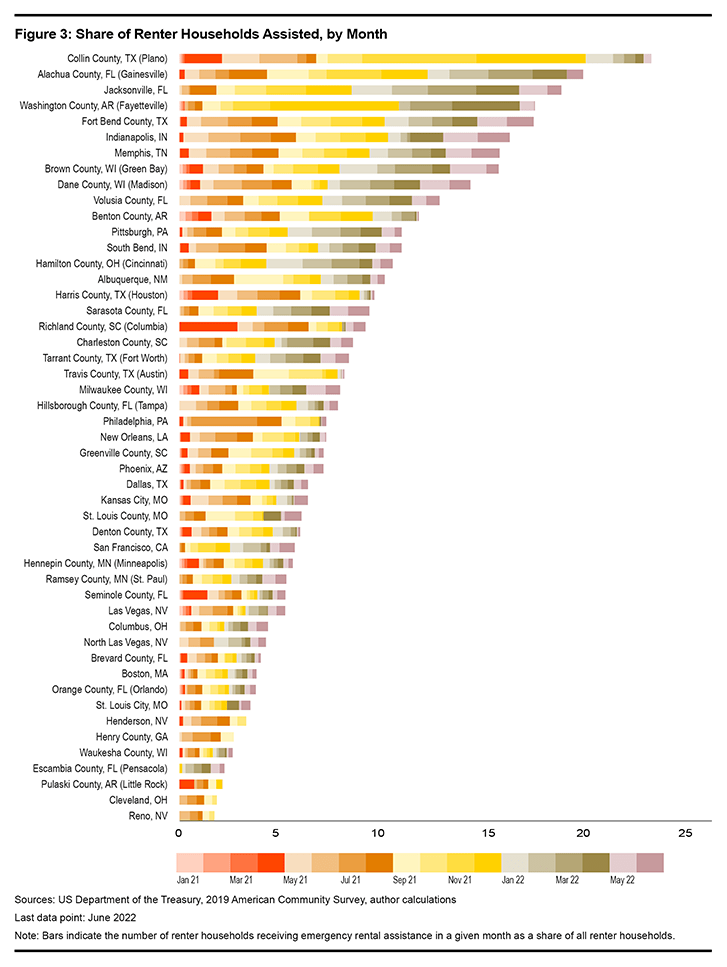
Figure 3 shows the share of renter households receiving ERA assistance over time for the markets in this analysis that receive their own allocations of ERA funds. There is variation both in the timing and intensity of aid, with some places reaching a larger share of renter households or reaching households sooner than others.
Generally, a landlord who agrees to accept ERA rental assistance must also agree not to evict the tenant over nonpayment of back rent owed and not to evict the tenant for 30 to 90 days following the disbursement of the rental assistance. Guidance by the Treasury Department encourages local program rules to adopt such forward-looking prohibitions on eviction; the duration varies by program and even over time for the same program.
This analysis is limited in its ability to assess the relationship between eviction filings and ERA funds. For instance, disentangling anticipation effects following the announcement of the program from other time-varying national factors is not feasible using this approach. The following exercise will only estimate the relationship between the timing of ERA disbursements and eviction filings.
Rental prices
Rents have also fluctuated dramatically during the pandemic, and trends are different across cities. Rents may matter for eviction filings because tenants who are unable to pay face more pressure to shoulder rent increases. Landlords also may find the search for a new paying tenant easier in a tight rental market, and the payoff of finding one who can shoulder higher rents may be greater.
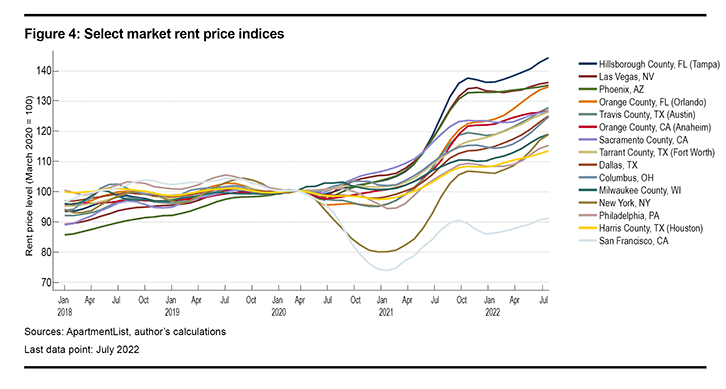
Figure 4 shows the price trends in 15 of the largest cities and counties included in this analysis, indexed to March of 2020. Data derive from Apartment List’s rent estimates at the city and county levels.6 Rent prices have varied more dramatically at the city level during the pandemic than they did in the years leading up to it. Large, dense, high-cost cities such as San Francisco and New York initially faced steep declines in rent prices during the start of the pandemic. Many other places saw slight declines or moderate increases in rents in the first year of the pandemic. In the first half of 2021, most places saw rent prices rise quickly and to varying degrees. As of June 2022, rent prices in Hillsborough County, Florida, have risen by more than 40 percent since the pandemic began, while rents in San Francisco have not yet returned to prepandemic levels.
Results
Table 1 shows the correlation between changes in the eviction filing index and a one-unit change in each of the factors considered in this exercise. The underlying regression explains the relationship between the eviction filing index across different jurisdictions and months and the explanatory factors discussed above, accounting for jurisdiction and time fixed effects. A full description of the underlying regression is available in the appendix.
| Explanatory factors | Percent change in eviction filing index |
|---|---|
| Eviction Restrictions |
|
| Restriction on eviction proceedings | –29.5 |
| Restriction on eviction filings | –61.9*** |
| Rental Assistance |
|
| Jurisdictions with their own ERA allocation | |
| 1 percent of renters helped 0-2 months ago | –17.4* |
| 1 percent of renters helped 3-5 months ago | 14.4 |
| Jurisdictions without their own ERA allocation | |
| 1 percent of renters helped 0-2 months ago | –1.8 |
| 1 percent of renters helped 3-5 months ago | –11.8 |
| Rental Market |
|
| 1 percent increase in rent price from 3 months ago | 2.0*** |
| Note: Results derive from a regression exercise: see appendix for details. Stars indicate statistical significance: *** p<0.01, ** p<0.05, * p<0.1 | |
Jurisdictions that implemented restrictions on proceedings saw reduced eviction filings by 30 percent relative to their prepandemic levels in the same month, but this result is statistically uncertain. The result on filing restrictions is more precise: a local filing restriction is associated with a reduction in the eviction filing index by 62 percent in the same month. Because the CDC moratorium applied nationally, there is no variation across both time and place that allows one to estimate its effect in a model like this.
The results indicate that ERA disbursement modestly suppresses eviction filings in the short term, when program rules prohibit landlords from carrying out evictions, but landlords tend to increase eviction filings following the disbursement of rental assistance funds and the required waiting period associated with them.
More specifically, the relationship between rental assistance and eviction filings is estimated separately for those jurisdictions that have their own ERA allocation and those that do not.7 Among those that do not, estimates are not statistically different from zero, a circumstance reflecting the uncertainty of how larger political units allocate funds to smaller ones, something which I do not observe in this exercise. Among those jurisdictions that do have their own ERA allocations, a 1 percentage point increase in the average share of renters receiving assistance during the current and previous two months results in a decline of 17 percent in the eviction filing index. A 1 percentage point increase in those receiving assistance during the previous three, four, and five months results in an increase of 14 percent in the eviction filing index. Though this result is statistically uncertain at traditional levels of significance, its direction is consistent with landlords’ deferring eviction filings in compliance with rental assistance agreements.
Finally, a 1 percent increase in rent prices over the prior three months is associated with a 2 percent increase in the eviction filing index. This result suggests that landlords in markets with higher recent rent increases are more likely to pursue eviction than those in markets with lower rent increases.
Conclusion
This exercise confirms some of the basic relationships that theory might predict, namely, that eviction restrictions are effective at reducing eviction filings, and filing restrictions more so than proceeding restrictions (which do not target filings); that rental assistance with short-term protections against eviction are potentially effective at reducing eviction in the short-term, but not necessarily the long term; and that a tightening rental market increases the likelihood that landlords pursue evictions.
Worth noting is what this exercise does not tell us about these policies and market conditions. First, this model does not explain more complicated market dynamics that may drive eviction filings. For example, landlords learned of the impending availability of rental assistance in December of 2020. It is possible that the mere announcement of future rental relief dampened landlords’ willingness to pursue eviction against tenants who owed back rent since collecting rental assistance would require the tenant to continue to live in the unit at the time payment is made. This model is incapable of measuring whether such anticipation effects exist or, if they do, the magnitude and direction of such effects. Furthermore, this model is silent on the potential for spillovers, general equilibrium effects, and other unobserved factors that may affect eviction filings.
Second, the estimates in this exercise reflect only the portion of the relationships that cannot be attributed to common time trends or durable place characteristics. If, for instance, rent price increases are correlated across time, then it is possible that rent prices have a greater impact on eviction filings than shown here but some of the effect is absorbed by the time fixed effects. Likewise, rollout of ERA funds does vary somewhat between jurisdictions, but there is some correlation between when disbursements occur. This analysis identifies only the time-varying portion of ERA funds’ relationship to eviction filings.
Endnotes
- Measures of late rent payments before the pandemic are rare and not directly comparable, but they provide useful context. In a 2017 survey of adults aged 18 through 64, Scally and Gonzalez (2018) report that 12.7 percent of renters made partial or late rent payments sometime during the previous year. Return to 1
- According to the Bureau of Economic Analysis, US households spent $559 billion on tenant-occupied nonfarm housing in 2020 (U.S. Bureau of Economic Analysis, 2022). Return to 2
- The number of jurisdictions present in the sample varies over time because of changes in court reporting. I augment 62 jurisdictions in the Cleveland Fed sample with an additional 15 cities and counties from the Eviction Lab for analysis. Sixteen of the cities and counties appear in both samples. Return to 3
- It is possible for restrictions on proceedings to increase eviction filings if, for instance, landlords advance filings that would otherwise occur later in the expectation that courts might prioritize future hearings on a first-come, first-serve basis and landlords wish to secure a favorable place in line. It is also possible for restrictions on proceedings to decrease eviction filings if, for instance, landlords anticipate resolving the issue with the tenant before proceedings resume. The theoretical impact of proceeding restrictions on eviction filings is therefore ambiguous. Return to 4
- For more details on the administration of ERA funds, see https://home.treasury.gov/policy-issues/coronavirus/assistance-for-state-local-and-tribal-governments/emergency-rental-assistance-program. Return to 5
- Apartment List uses listings and contracts settled on its own platform to construct a monthly repeat-transaction price index. For more details, see Apartment List (2020). Return to 6
- Not all jurisdictions in the analysis receive their own dedicated ERA allocation. For those that do not, I approximate ERA allocations by drawing evenly from the disbursed funds from higher-level political entities (i.e. states and counties) proportional to the local rental market’s size. I exclude from this imputed allocation rental markets that have their own dedicated ERA funds. For example, the city of Cleveland has its own ERA allocation, while the city of Lakewood does not. In the case of Lakewood, its county (Cuyahoga) and state (Ohio) receive ERA allocations. In this analysis, I assume that higher-level entities disburse their allocated funds only to areas without their own allocations. I weight the disbursement of such higher-level ERA funds proportional to the share of housing units not otherwise covered by dedicated ERA funds. This assumption likely estimates the disbursement of ERA funds to non-dedicated jurisdictions with error. Consequently, I estimate the relationship between eviction filings and the timing of ERA disbursement separately for jurisdictions that do and do not have their own dedicated ERA allocations. Return to 7
References
- Apartment List. 2020. “Introducing the New Apartment List Rent Estimate Methodology.” September 29, 2020. https://www.apartmentlist.com/research/rent-estimate-methodology.
- Benfer, Emily A, Anne Kat Alexander, Alieza Durana, Robert Koehler, and Matthew Desmond. 2020. “COVID-19 Housing Policy Scorecard.” Princeton: Princeton University. https://evictionlab.org/covid-policy-scorecard/.
- “Census Household Pulse Survey: Key Phase 3 Housing Payment Findings.” 2021. PD&R Edge: Trending. US Department of Housing and Urban Development, Office of Policy Development and Research. https://www.huduser.gov/portal/pdredge/pdr-edge-trending-042621.html.
- Collinson, Robert, John Eric Humphries, Nicholas S. Mader, Davin Reed, Daniel I. Tannenbaum, Winnie L. van Dijk. 2022. "Eviction and Poverty in American Cities." Working Paper 26139. National Bureau of Economic Research. https://doi.org/10.3386/w26139.
- Cowin, Rebecca, Hal Martin, and Clare Stevens. 2020. “Measuring Evictions during the COVID-19 Crisis,” Federal Reserve Bank of Cleveland. https://doi.org/10.26509/frbc-cd-20200717.
- Goodman, Laurie, Karan Kaul, and Michael Neal. 2020. “The CARES Act Eviction Moratorium Covers All Federally Financed Rentals—That’s One in Four US Rental Units.” Urban Institute. https://www.urban.org/urban-wire/cares-act-eviction-moratorium-covers-all-federally-financed-rentals-thats-one-four-us-rental-units.
- Goplerud, Dana, and Craig Pollack. 2021. “Prevalence and Impact of Evictions.” Evidence Matters (Summer). https://www.huduser.gov/portal/periodicals/em/Summer21/highlight2.html.
- Hepburn, Peter, Renee Louis, and Matthew Desmond. 2020. “Eviction Tracking System: Version 1.0.” Princeton, NJ: Princeton University. https://evictionlab.org/.
- Martin, Hal. 2022. “Data Updates: Measuring Evictions during the COVID-19 Crisis.” Community Development Briefs, May. https://www.clevelandfed.org/publications/community-development-publications/db-20200902-data-updates-measuring-evictions-during-the-covid-19-crisis.
- Reed, Davin, and Eileen Divringi. 2020. “Household Rental Debt During COVID-19.” Consumer Finance Institute Research Briefs and Special Reports. Federal Reserve Bank of Philadelphia. https://www.philadelphiafed.org/community-development/housing-and-neighborhoods/household-rental-debt-during-covid-19.
- Richter, Francisca García-Cobián, Claudia Coulton, April Urban, and Stephen Steh. 2021. “An Integrated Data System Lens Into Evictions and Their Effects.” Housing Policy Debate 31 (3–5): 762–84. https://doi.org/10.1080/10511482.2021.1879201.
- Scally, Corianne Payton, and Dulce Gonzalez. 2018. 2018b. “Renters Are More Likely than Homeowners to Struggle with Paying for Basic Needs.” Urban Wire (blog). November 1, 2018. https://www.urban.org/urban-wire/renters-are-more-likely-homeowners-struggle-paying-basic-needs.
- US Bureau of Economic Analysis. 2022. “Personal Consumption Expenditures: Services: Housing: Rental of Tenant-Occupied Nonfarm Housing [DTENRC1A027NBEA].” FRED, Federal Reserve Bank of St. Louis. June 22, 2022. https://fred.stlouisfed.org/series/DTENRC1A027NBEA.
- US Department of the Treasury. n.d. “Emergency Rental Assistance Program.” Accessed August 5, 2022. https://home.treasury.gov/policy-issues/coronavirus/assistance-for-state-local-and-tribal-governments/emergency-rental-assistance-program.
Suggested Citation
Martin, Hal. 2022. “Making Sense of Eviction Trends during the Pandemic.” Federal Reserve Bank of Cleveland, Economic Commentary 2022-12. https://doi.org/10.26509/frbc-ec-202212
This work by Federal Reserve Bank of Cleveland is licensed under Creative Commons Attribution-NonCommercial 4.0 International

