

- Share
Subprime May Not Have Caused the 2000s Housing Crisis: Evidence from Cleveland, Ohio
During the 2000s housing bust, Cleveland’s Slavic Village was dubbed “ground zero of the foreclosure crisis” by the national media. Despite this, during the preceding housing boom Cleveland had stable house price growth and relatively low mortgage debt growth, a stark contrast to circumstances in areas such as California that had exceptionally high house price and mortgage debt growth. What explains the relatively minor housing boom and perceived sharp downturn in Cleveland? In this Commentary I show that while subprime debt was a prominent source of debt in Cleveland and especially in its Slavic Village neighborhood during the 2000s, it is difficult to peg subprime debt as playing a causal role in the subsequent foreclosure crisis.

The views authors express in Economic Commentary are theirs and not necessarily those of the Federal Reserve Bank of Cleveland or the Board of Governors of the Federal Reserve System. The series editor is Tasia Hane. This paper and its data are subject to revision; please visit clevelandfed.org for updates.
The housing boom that preceded the 2008 financial crisis was characterized by high house price growth, a doubling of mortgage debt on household balance sheets,1 and a substantial increase in subprime lending.2 The subsequent foreclosure crisis was characterized by a large number of subprime foreclosures.3 Initially, these facts led to the conclusion that an increase in the availability of mortgage credit—especially the expansion of subprime—allowed previously constrained borrowers to buy more housing by taking on an unsustainable amount of mortgage debt, fueling the housing boom and leading to the bust.4
More recent analysis has caused economists to reconsider this narrative. While subprime debt did rise, other forms of mortgage debt for lower-income borrowers—largely Federal Housing Administration (FHA) loans—declined in a manner that left the share of debt held by lower-income households unchanged. So while mortgage debt increased, it did so for high- and low-income borrowers alike. The same is true of defaults. Subprime made up a large share of defaults, but loans to lower-income borrowers always make up a disproportionate share of defaults and foreclosures. Foreclosure rates rose during the bust, but they did so proportionately for low- and high-income borrowers.5 These facts imply that the housing boom was driven by a broad-based increase in demand for housing—such as might be caused by optimistic expectations for future house prices—of which the growth in subprime was a consequence or a symptom as opposed to a cause.
However, there was significant geographic variation in how the housing boom and bust played out. While the housing boom in terms of price and mortgage debt growth was largely concentrated in states such as California and Arizona, it was a neighborhood in Cleveland— Slavic Village—that received the moniker “ground zero of the foreclosure crisis.”6 By most measures, the housing boom in Cleveland was small relative to the nation’s. Cleveland did not experience an increase in house price growth (see figure 1, panel A). The outstanding stock of mortgage debt on household balance sheets in Cleveland grew by about 50 percent, far less than the more than 100 percent increase for the country as a whole (see figure 1, panel B). In contrast, subprime credit was a relatively large component of the Cleveland mortgage market during the boom. At its peak in 2006, subprime debt accounted for 25 percent of outstanding mortgage debt in Cleveland—far higher than for the country as a whole (see figure 2). How does Cleveland’s experience relate to the two narratives of the housing boom discussed above?
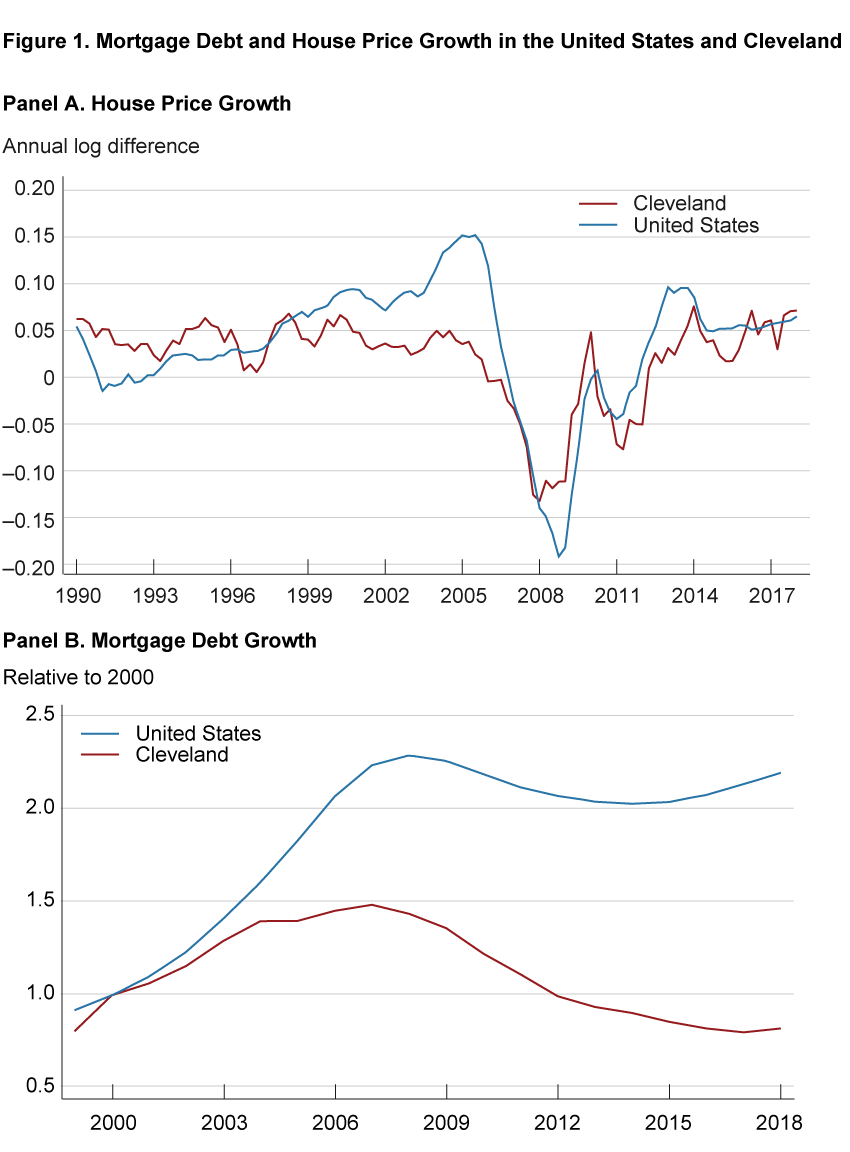
Note: A Cleveland city-level house price index is calculated as the average of the relevant zip-code-level house price indices from CoreLogic. All price indices include distressed sales.
Sources: CoreLogic; FRBNY CCP/Equifax; Flow of Funds.
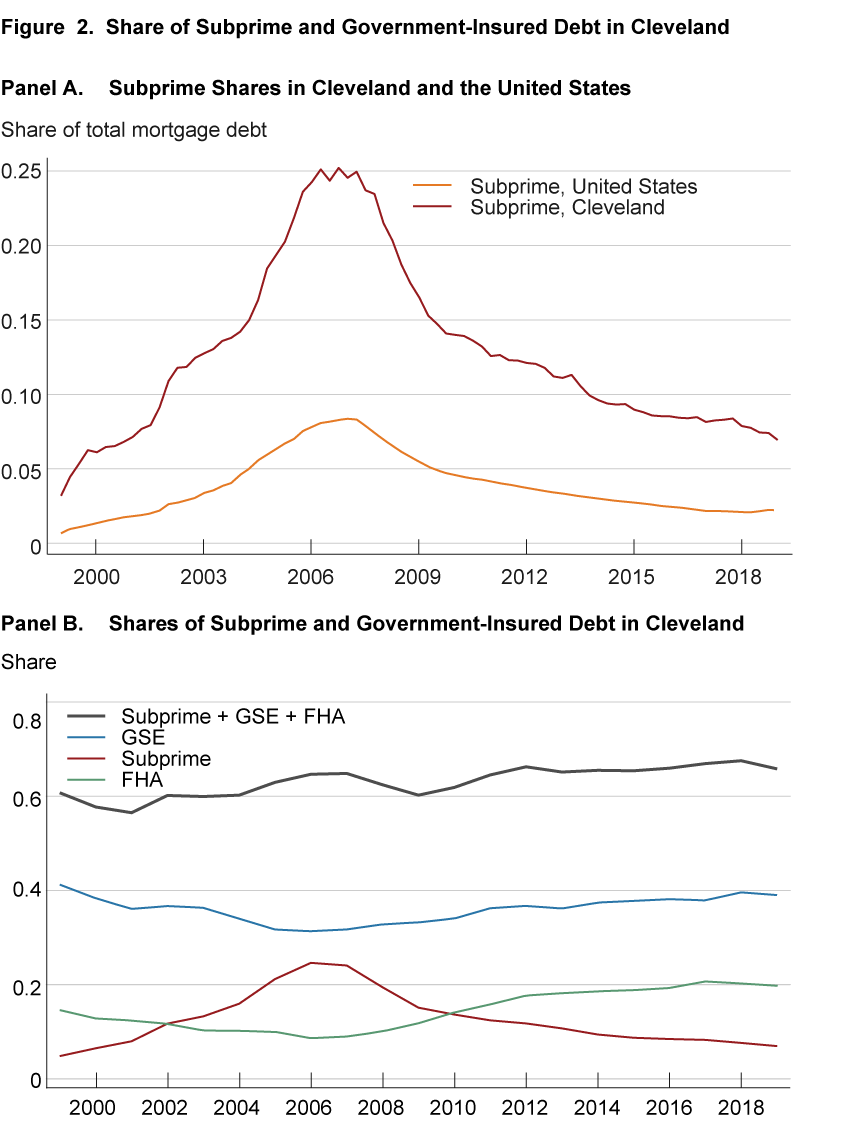
Note: In panel A, the total value of outstanding mortgage debt for the United States is from the Flow of Funds.
Sources: CoreLogic ABS database; Flow of Funds; FRBNY CCP/Equifax.
In this Commentary, I present three facts about the housing boom in Cleveland that support the narrative that subprime was largely a consequence of a broader national phenomenon. This distinction between subprime debt as the cause or the consequence of the 2000s housing boom has implications for policy. If easy access to credit and subprime played a causal role in the boom and bust, limiting access to mortgage credit is the natural policy response. However, stricter access to credit limits the ability of households to transition to homeownership. Some argue that postcrisis, access to credit has been too limited, and a lack of access has kept more marginal borrowers from building wealth by owning a home (Goodman, 2017).7
Data
I analyze Cleveland’s housing and mortgage markets using data from two main sources. The first is the Federal Reserve Bank of New York’s Consumer Credit Panel (CCP), a quarterly, longitudinal 5 percent sample of individual credit histories supplied by the Equifax credit bureau. The data set begins in 1999, and because individual-level credit histories are included in the sample based on the last two digits of the individual’s Social Security number, the data set is automatically updated to incorporate new entrants over time. Specific information about each individual is limited to his or her geographic location (down to the census block) and age.
The CCP contains detailed information on mortgage debt. It includes the number of active loans for each borrower and the outstanding balances over the life of the loan of first mortgages, subordinate mortgages, and home equity lines of credit (HELOCs). Loans backed by Fannie Mae and Freddie Mac are flagged, as are those insured by the Federal Housing Administration (FHA) and the Veterans Administration (VA), circumstances that allow me to calculate the stock of outstanding debt by whether it is government insured or not. In general, when I refer to FHA debt, I mean the sum of FHA and VA. The balances are also demarcated to show whether borrowers are 30-, 60-, 90-, or 120+ days delinquent on any of their mortgages. Following Foote, Loewenstein, and Willen (2020), I define a default as the first transition of a mortgage to 90-day delinquency. I then calculate the default rate as the share of all active first liens in quarter t − 1 that transition to 90-day delinquency in quarter t, where the denominator is all mortgages that were at risk of default in quarter t − 1.
Information on the balance of subprime debt on household balance sheets comes from the CoreLogic Private Label Securities ABS Database, which provides loan-level data for mortgages that have been packaged into subprime and Alt-A private-label securities. This data set contains the universe of loans sold into subprime private-label securities, which are the vast majority of subprime loans. Similar to the CCP, it provides the current balance of each loan over the life of the loan.
I obtain house price information from two sources: CoreLogic and the Federal Housing Finance Agency (FHFA). Both have zip-code-level repeat sale house price indices. However, the coverage of the two sources varies slightly. Only the FHFA has indices for both zip codes 44105 and 44113, the two zip codes I use to define Slavic Village and the combination of Tremont and Ohio City, respectively.
Throughout this Commentary I define the city of Cleveland as the following 16 zip codes: 44102, 44103, 44104, 44105, 44106, 44108, 44109, 44110, 44111, 44113, 44114, 44115, 44119, 44120, 44127, 44135. See figure 3 for a map.
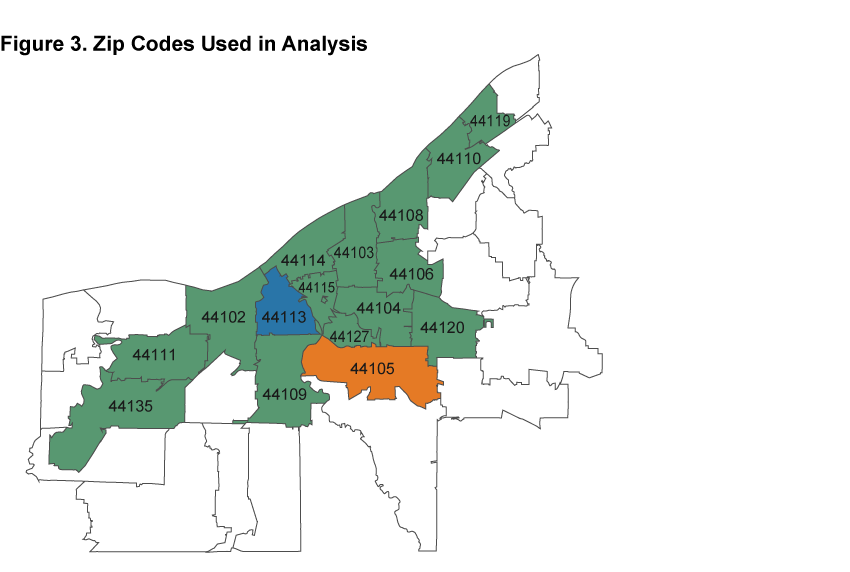
Note: All highlighted and labeled zip codes are used in the analysis of the city of Cleveland. Zip code 44113 (in blue) is used to represent the neighborhoods of Tremont and Ohio City. Zip code 44105 (in orange) is used to represent Slavic Village.
The Housing Boom in Cleveland
If the increased availability of subprime mortgage credit was the cause of the housing boom and bust, we would expect to see certain patterns in the data. First, mortgage debt held by borrowers with low income and low credit scores should have increased by more than mortgage debt held by borrowers with high income and high credit scores. Second, during the crash, default rates for subprime borrowers should have increased by more than default rates for prime borrowers. Foote, Loewenstein, and Willen (2020) showed that these facts are not true at the national level: Mortgage debt grew proportionately for high- and low-income households alike during the boom, as did default rates during the bust.
I show that these facts also apply to Cleveland. Mortgage debt held by low-credit-score borrowers in Cleveland did not increase any faster than mortgage debt held by high-credit-score borrowers. And despite Cleveland’s seeing higher subprime growth than did the nation, default rates grew less in Cleveland than they did in the rest of the country. I then compare two neighborhoods of Cleveland and find further evidence that subprime was not a cause of either the housing boom or bust. Slavic Village, which saw some of the highest growth in subprime debt during the boom, had a smaller housing boom in terms of mortgage debt and house price growth than the combined area of Tremont and Ohio City, which had substantially less subprime growth. Furthermore, neither saw much growth in default rates during the bust.
Mortgage Debt
Despite the relatively large increase in subprime debt in Cleveland during the boom, mortgage debt held by low-credit-score borrowers did not increase any faster than mortgage debt held by high-credit-score borrowers because low-credit-score borrowers were substituting away from FHA- and GSE-insured debt toward subprime. Prior to the housing boom, borrowers without sufficient savings could either acquire loans from the FHA or from the GSEs with as little as 3 percent down. While subprime grew as a component of the Cleveland mortgage market, debt from these government-sponsored sources was declining. Figure 2, panel B shows that the combined share of subprime, FHA, and GSE debt was almost unchanged throughout the entire period.
To be clear, on average GSE loans were, and still are, less risky than either FHA or subprime loans. GSE loans had lower loan-to-value (LTV) ratios and generally went to borrowers with higher credit scores. However, the GSEs were also required to purchase loans originated to low-income households and to households living in low-income areas and areas with a high proportion of minorities.8 Between 2001 and 2004, it was required that 50 percent of the GSEs’ purchases be from borrowers with incomes below the area median income,9 31 percent of their purchases be loans on properties in underserved areas (defined as census tracts with high minority shares or low incomes), and 20 percent of their purchases be loans to borrowers with incomes substantially below the area median income.10 The GSEs met these goals.11 The loans qualifying for these goals naturally represented the riskiest of GSE-insured loans. As subprime grew, it supplanted these loans—those purchased to meet the GSEs’ affordable housing targets—along with those normally insured by the FHA.
The end result was that the shares of mortgage debt held by the top and bottom quintiles of borrower credit scores were unchanged over the course of the boom. Figure 4, panel A is a plot of the share of mortgage debt held by the top and bottom quintiles of the Cleveland population by Equifax Risk Score.12 The shares held by both quintiles remained fairly flat throughout the housing boom until 2008, when the share held by the top quintile began to increase while the share held by the bottom quintile began to decrease. This divergence after 2008 is evidence of the tighter credit standards that have been in place since the financial crisis.
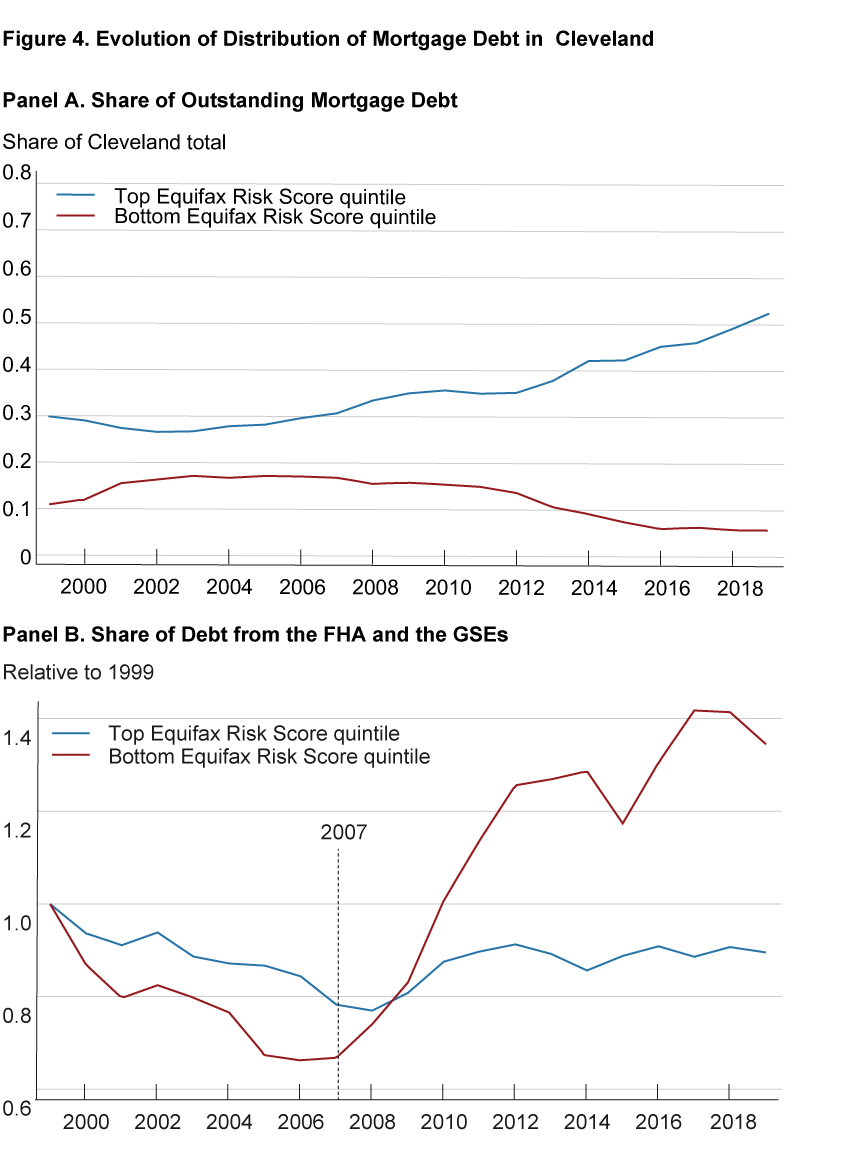
Note: The denominator in the top panel is total outstanding mortgage debt in Cleveland. The denominator in the bottom panel is the total outstanding debt held by each Equifax Risk Score quintile.
Source: FRBNY CCP/Equifax.
The bottom Equifax Risk Score quintile saw a larger decline in the share of its debt coming from the FHA and the GSEs. Figure 4, panel B is a plot of the share of debt held by each Equifax Risk Score quintile that is from either the FHA or the GSEs. The shares are normalized to better compare their trajectory over time. While the top quintile saw a decline of about 20 percent in its share of debt coming from the FHA and GSEs from 1999 and 2007, the bottom-credit-score quintile saw a decline of 30 percent over the same time period. To keep its overall share of total mortgage debt stable, the bottom quintile needed a greater increase in mortgage debt from another source: subprime. It is also noteworthy that during the bust, the share of debt from the FHA and GSEs grew to be a far larger share of the debt held by the lowest Equifax Risk Score quintile, while for the highest Equifax Risk Score quintile, the share remained below its value in 1999. This is evidence of the strong role played by government-insured debt in the recovery.
Defaults
During the bust, default rates grew less in Cleveland than they did in the rest of the country because default rates in Cleveland were already high in 2000, before the large increase in subprime lending. Furthermore, default rates in Cleveland rose by a smaller percentage for borrowers of subprime debt than for other borrowers.
Figure 5, panel A is a plot of the 90-day default rate in Cleveland, and the 90-day default rate for the country as a whole. Between the years 2000 and 2009, the default rate in Cleveland increased by 64 percent: from 7.6 percent to 12.6 percent. That is certainly a substantial increase, but it pales in comparison to the country as a whole, which went from a default rate of 2.6 percent in 2000 to a rate of 9.7 percent in 2009: an increase of over 250 percent. That default rates rose in Cleveland should be unsurprising. As shown in figure 1, house prices in Cleveland fell during the bust, implying that many households lost equity in their homes. It is well-known that households with negative equity are more likely to default than households with positive equity (Foote and Willen, 2018).13
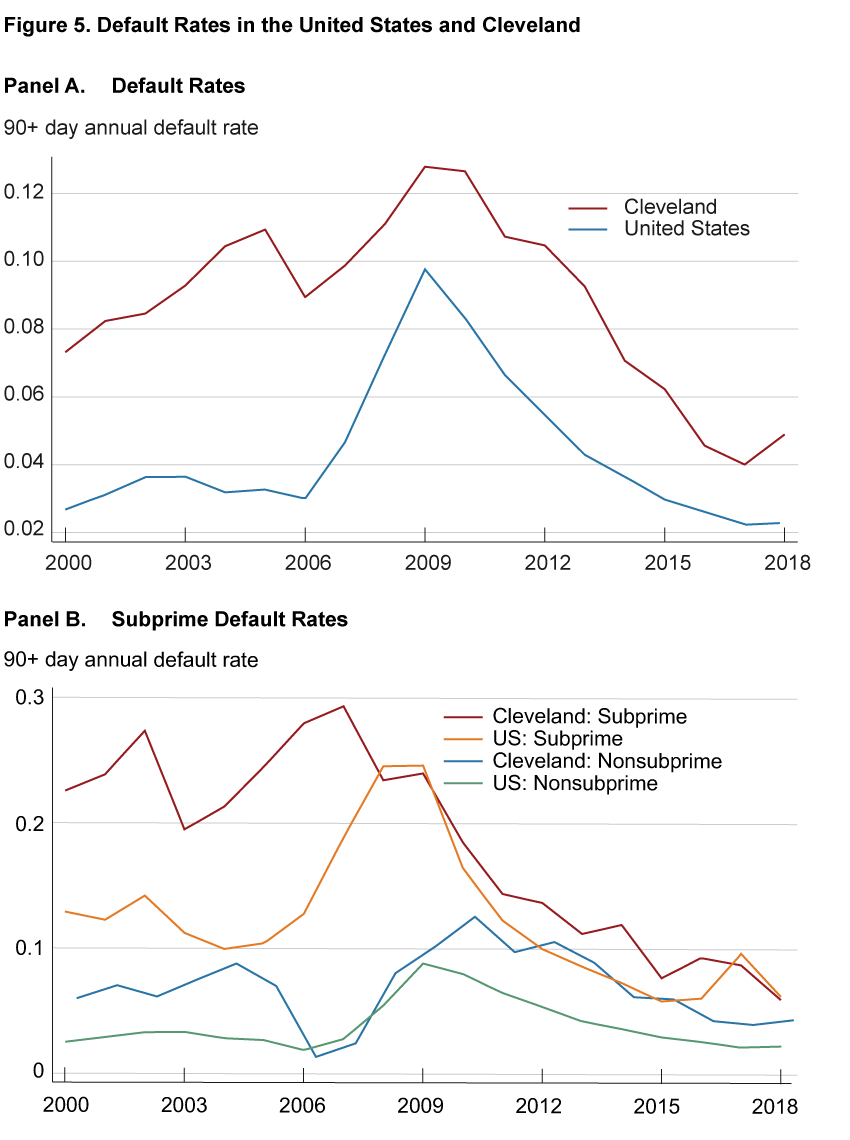
Note: The subprime default rate is calculated as the 90-day default rate for loans in the CoreLogic ABS database. Non-subprime defaults are the difference between total 90-day defaults in the CCP minus 90-day subprime defaults according to the CoreLogic ABS database relative to all loans at risk of 90-day default in the CCP.
Sources: CoreLogic ABS database; FRBNY CCP/Equifax.
It is notable that the default rate among subprime loans in Cleveland was effectively flat between 2000 and 2009. Figure 5, panel B is a depiction of the default rates for subprime and nonsubprime loans in both Cleveland and the United States. In the early 2000s, the default rate on subprime loans in Cleveland was about 10 percentage points higher than the default rate on subprime loans in the United States. However, during the financial crisis, the default rate on subprime loans in the country shot up to match the rate in Cleveland while the default rate on subprime loans in Cleveland remained largely unchanged. That default rates on subprime loans in Cleveland in 2000 were high implies that lenders and investors were aware early on of the credit risk posed by Cleveland’s subprime borrowers, yet they were still willing to continue lending to borrowers in the area. In other words, neither lenders nor investors were misled about the riskiness of these loans.
Comparing Two Cleveland Neighborhoods
In this section, I compare two inner-city neighborhoods in Cleveland that saw substantially different amounts of subprime debt growth. I show that despite this difference, both neighborhoods had nearly identical experiences during the boom and bust, further supporting the view that the availability of subprime debt to low-income borrowers was not a cause of the housing crisis.
The first neighborhood is Slavic Village.14 While attempts have been made to revitalize Slavic Village, it has seen its population, and real average household income, decline. In 2000 its median Equifax Risk Score was below 650. It was also the subject of substantial news coverage during the foreclosure crisis because of its high number of foreclosures. At the peak of the boom, Slavic Village had one of the highest dollar amounts of subprime debt per household in the city. At its peak in 2007, subprime made up 50 percent of the outstanding mortgage debt held by residents of the neighborhood (see figure 6, panel A).
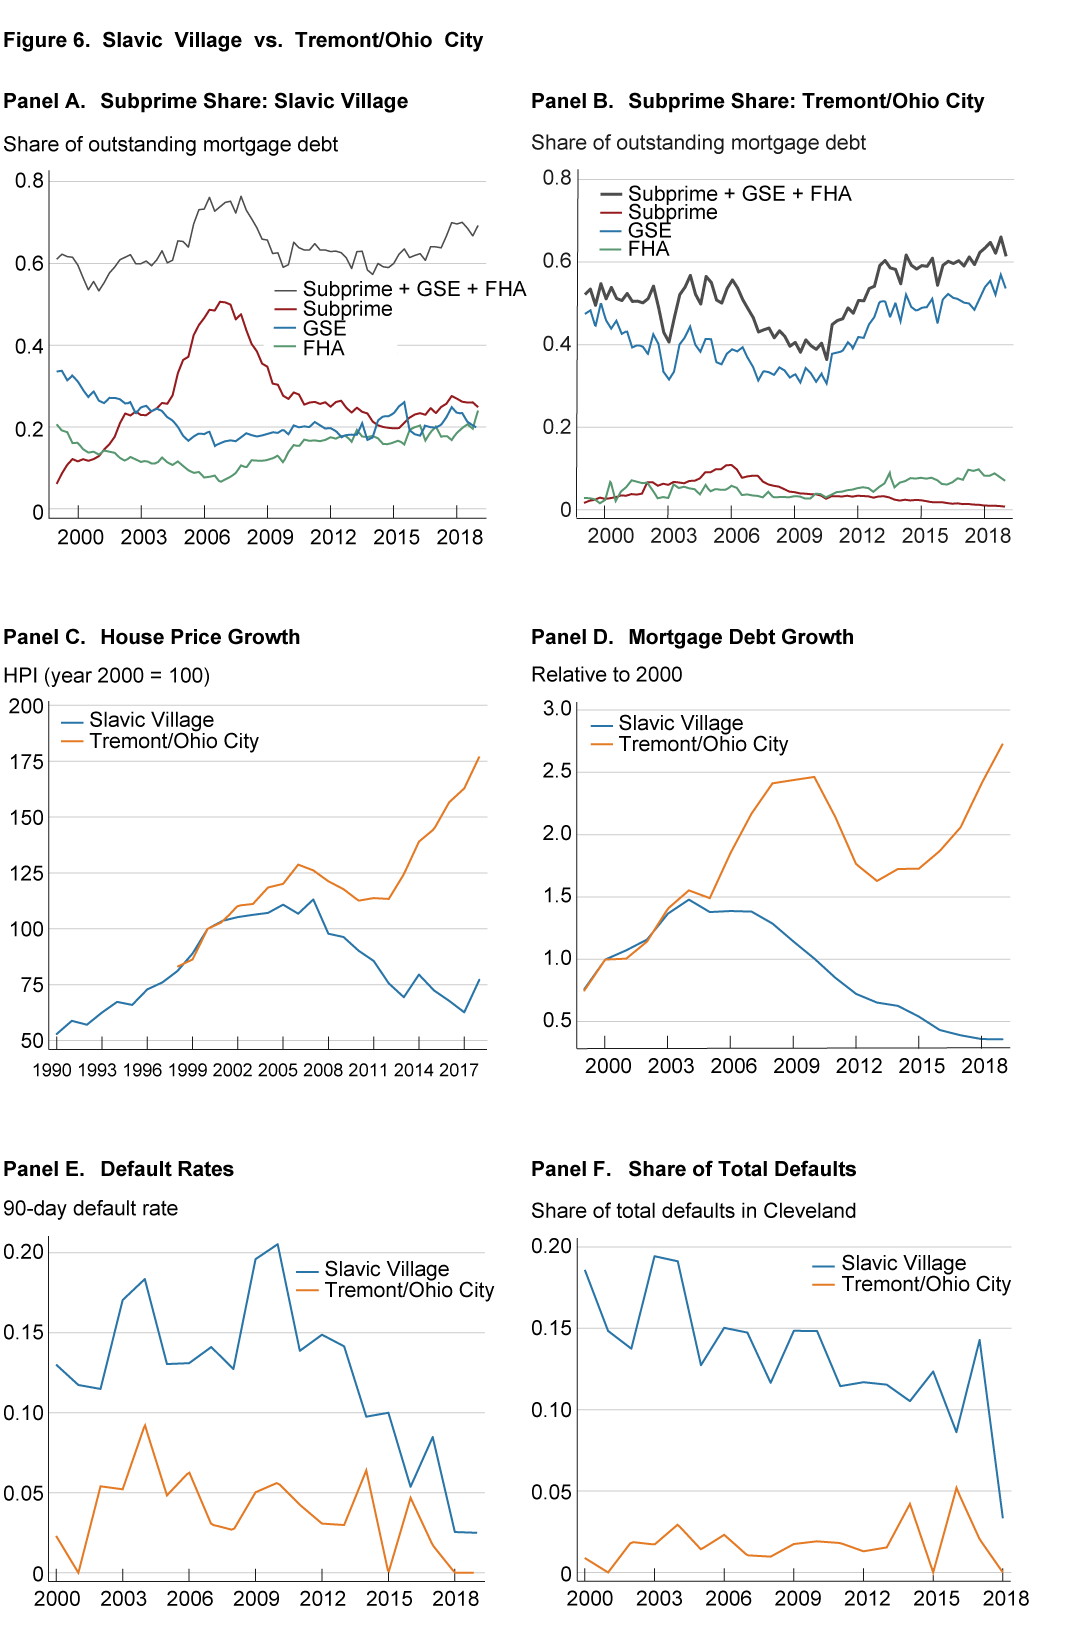
Note: Slavic Village is defined as the zip code 44105. Tremont/Ohio City is defined as the zip code 44113.
Sources: FRBNY CCP/Equifax, CoreLogic ABS database, FHFA.
The second is a neighborhood that comprises two areas, Tremont and Ohio City, that share the same zip code.15 Since the 1990s Tremont and Ohio City have seen an influx of young professionals and investment that has made the area a coveted destination within the city. Its population and average income have grown steadily, and during the housing boom its median Equifax Risk Score was above 700. Tremont/Ohio City had about a third as much subprime debt per household as Slavic Village, and subprime barely breached 10 percent of the area’s outstanding mortgage debt (see figure 6, panel B).
In theory, Slavic Village was home to many more people who were constrained in their access to credit than Tremont/Ohio City. According to the subprime narrative, subprime allowed people who were previously constrained in their ability to purchase housing to buy a first home or a larger home, resulting in rising house prices and more mortgage debt, and higher growth in defaults when fortunes turned. One would then expect to see a larger increase in house prices and mortgage debt in Slavic Village than in Tremont/Ohio City. However, while there was much more subprime lending in Slavic Village than in Tremont/Ohio City, it did not result in a more pronounced housing boom or bust in the neighborhood.
In both neighborhoods, the increase in subprime was offset by a decline in FHA and GSE mortgage debt. As shown in figure 6, panels A and B, the aggregate share of subprime, FHA, and GSE debt remained fairly flat throughout the boom and bust. There was a slight increase within Slavic Village in 2006 and 2007, but that increase led neither to a larger housing boom in the neighborhood nor to higher subsequent growth in defaults. In Tremont/Ohio City the aggregate share declined during the bust and then rose again.
The housing boom was not a larger event in Slavic Village than it was in Tremont/Ohio City. Both house prices (see figure 6, panel C) and outstanding mortgage debt balances (see figure 6, panel D) grew more in Tremont/Ohio City than they did in Slavic Village.
In terms of mortgage defaults, Slavic Village also did not experience a more dramatic housing bust. As shown in figure 6, panels C and D, after the boom, Slavic Village never really recovered in terms of either house price or mortgage debt growth. However, during the foreclosure crisis—when it became notorious as ground zero of the foreclosure crisis—Slavic Village did not see any significant increase in default rates (see figure 6, panel E). Default rates in Slavic Village hovered around 15 percent in 2000. They rose slightly during the financial crisis and Great Recession, but not by much. The same is true of Tremont/Ohio City.
A way to compare the relative impact of each neighborhood is to look at how much each neighborhood contributed to total defaults in the city. As a neighborhood with one of the highest amounts of subprime debt per household, one might have expected Slavic Village to have accounted for a growing share of defaults in the city. However, early in the decade, Slavic Village accounted for about 15 percent of all defaults in Cleveland. In 2009, that share had fallen, albeit very slightly. The same is true of the other neighborhoods with high amounts of subprime debt per household. Tremont/Ohio City—with substantially less subprime debt—accounted for less than 3 percent of all defaults in Cleveland and that share remained constant during both the boom and the bust.16
Conclusion
Cleveland’s experience of the housing boom did not follow the newsworthy narrative of high house price and mortgage debt growth. Instead it saw low and steady house price growth and moderate mortgage debt growth. Despite this, a neighborhood of Cleveland—Slavic Village—was the poster child of the subsequent foreclosure crisis because of its high amount of subprime borrowing and high number of foreclosures. What was underappreciated at the time was that mortgage defaults and foreclosures were not new to Slavic Village but had been a feature of the neighborhood since before the housing boom and the emergence of subprime.
Cleveland has struggled over the past few decades. During the 2000s, manufacturing employment in the United States declined, directly affecting Cleveland (Schweitzer, 2017). As employment declined, population declined. Between 2000 and 2007, the city of Cleveland lost over 10 percent of its population. Because of this history, Cleveland has a relatively large number of low-credit-score borrowers. The median resident of Cleveland has both lower income and credit quality than the median resident of the United States. In 2005, the median household income earned in Cleveland was $24,000, compared to $46,000 for the country. The median Equifax Risk Score for all households in Cleveland in 2005 was 623; in the country it was 709. The population of Cleveland has also reallocated itself within the city, with more people moving out of low-income neighborhoods and into higher-income neighborhoods, a process that sped up during the Great Recession (Nelson and Klesta, 2017). Neighborhoods such as Slavic Village have borne the brunt of this change.
Despite its prevalence, there is no evidence that subprime debt per se was a catalyst in this process. While it is impossible to know for sure, a story that fits the facts is that subprime was simply a lenient and relatively low-cost way of obtaining mortgage debt. Cleveland borrowers who would have otherwise relied on the FHA or GSEs for debt switched to subprime because it allowed them to avoid long wait times, cumbersome application processes, and the requirement that they purchase private mortgage insurance. Because of its history, Cleveland had a relatively large share of borrowers for whom this switch made sense.
It is certainly possible that had subprime not existed, Cleveland—and Slavic Village—still would have seen a similar number of foreclosures. It simply would have been foreclosures on properties backed by FHA and GSE-insured loans instead of subprime.
Footnotes
- According to the Federal Reserve’s Flow of Funds, the aggregate stock of mortgage debt on the liability side of household balance sheets doubled from $5.3 trillion in 2001 to $10.6 trillion in 2007. Return
- Subprime debt is private—not government-insured—mortgage debt securitized in subprime asset-backed securities. From 2001–2007, outstanding subprime debt grew by 550 percent, or more than 5 times as fast as mortgage debt as a whole. Return
- According to the Mortgage Bankers Association, in the second quarter of 2008, subprime loans accounted for 48.2 percent of all foreclosure starts. Return
- Ford et al. (2013) make this argument specifically for Cleveland. Return
- See Foote, Loewenstein, and Willen (2020). Return
- In the media, Slavic Village was defined as the zip code 44105, which is how I define it in this Commentary (Ford et al., 2013). Return
- The alternative policy response to prevent another financial crisis is to increase supervision of the financial sector’s exposure to certain products, such as subprime loans. Return
- These goals were initially put in place in 1992, when the Federal Housing Enterprises Financial Safety and Soundness Act was passed. The goals were enhanced early in the 2000s to further promote affordable homeownership. See https://www.huduser.gov/portal/Publications/PDF/gse.pdf. Return
- This is generally defined as the median income from the Metropolitan Statistical Area. Return
- Loans could count toward multiple goals, so at minimum, 50 percent of the loans purchased by the GSEs met an affordable housing goal. Return
- See the FHFA publication “Overview of the Enterprises’ Housing Goal Performance, 2001–09,” available at https://www.fhfa.gov/PolicyProgramsResearch/Programs/AffordableHousing/Documents/Historical_Perf/Overview_2001-2009.pdf. Return
- The Equifax Risk Score is a credit score calculated by Equifax that ranks borrowers from 280 to 850, with lower values indicating lower credit quality. Return
- It is also known that while negative equity increases the likelihood of default, the majority of households with negative equity do not default, which is why the default rate in Cleveland did not increase even more. Return
- I define Slavic Village as the zip code 44105. Return
- I define Tremont and Ohio City as the zip code 44113. Return
- The idea that subprime, per se, was not the root cause of the problems in Slavic Village does not mean there was no mortgage-related fraud in the neighborhood. For example, there was a scheme involving a collaboration between lenders and appraisers that resulted in subsequent indictments. However, this scheme largely affected properties already in foreclosure (Coulton et al., 2010). Return
References
- Coulton, Claudia, Kathryn W. Hexter, April Hirsh, Anne O’Shaughnessy, Francisca G.-C. Richter, and Michael Schramm. 2010. “Facing the Foreclosure Crisis in Greater Cleveland: What Happened and How Communities Are Responding.” Federal Reserve Bank of Cleveland, Special Report. https://engagedscholarship.csuohio.edu/urban_facpub/374.
- Foote, Christopher L., Lara Loewenstein, and Paul Willen. 2020. “Cross-Sectional Patterns of Mortgage Debt during the Housing Boom: Evidence and Implications.” Forthcoming: Review of Economic Studies. https://doi.org/10.1093/restud/rdaa034.
- Foote, Christopher L., and Paul S. Willen. 2018. “Mortgage-Default Research and the Recent Foreclosure Crisis.” Annual Review of Financial Economics, 10: 59–100. https://doi.org/10.1146/annurev-financial-110217-022541.
- Ford, Frank, April Hirsh, Kathryn Clover, Jeffrey A. Marks, Robin Dubin, Michael Schramm, Tsui Chan, Nina Lalich, Andrew Loucky, and Natalia Cabrera. 2013. “The Role of Investors in the One-to-Three-Family REO Market: The Case of Cleveland.” Washington, DC: What Works Collaborative. https://www.urban.org/research/publication/role-investors-one-three-family-reo-market-case-cleveland.
- Goodman, Laurie S. 2017. “Quantifying the Tightness of Mortgage Credit and Assessing Policy Actions.” Boston College Journal of Law & Social Justice, 37: 235. https://heinonline.org/HOL/P?h=hein.journals/bctw37&i=247.
- Nelson, Lisa, and Matt Klesta. 2017. “Home Lending in Cuyahoga County Neighborhoods.” Federal Reserve Bank of Cleveland, A Look Behind the Numbers. https://www.clevelandfed.org/publications/cd-reports/2017/albtn-20170713-home-lending-in-cuyahoga-county-neighborhoods.
- Schweitzer, Mark E. 2017. “Manufacturing Employment Losses and the Economic Performance of the Industrial Heartland.” Federal Reserve Bank of Cleveland, Working Paper No. 17-12. https://doi.org/10.26509/frbc-wp-201712.
Suggested Citation
Loewenstein, Lara. 2020. “Subprime May Not Have Caused the 2000s Housing Crisis: Evidence from Cleveland, Ohio.” Federal Reserve Bank of Cleveland, Economic Commentary 2020-25. https://doi.org/10.26509/frbc-ec-202025
This work by Federal Reserve Bank of Cleveland is licensed under Creative Commons Attribution-NonCommercial 4.0 International

